Mind-bending 3D Maps | Showreel
A Clear View of Global Shipping Traffic
The Great Fire of London (1666)
Tokyo Eat Map
Tokyo Eat Map
London Undeground
London Undeground
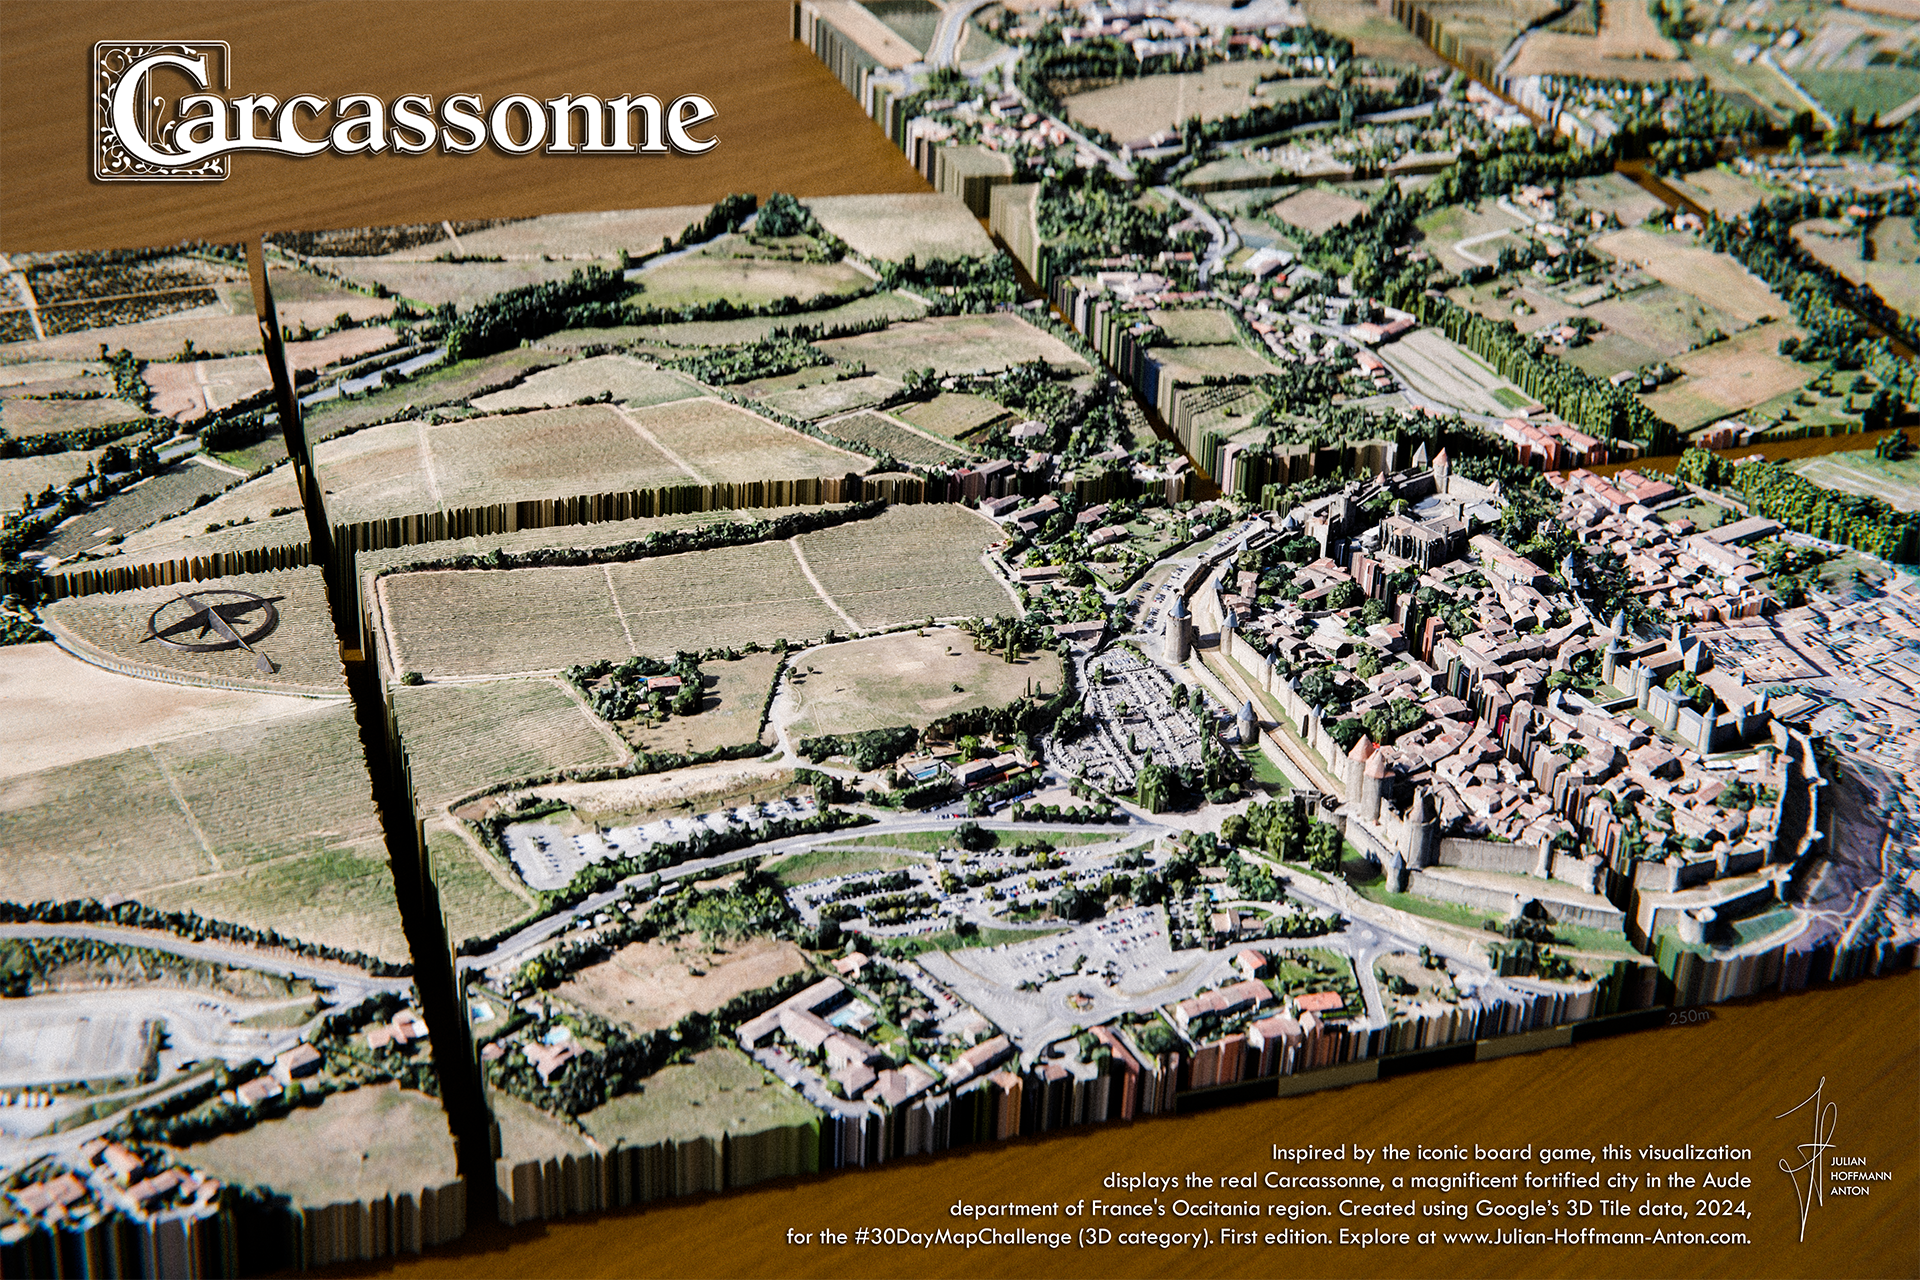
IRL_Carcassonne_v94_labels.png
La Carte des Vins de France
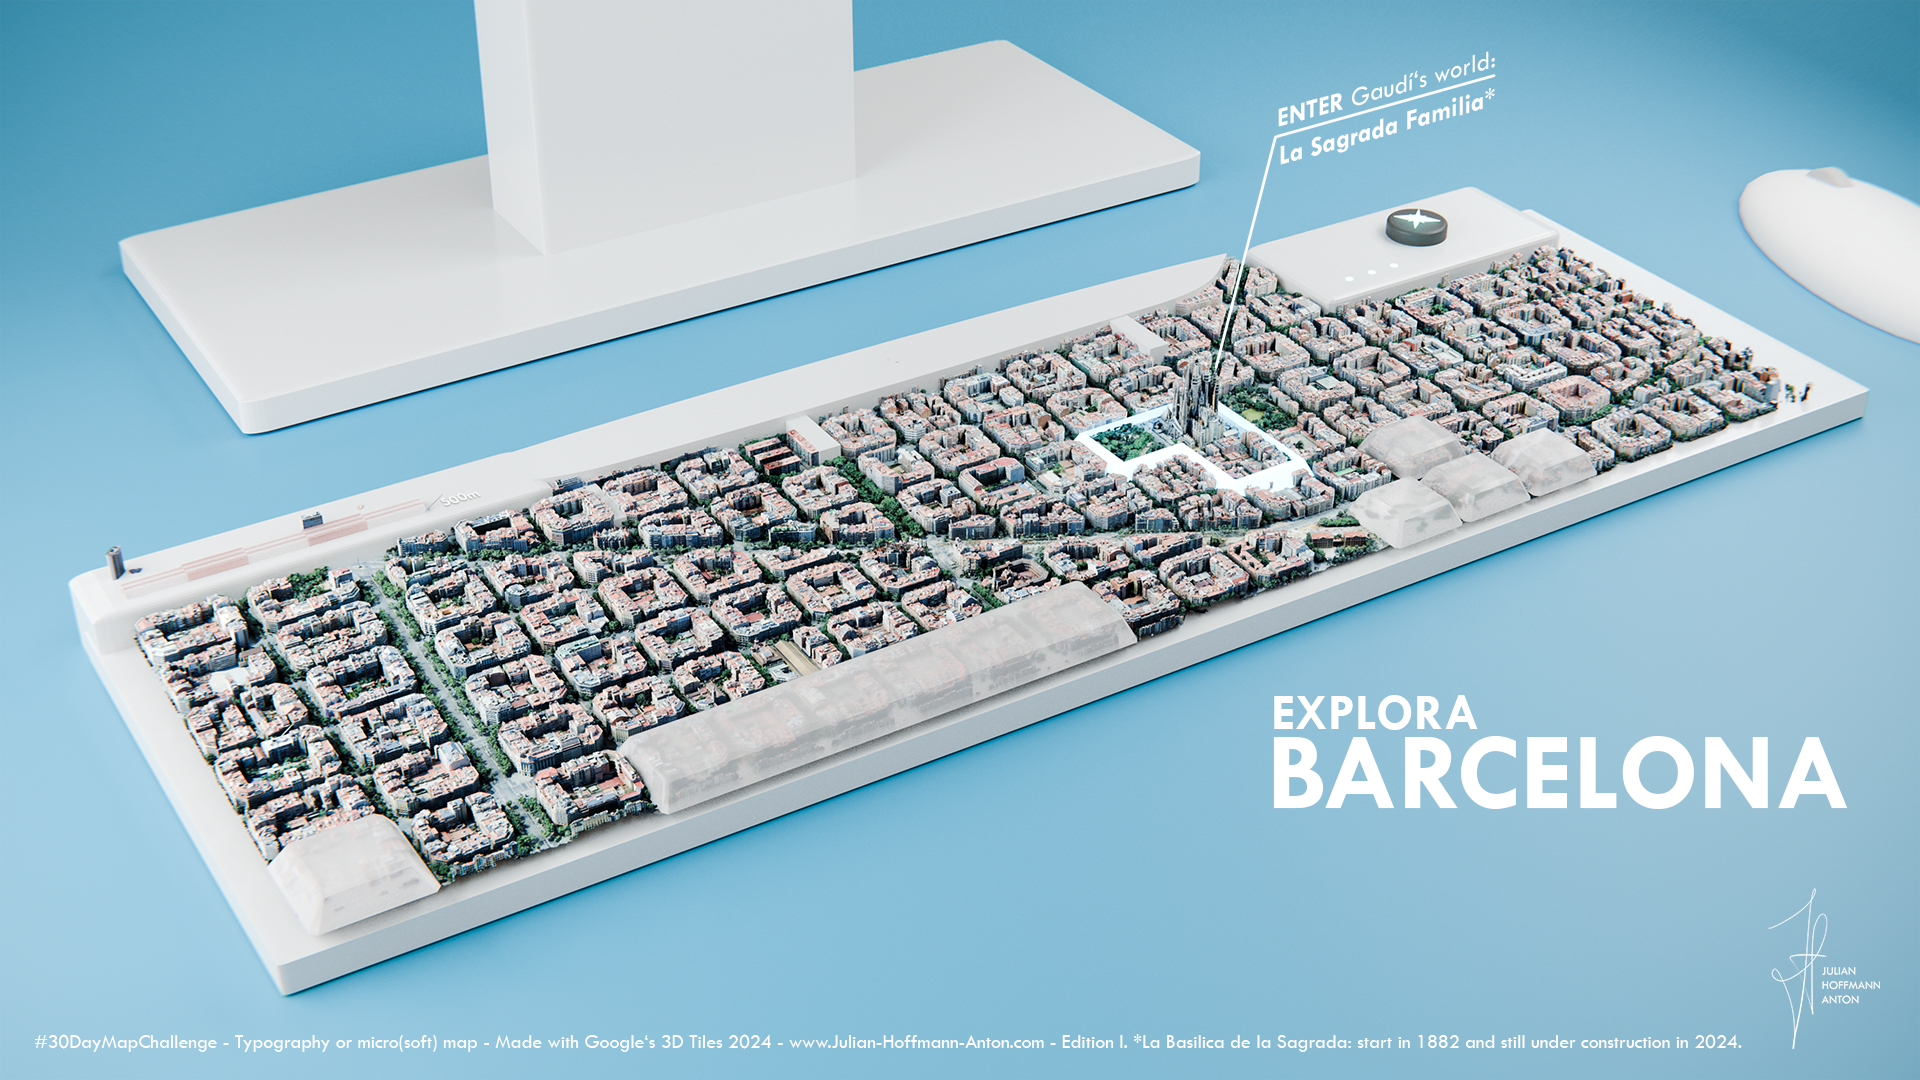
Barcelona (Typography)
mont_blanc_example_3hd.png
The City of London
The City of London
Global Shipping Density Network
map_day_27_Tokyo-Eat_Map_vJH_animation_print8K_PRINT_FHD.png
Halloween_phone_america_v2_fff.png
The Train Lines of Switzerland
Halloween_phone_africa_v2fff.png
Halloween_phone_australia_v3_ffffff.png
World Population 1950 - 2100
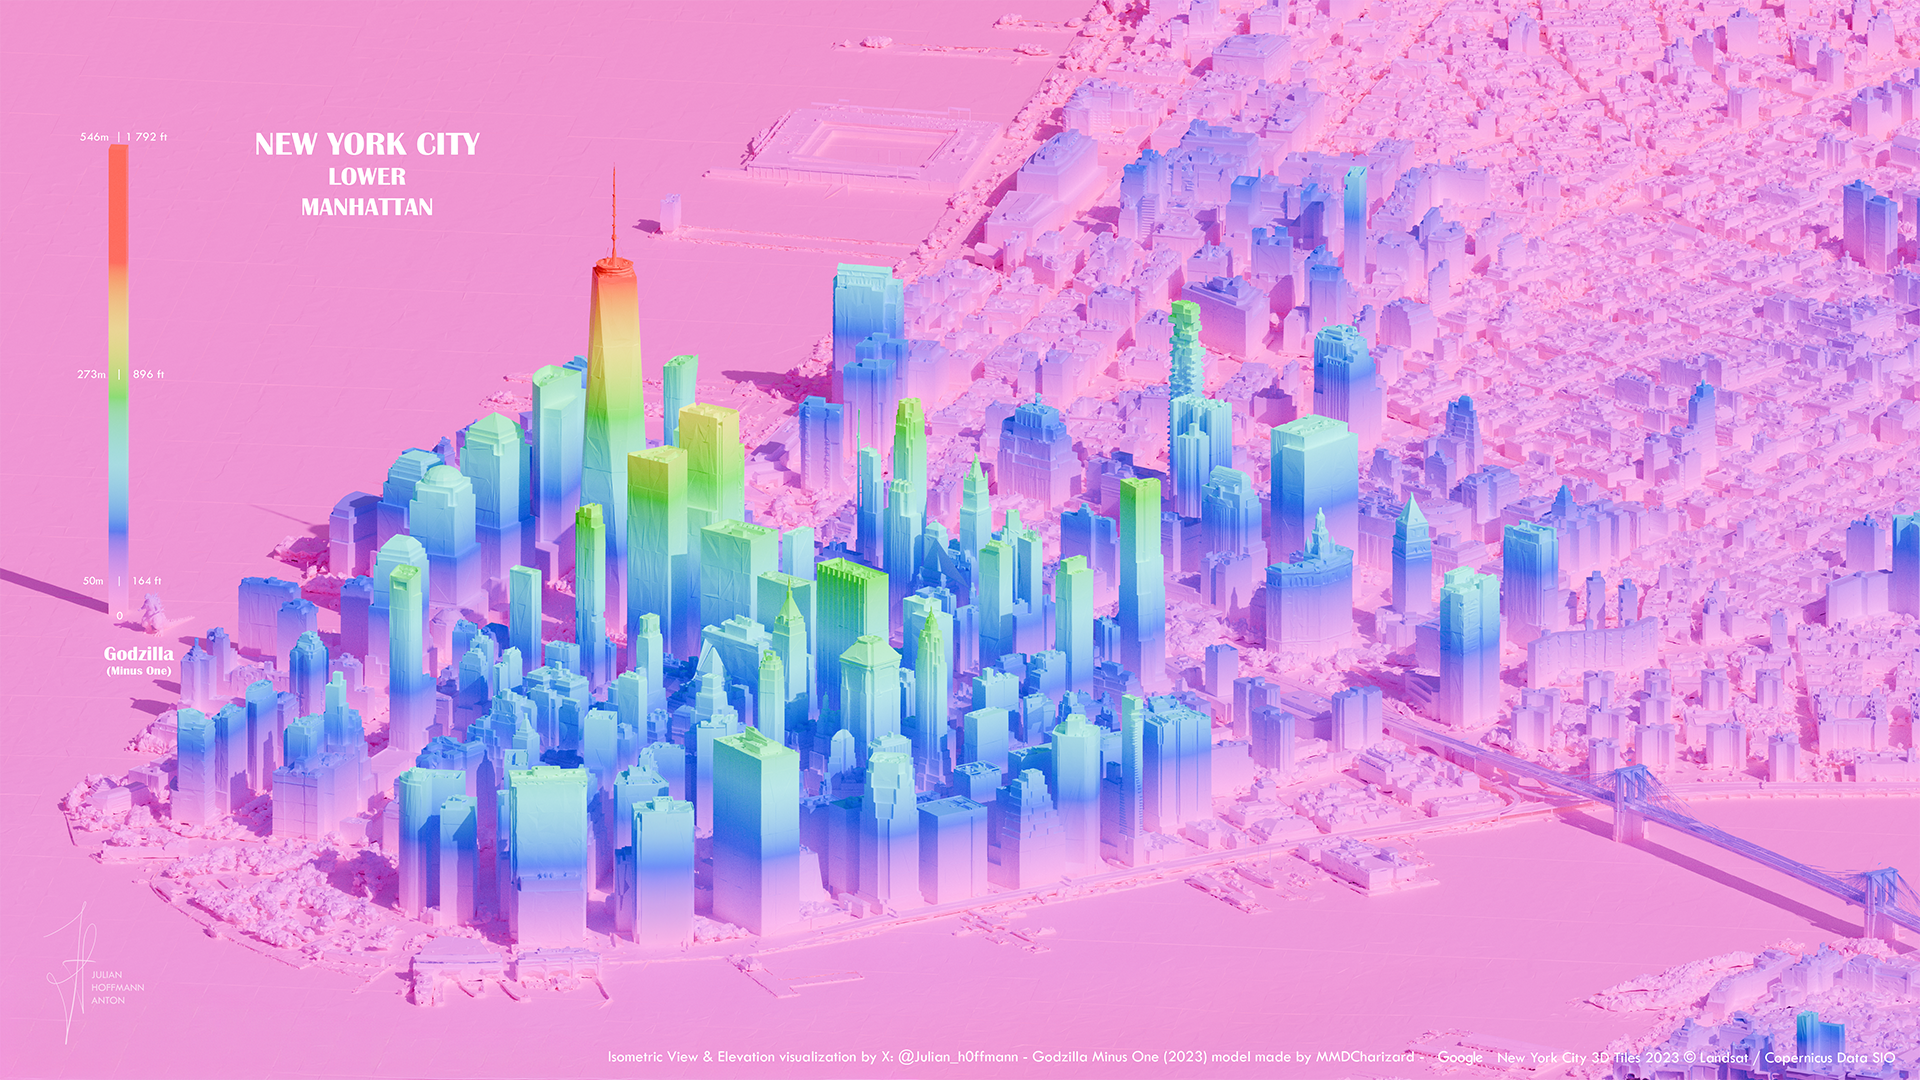
ISometric_new_york_vhd_Godzilla_minus_one_v4_HD.png
Golden Age of Creativity
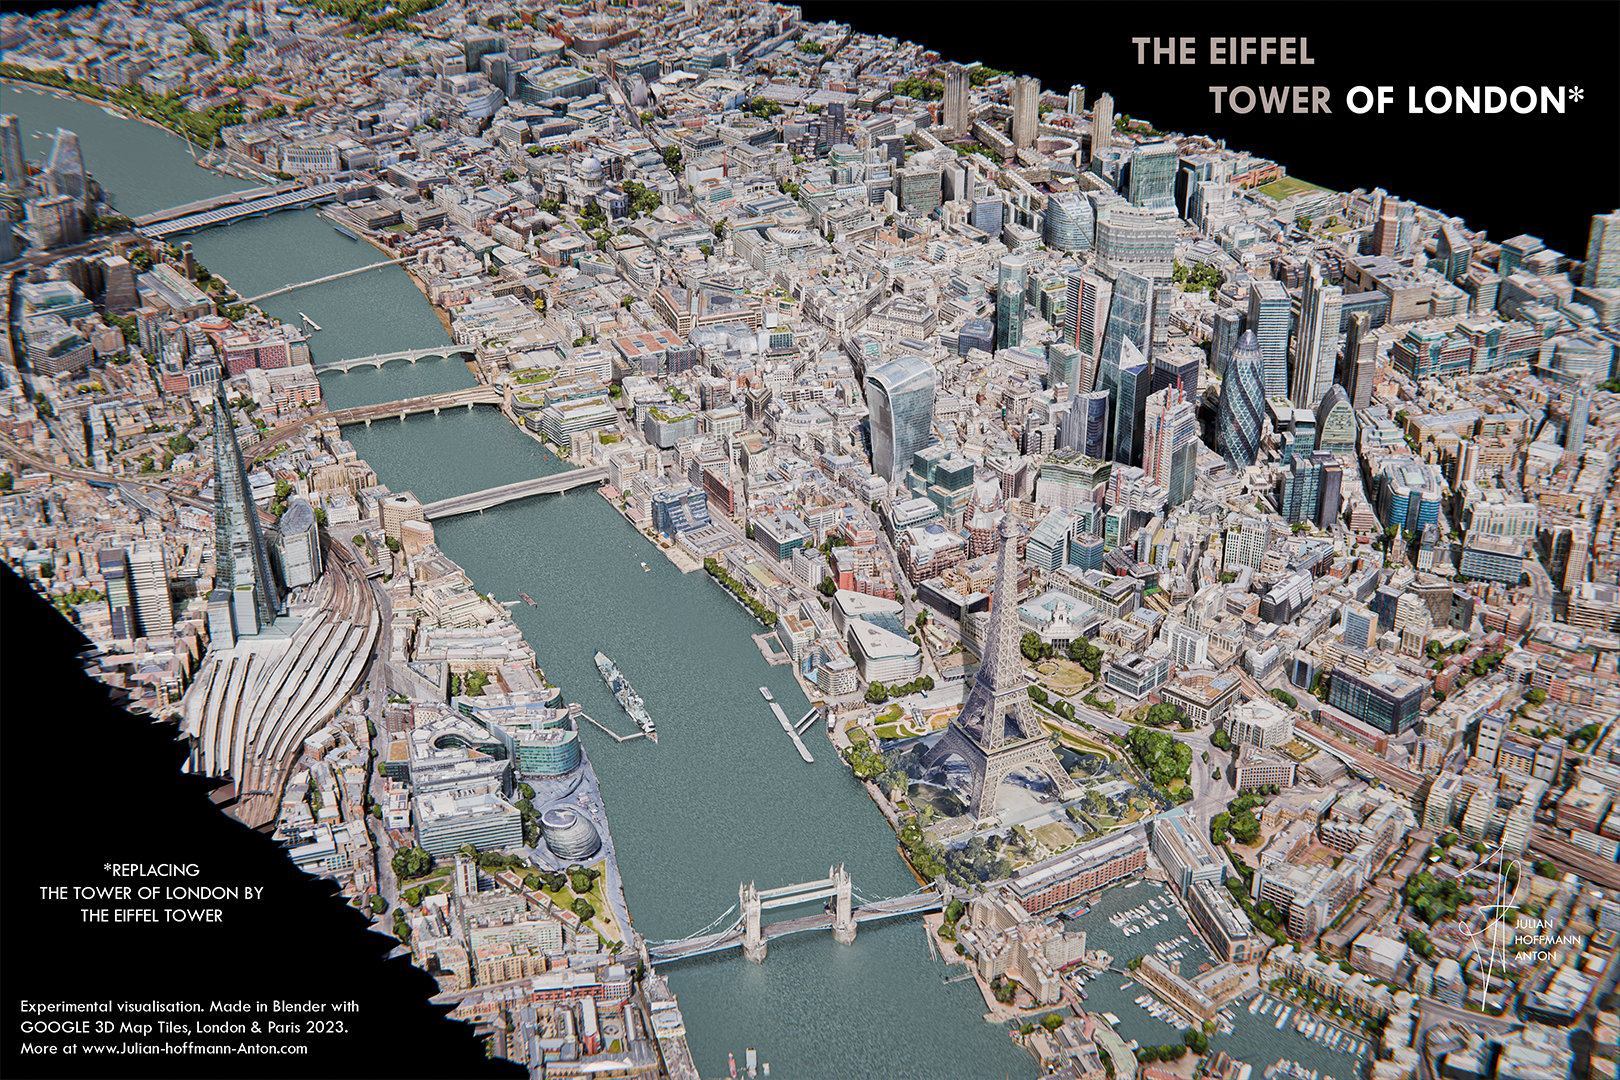
The Eiffel Tower of London
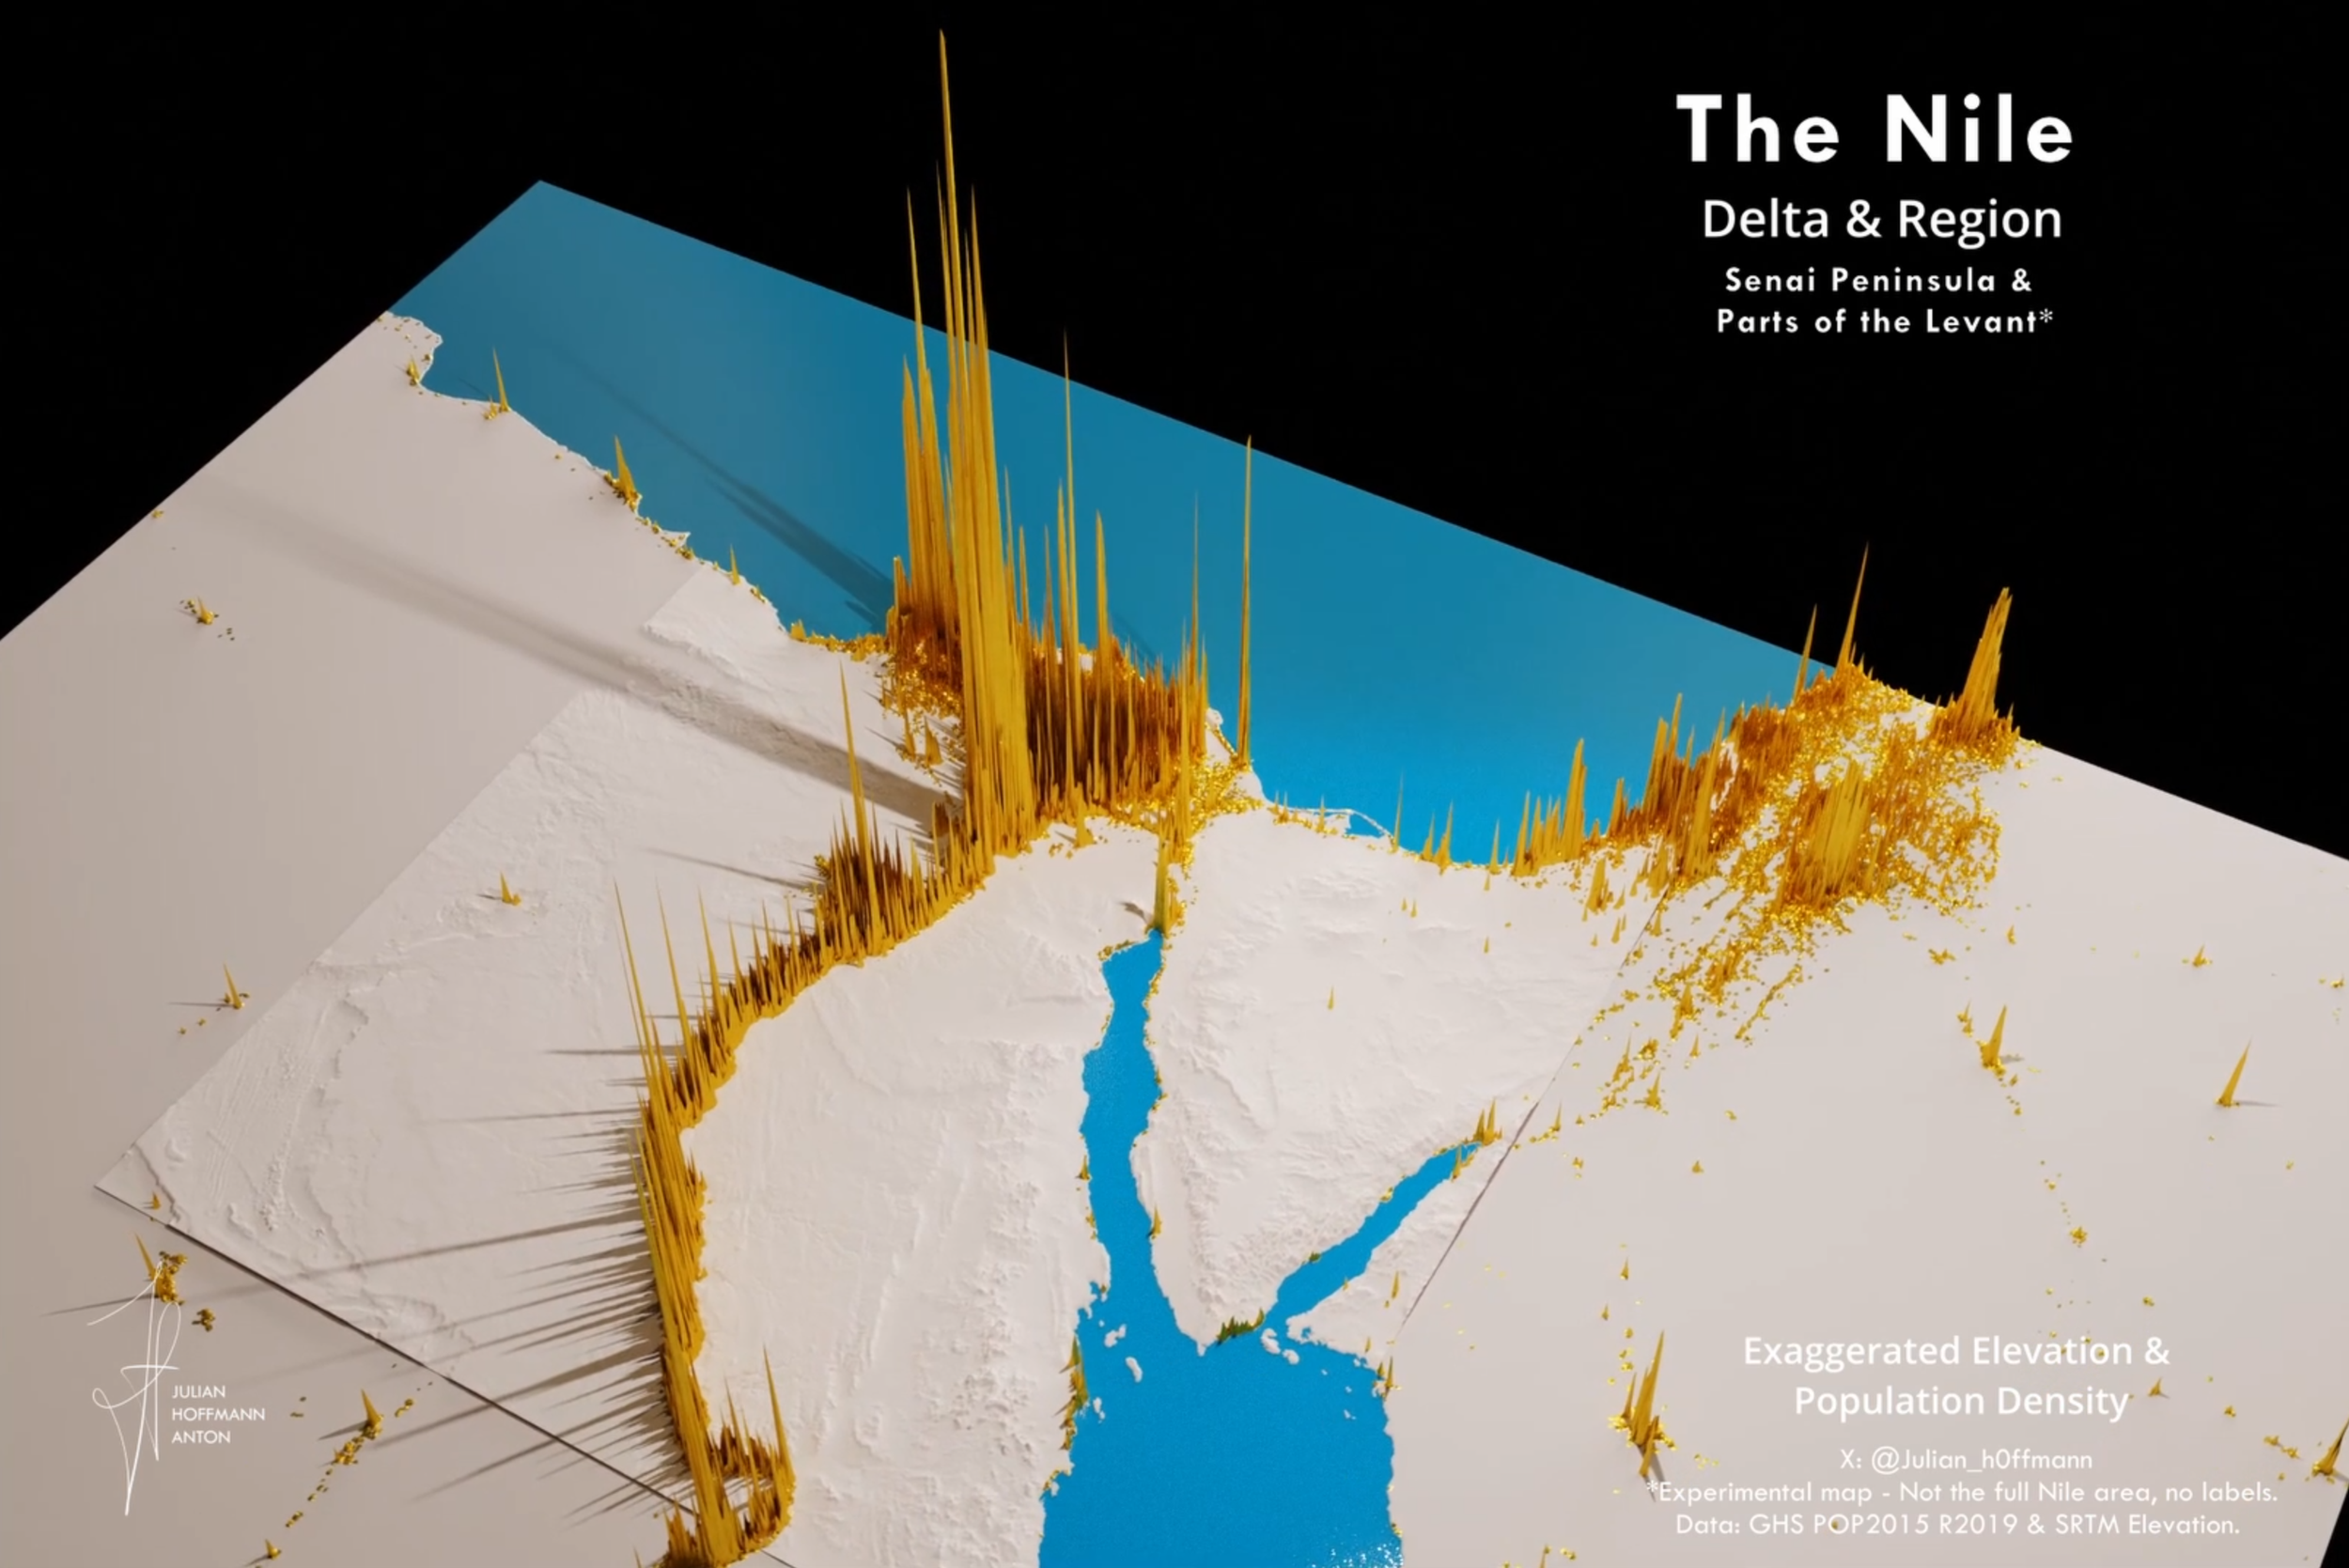
screenshot_nile.png
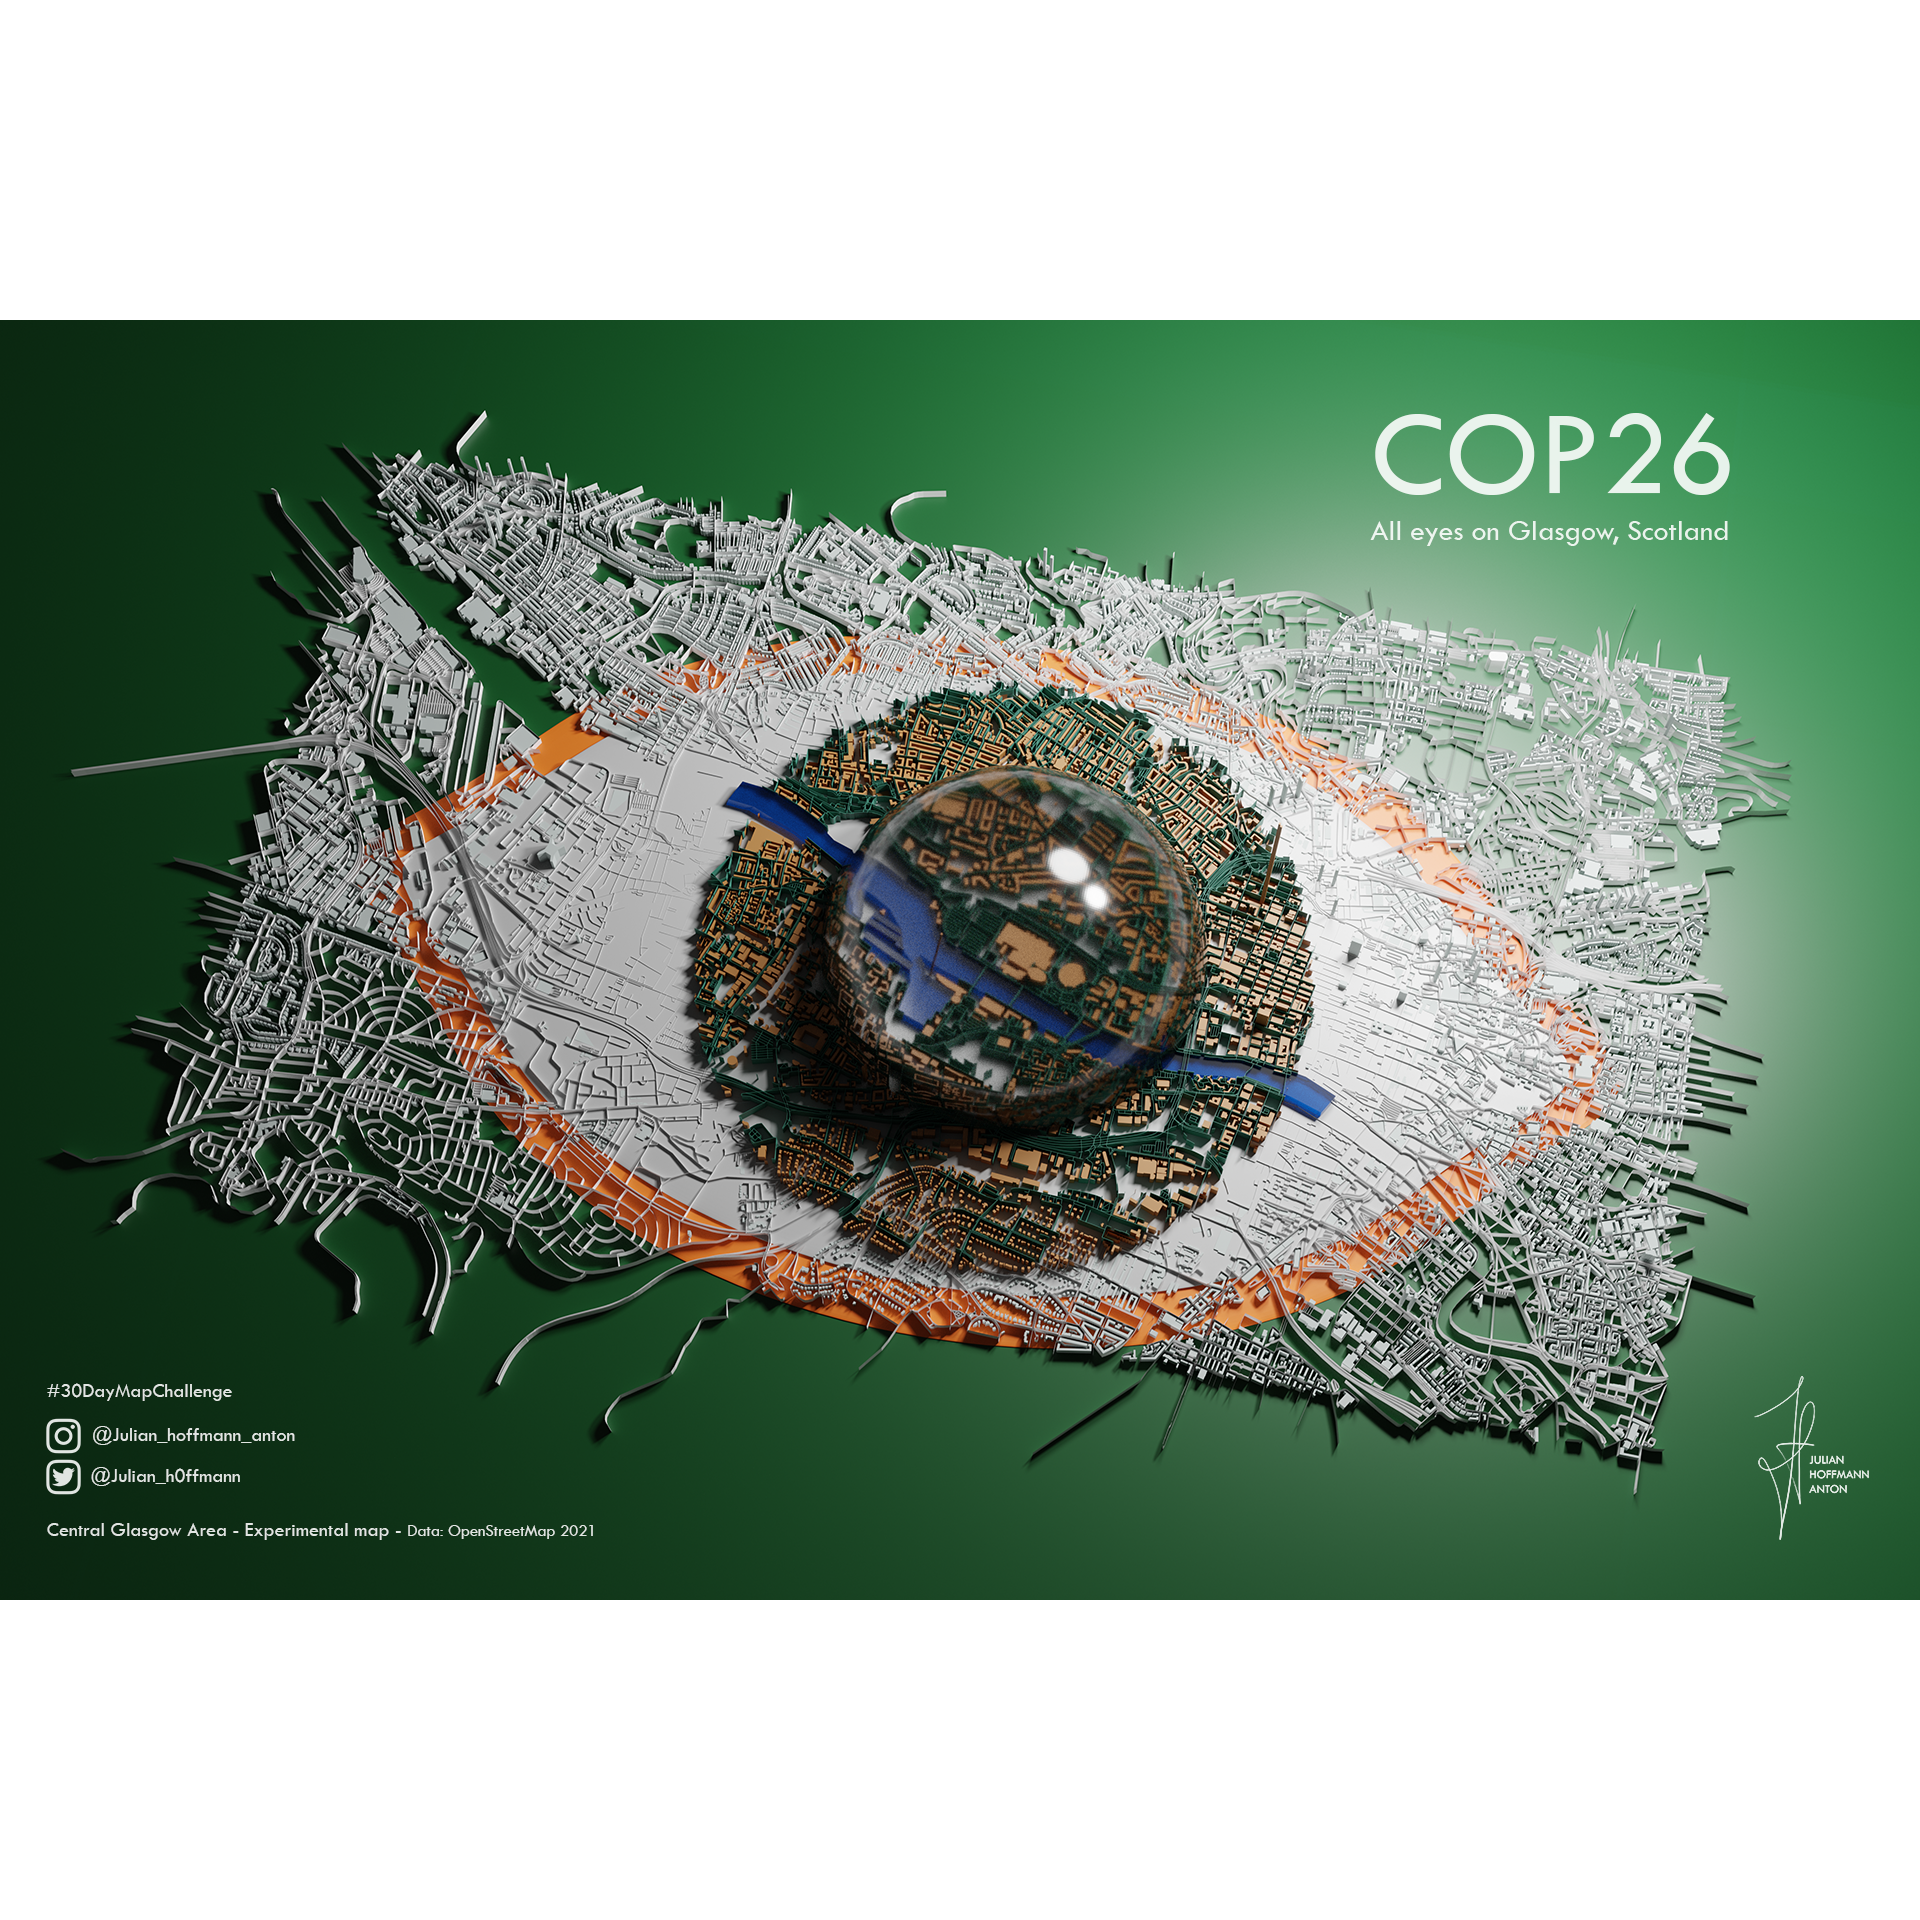
map_day_5_COP26_vJH_HD_CB.png
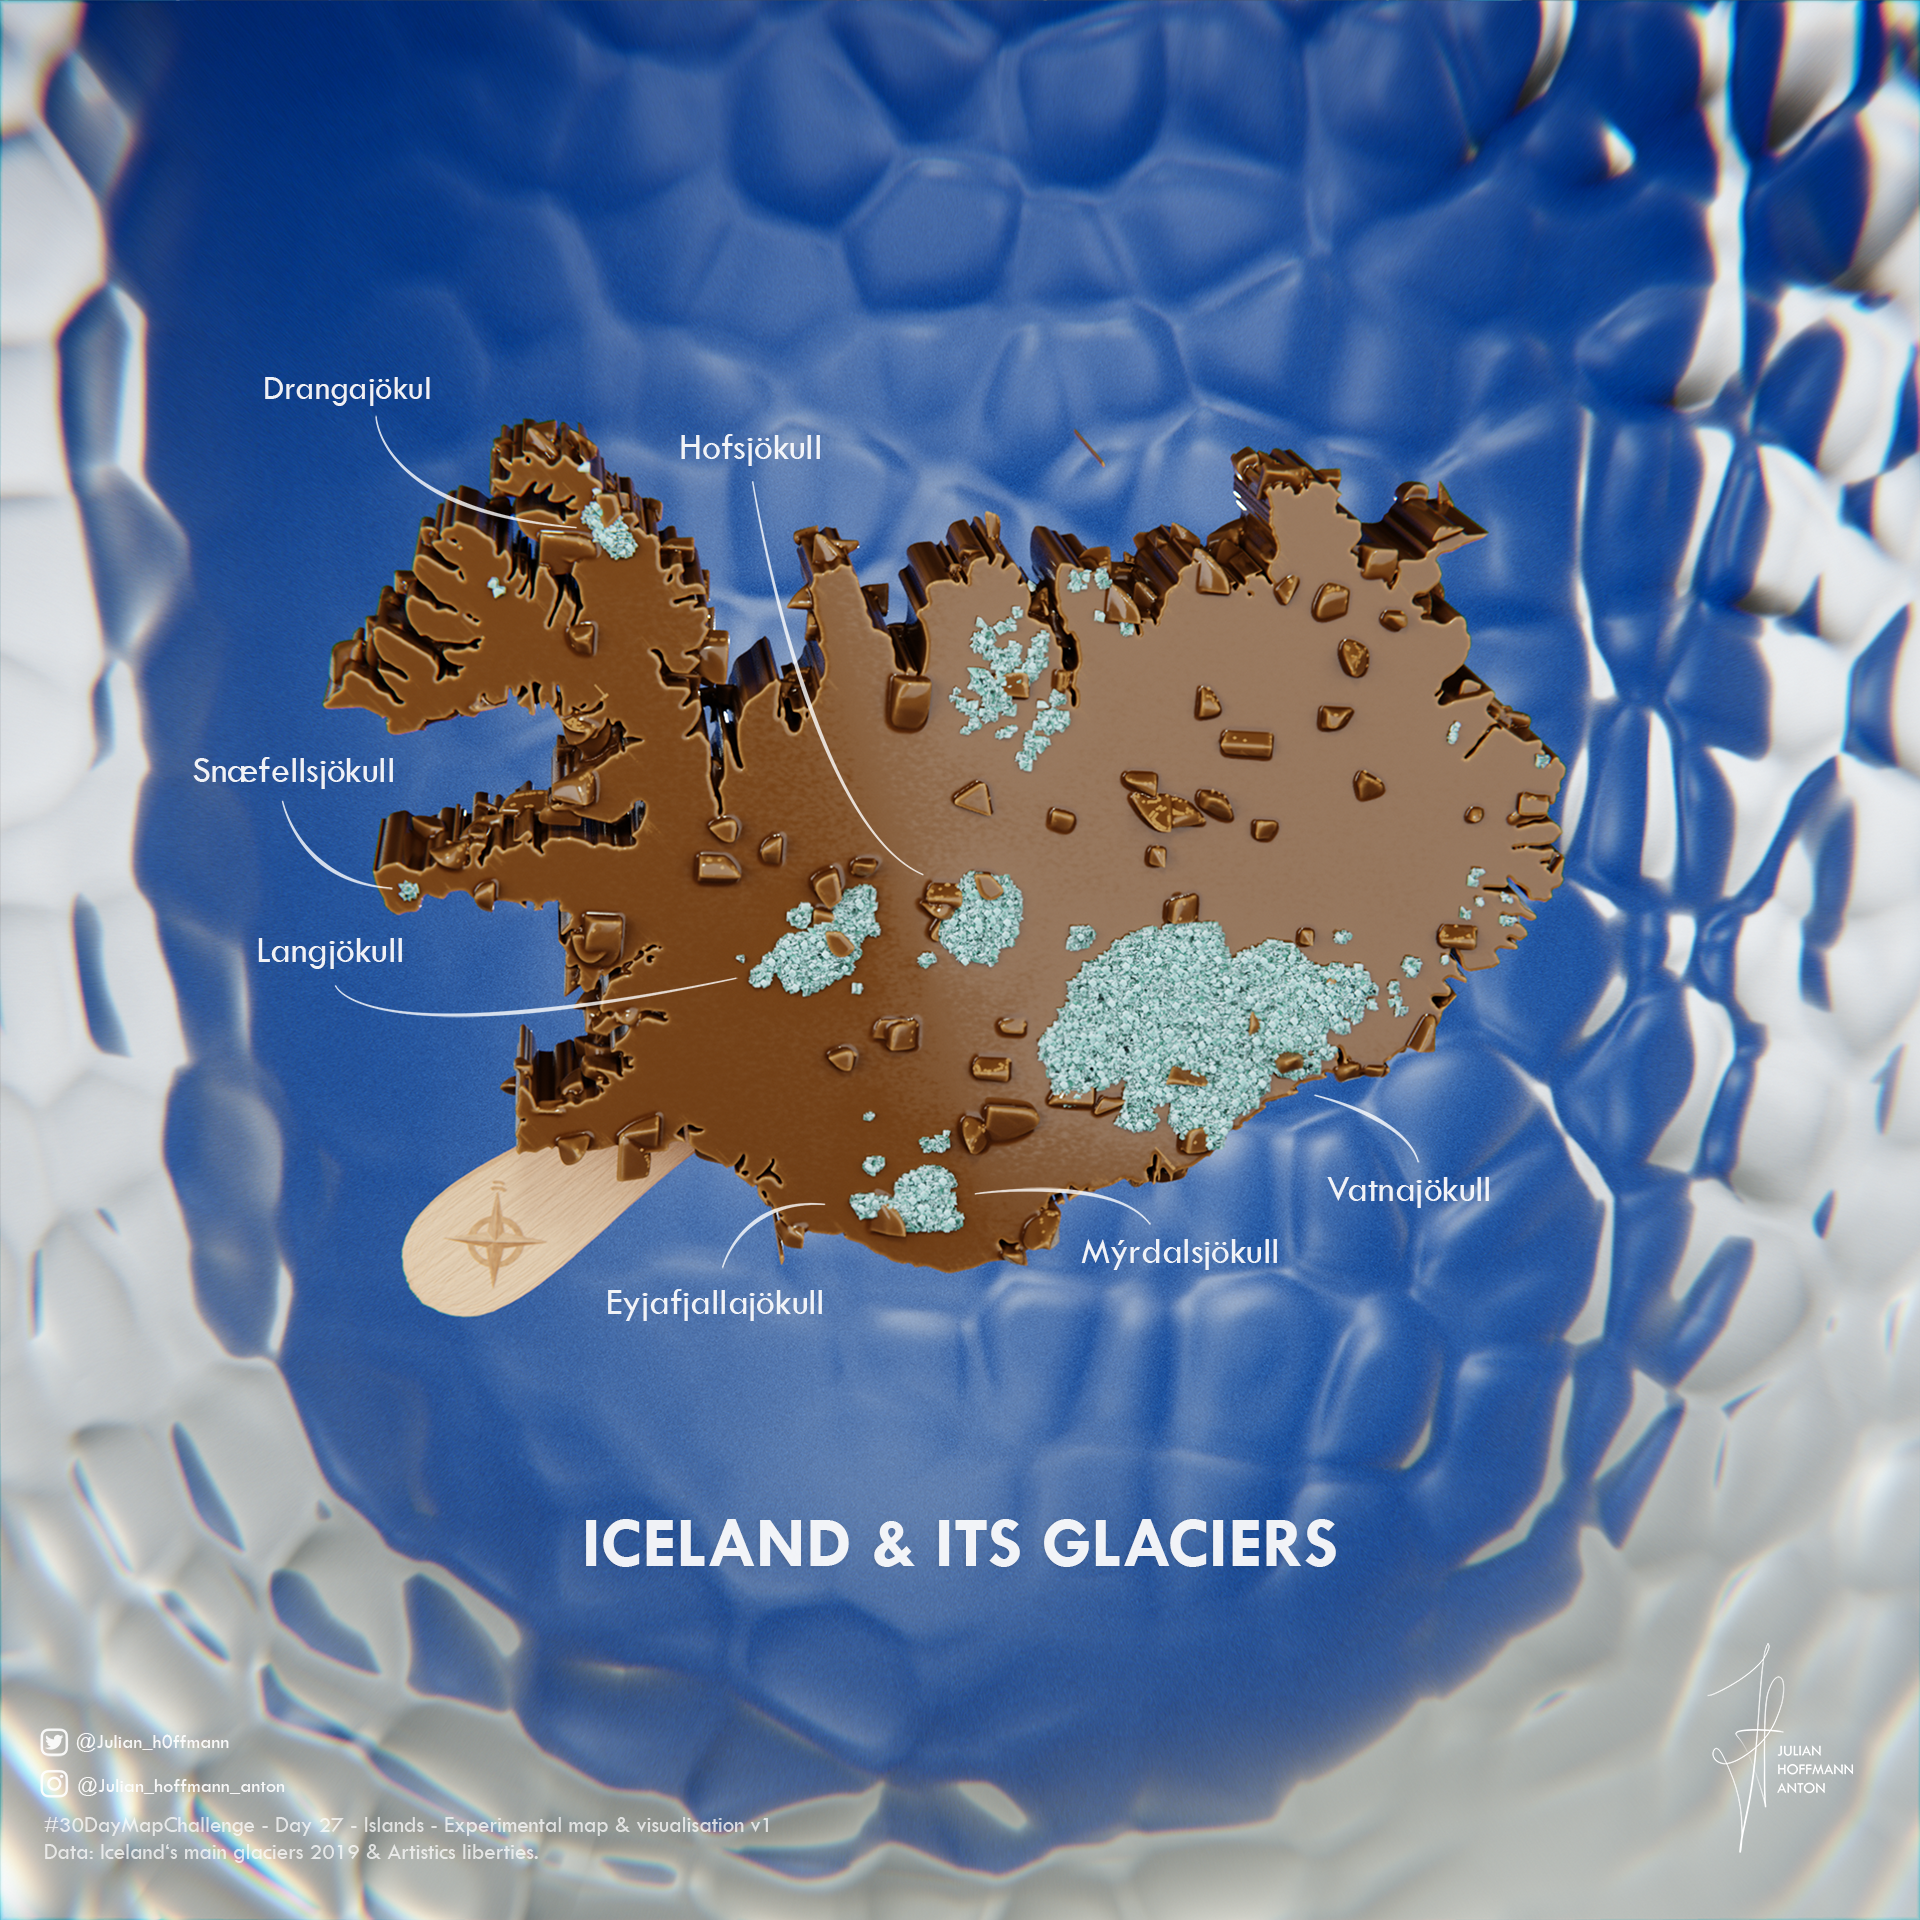
map_iceland_labels_draft_v1twitter.png
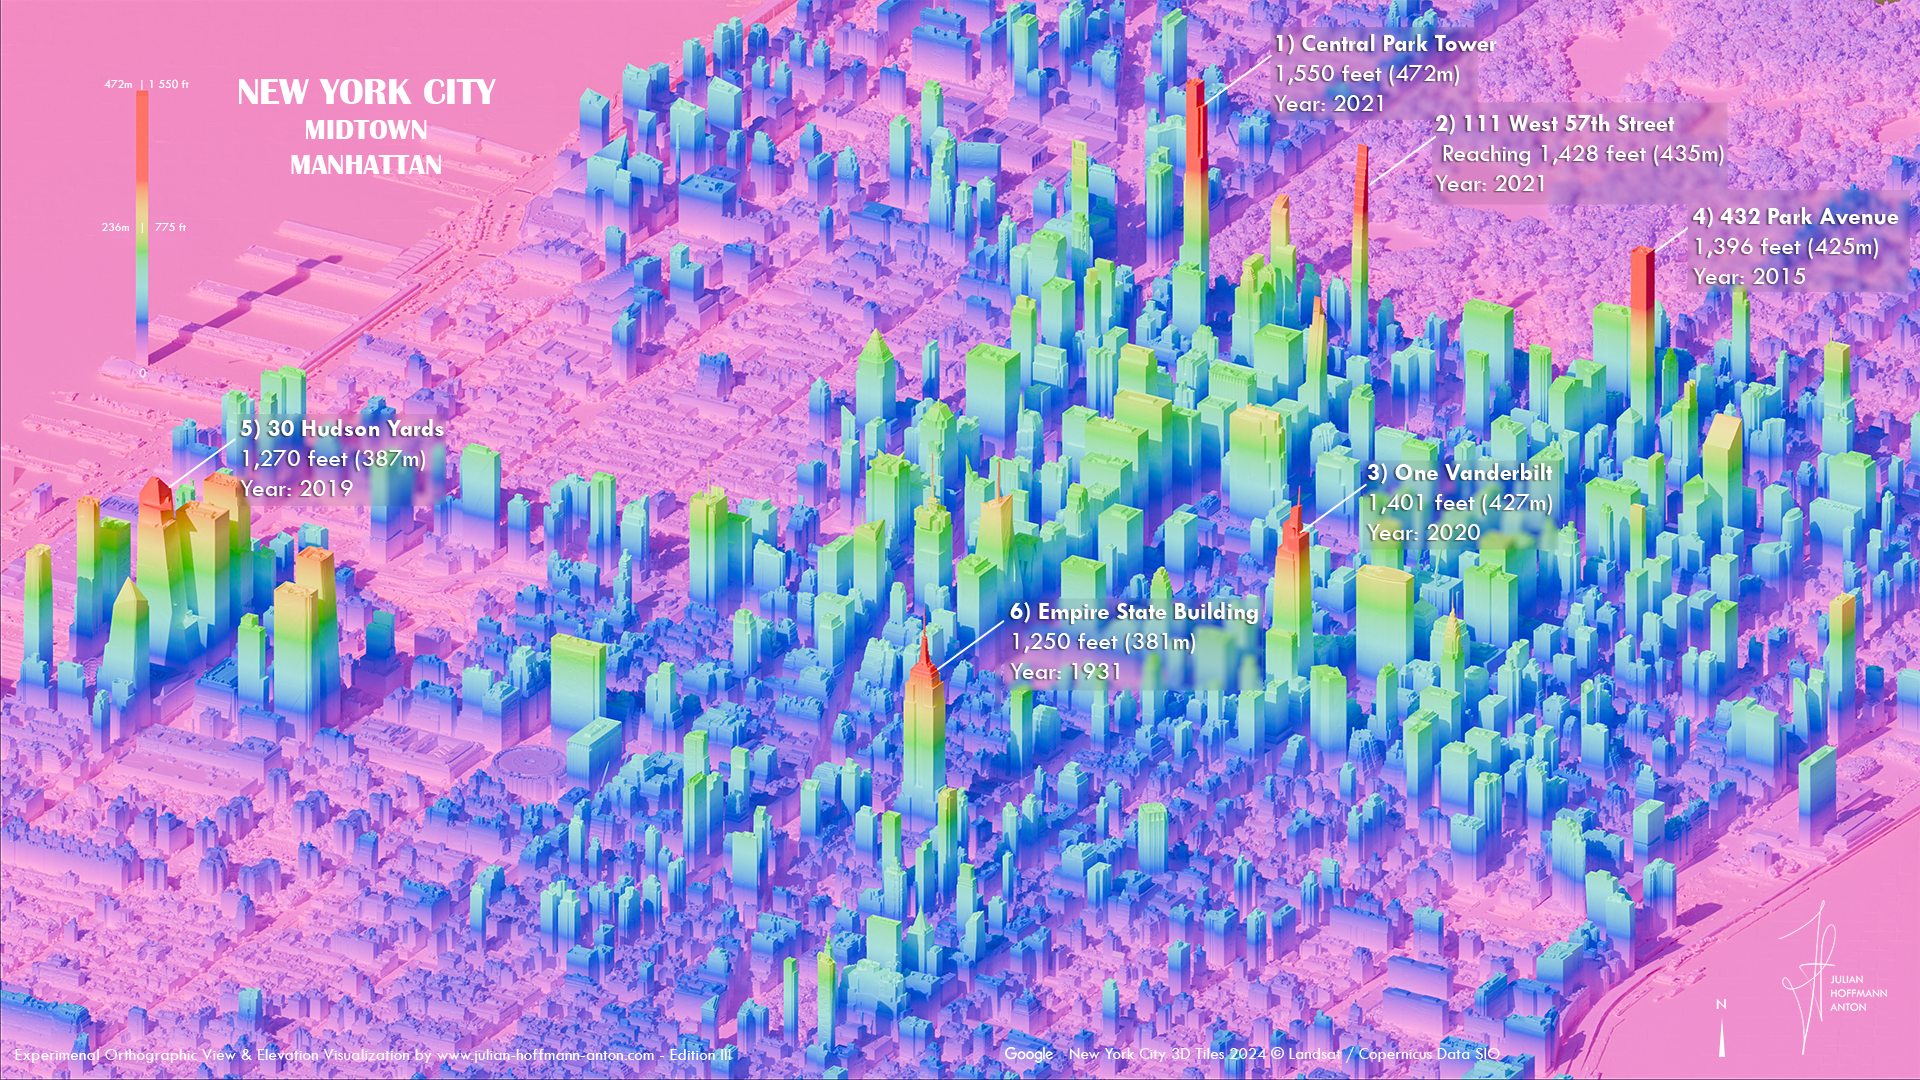
Midtown_v2_edition_III.png
Paris Neon-Expo v1
Paris Neon-Expo v1
Not_a_chart_templatetwitter.png
map_cop27_labelsstatic_1-Julian_Hoffmann.png
Pieces of the USA
Pieces of the USA
globe_base_comparison4b64b6.png
map_red_wine_labelshd_twitter3.png
map_day_24_historical_vJH_queen_queue_v1queen_line_v.png
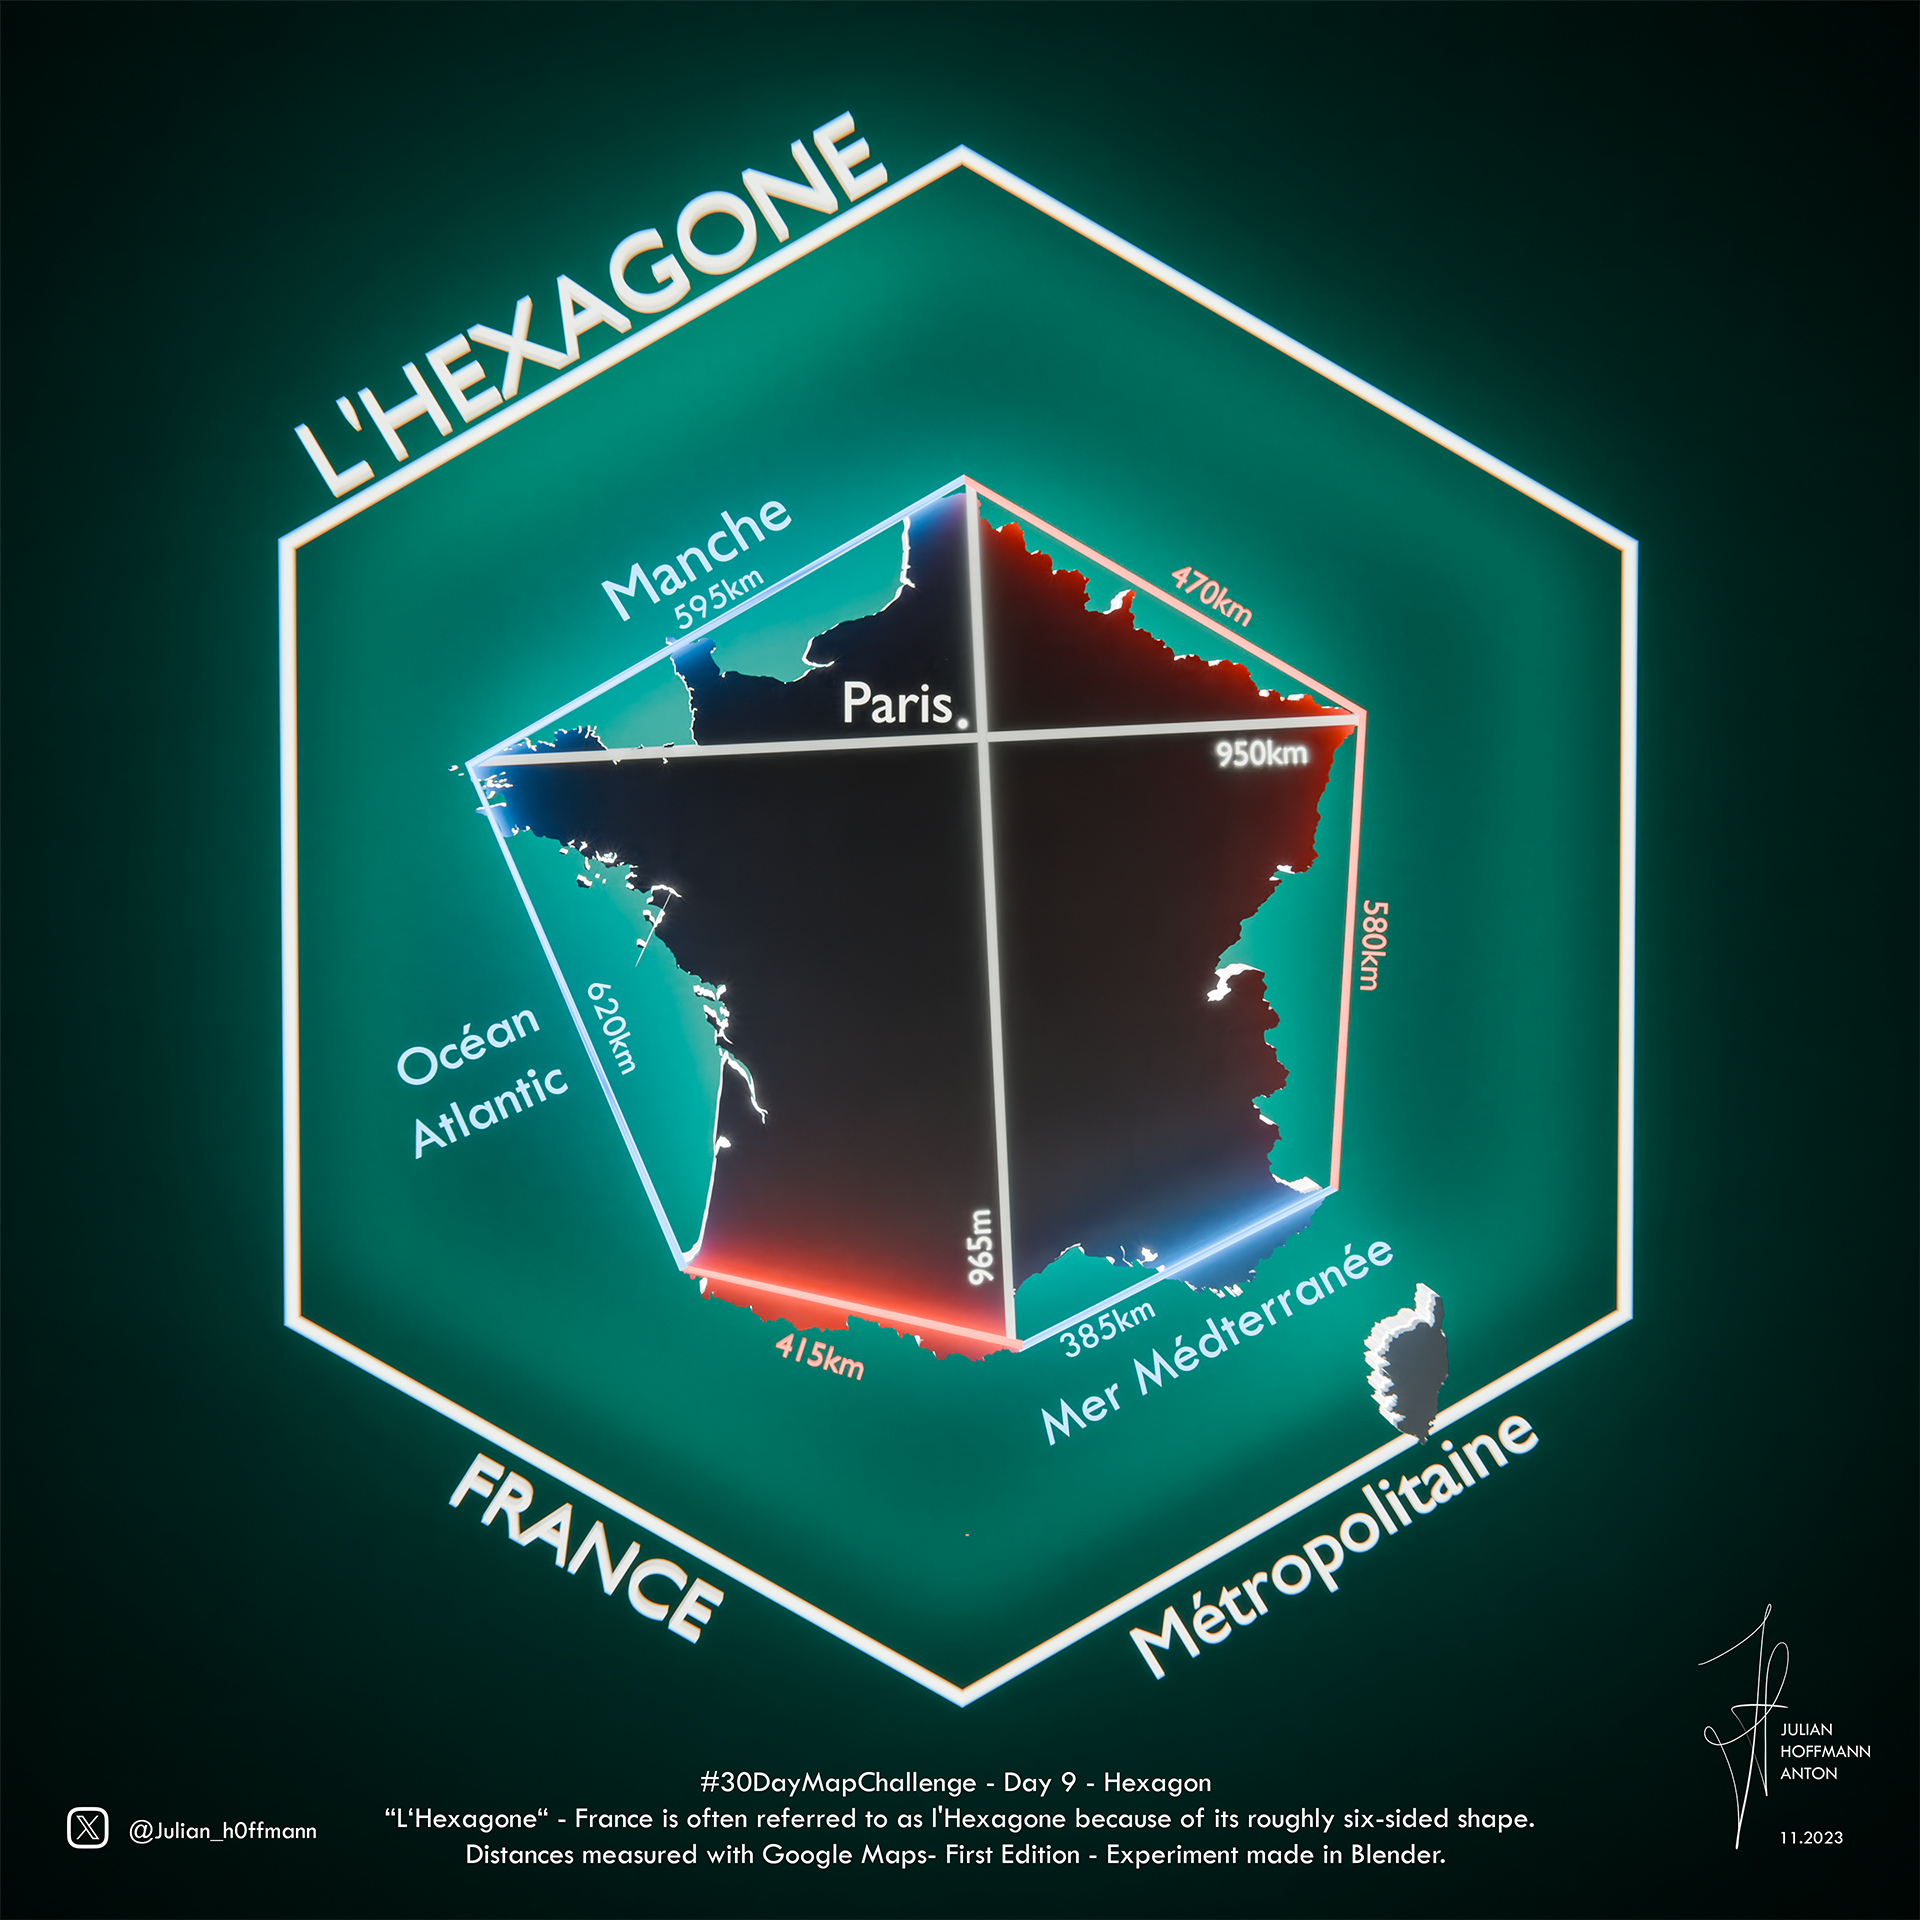
l_hexagone_v3.png
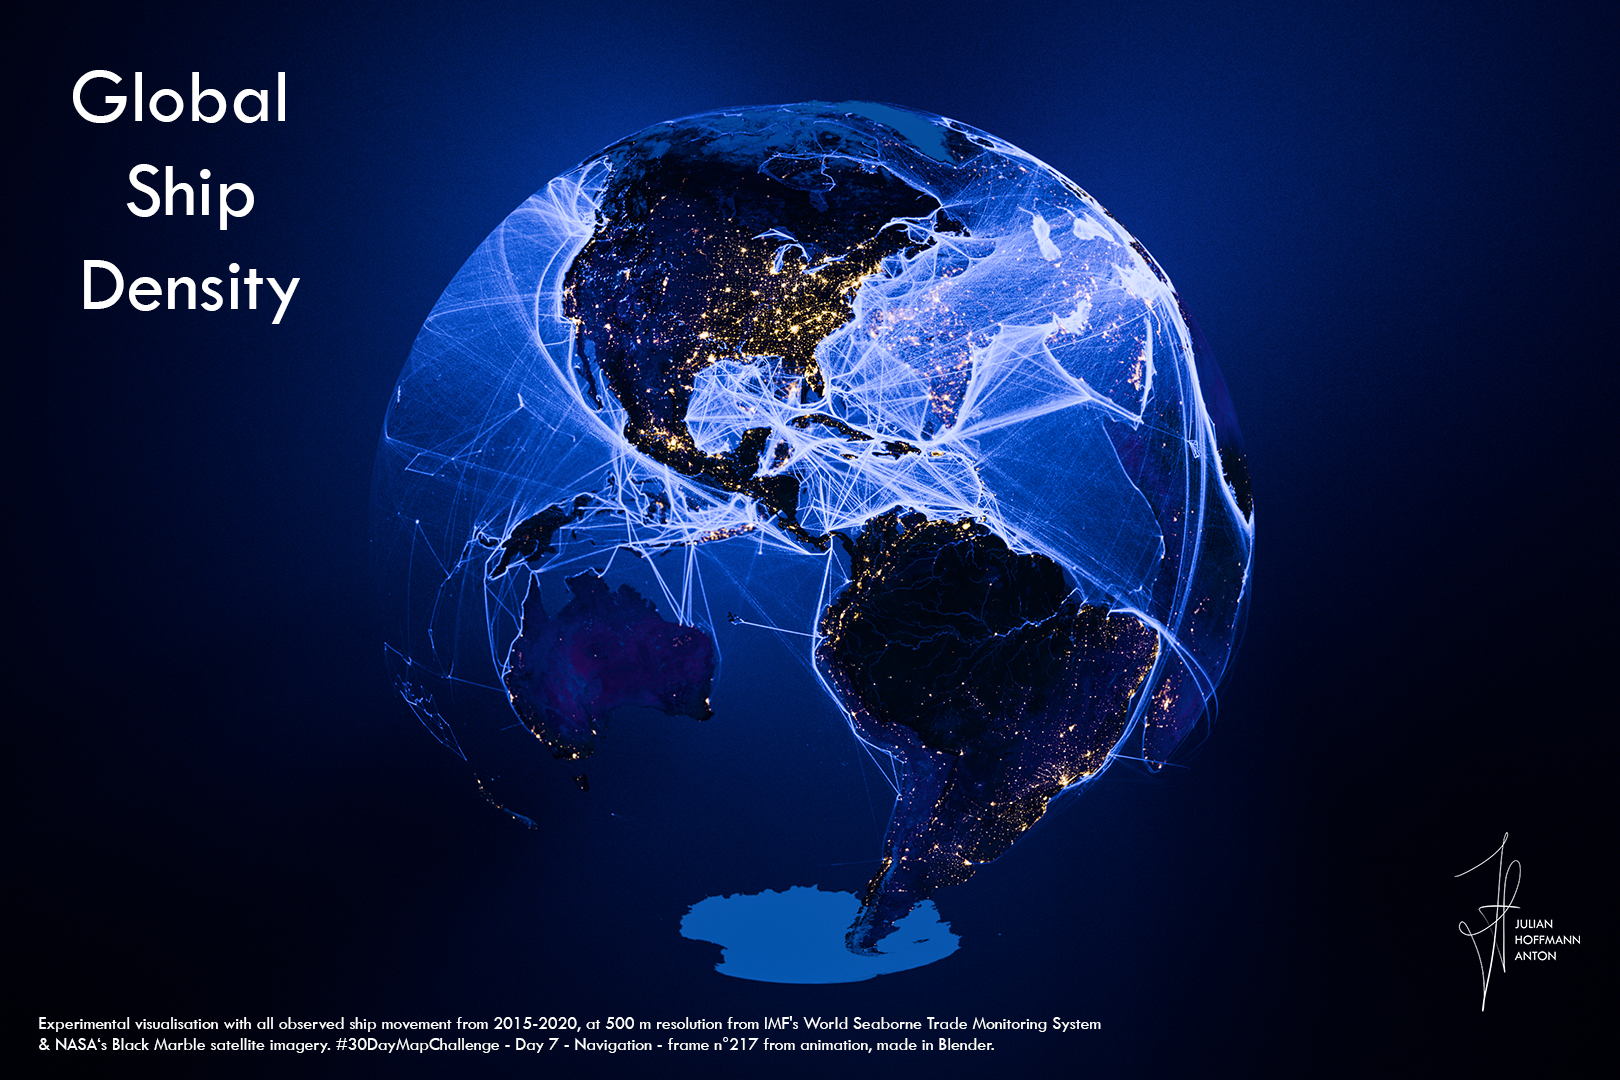
Navigation_v20_217_labels.png
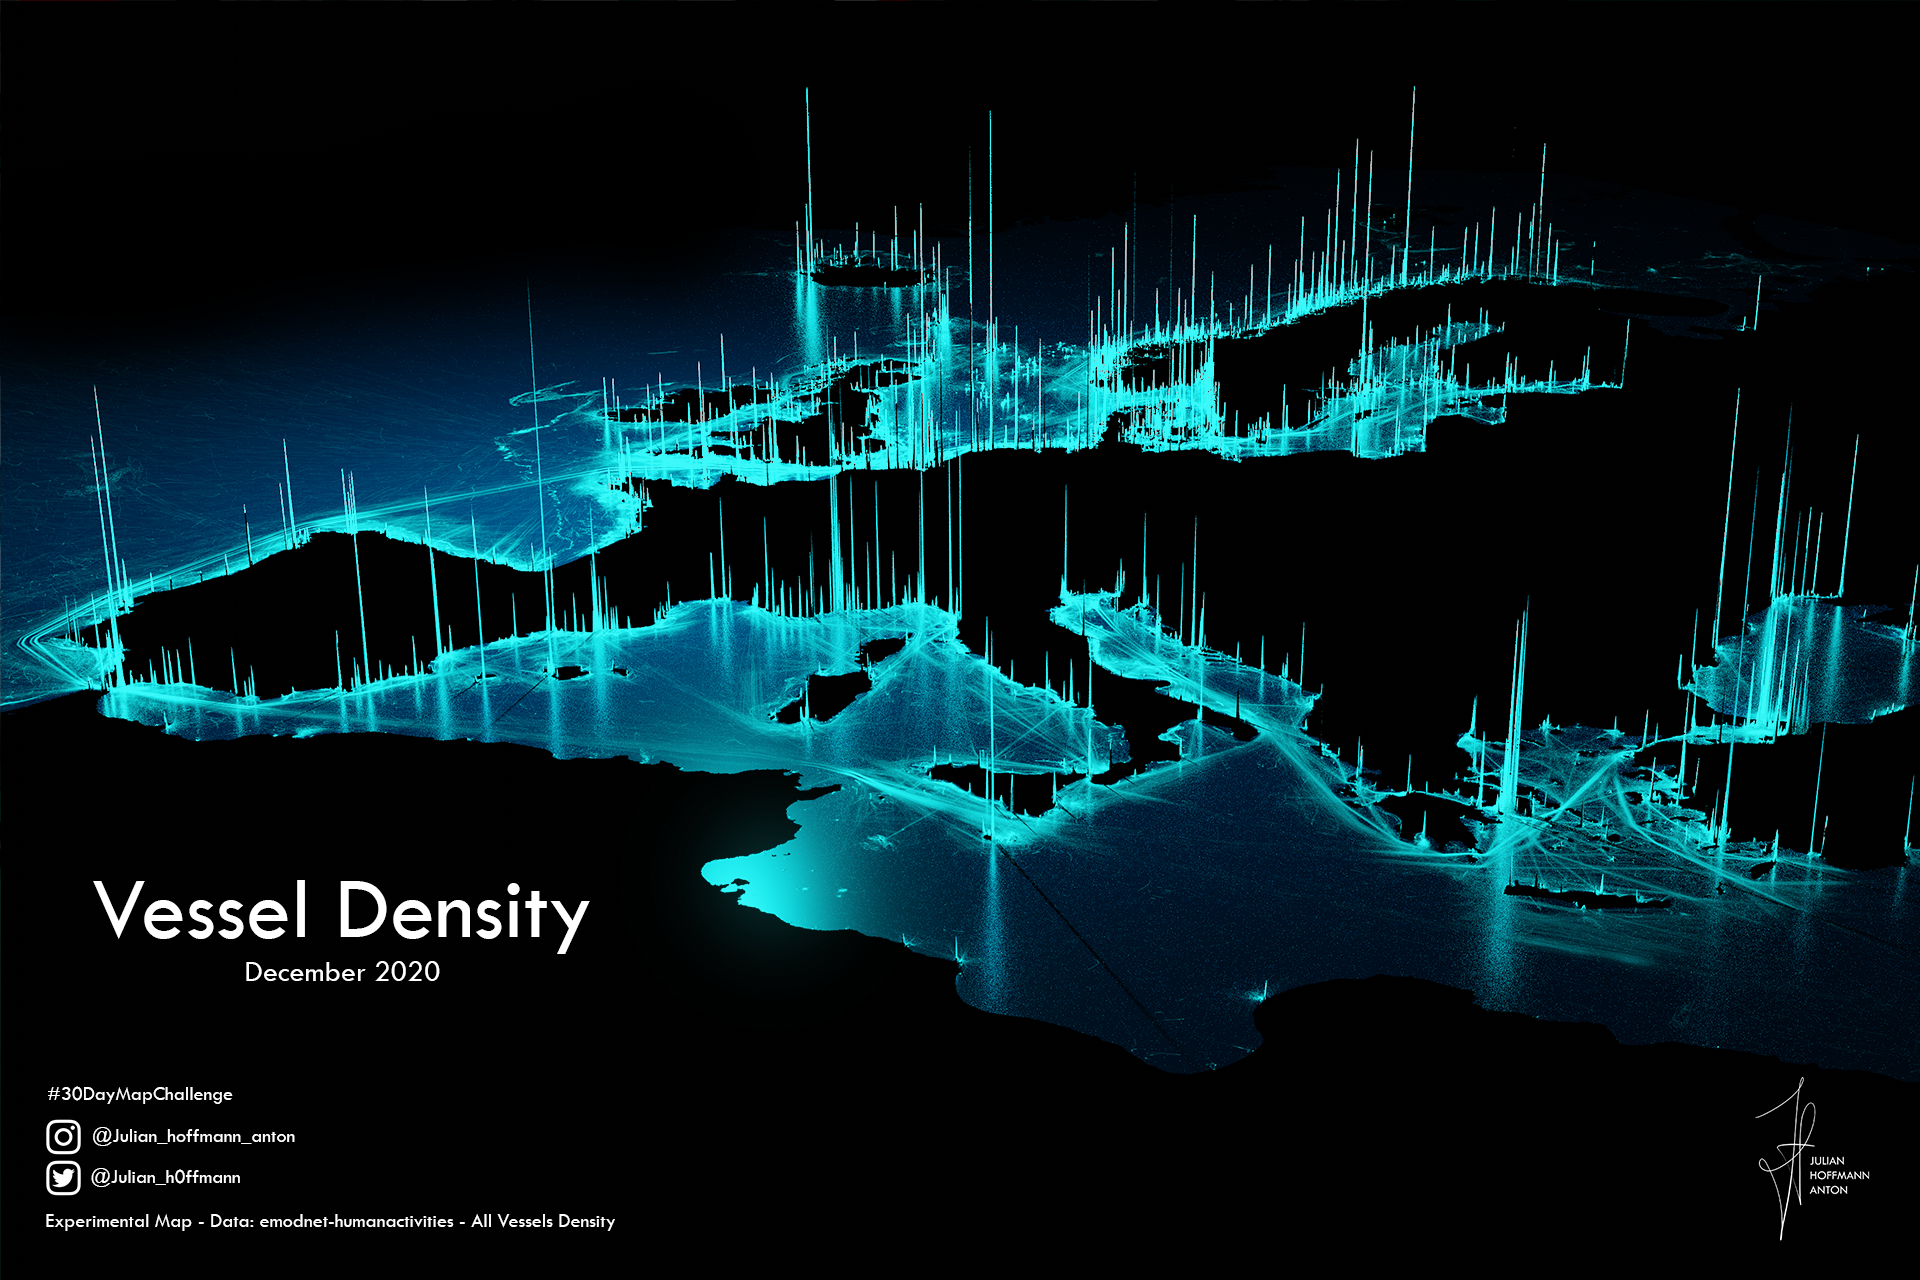
map_day_20_vessels_vJHjh_hd.png
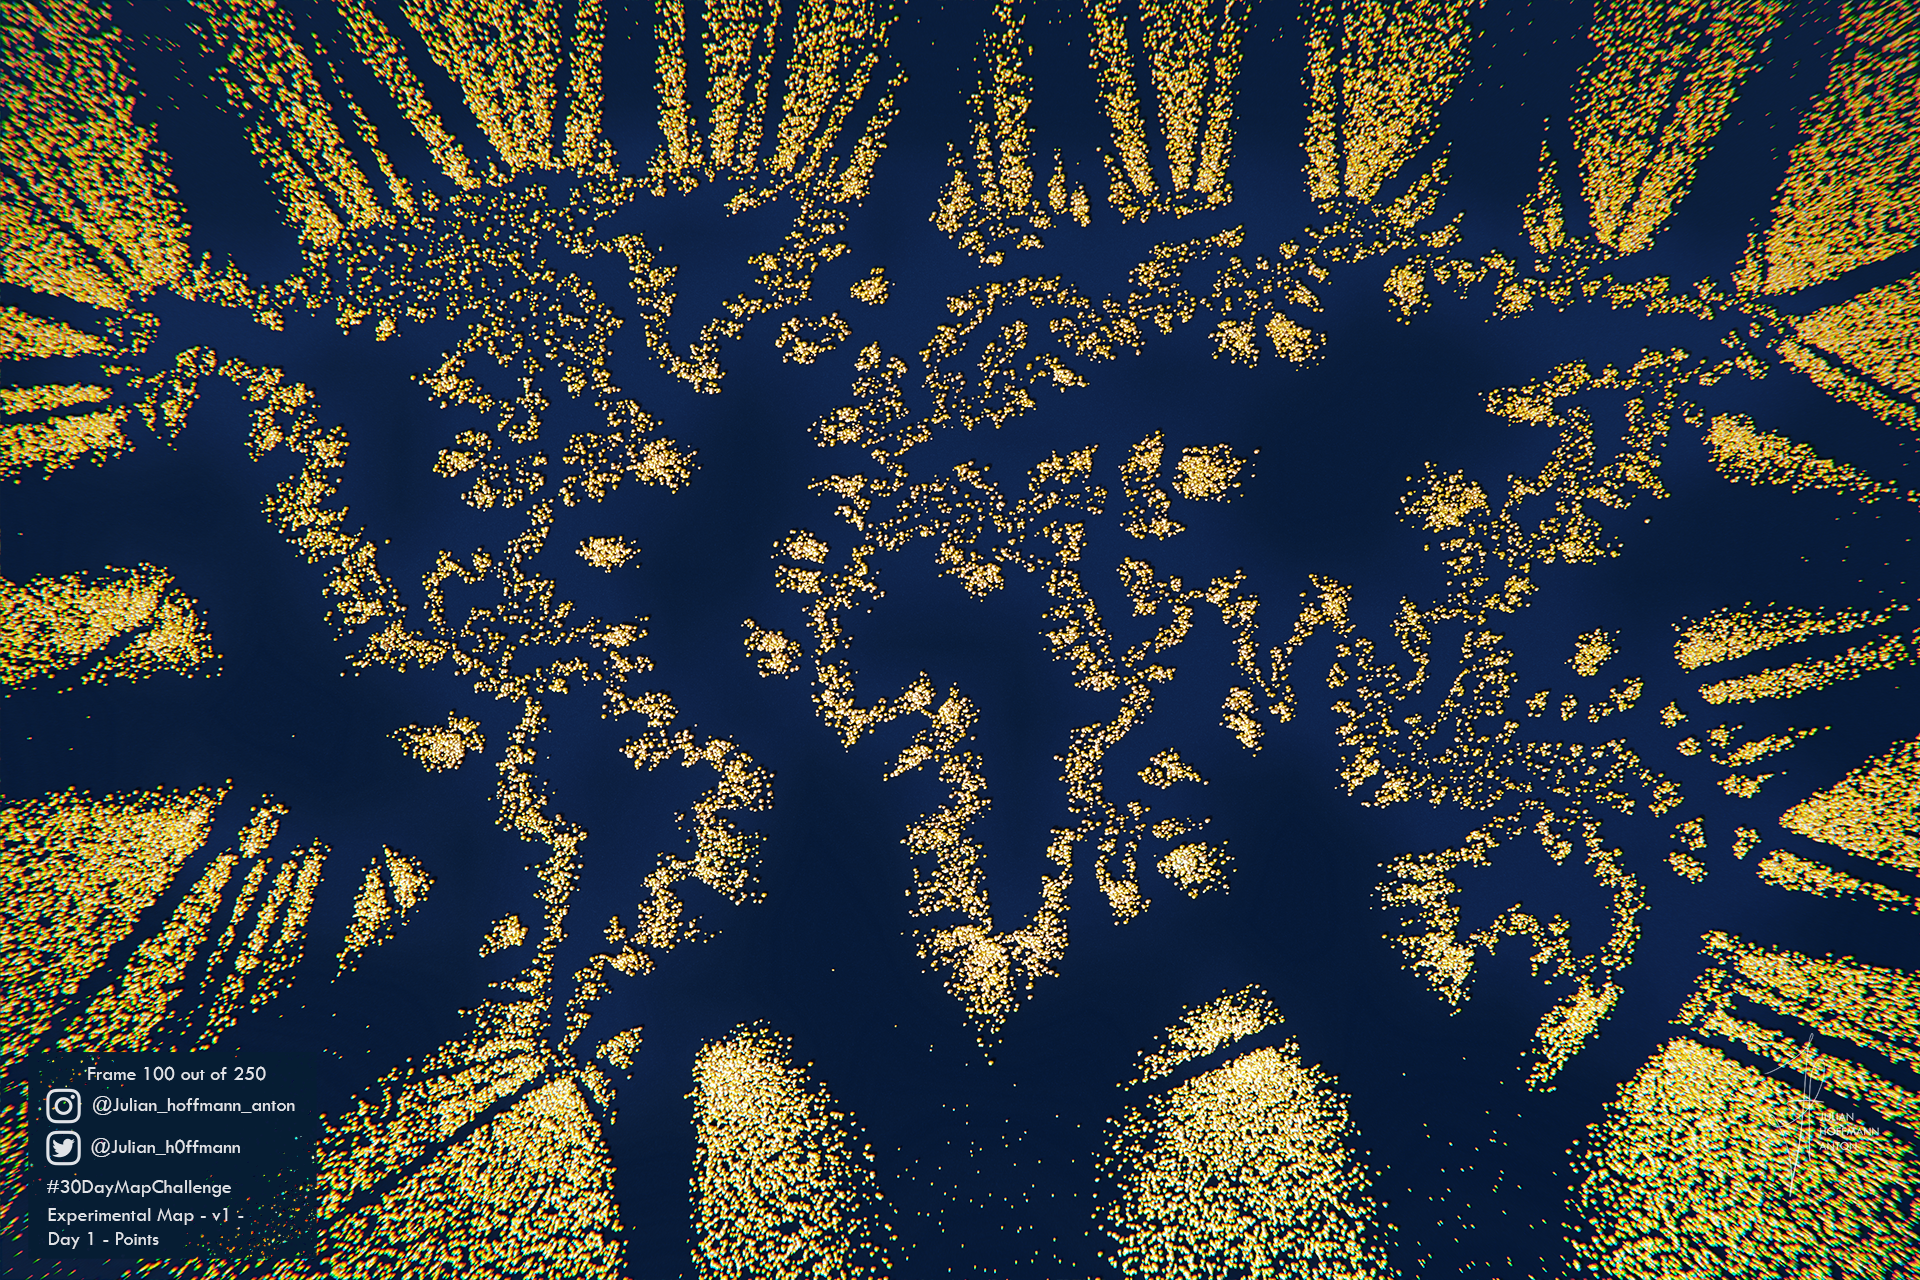
Map_point_world_v8_frame100final_hd.png
Antarctica_vtwitter_1firstfirst.png
map_day_9_BW_Barcelona_vJH__twitter.png
day_12_santiago_1.png
3D London
3D London
Tokyo Lines
Tokyo Lines
map_day_24_historical_vJH_queen_queue_kingv_legend10final_twitte.png
Tokyo Eat Map BTS
Tokyo Eat Map BTS
map_internet_network_template_CBvgeneral.png
map_21_elevation_switzerland_v4b_hs_b3.0_animation_8_4_loop_thumbnail.png
3d raster earth -v3 twitter labelstwitter.png
Polynesian Polygons
Polynesian Polygons
newborn_globe_v24.png
map_day_9_monochrome_vJH__HD_vzoom.png
map_day_6_RED_vJH_HD_CB_corre.png
Chile Pre Fossilisation
map_day_21_Nile_vJH_testjh_hd_v2.png
From points to map
From points to map
Testing Greener Worlds
day_18_Atmospheretwitter.png
newborn_globe_v26_linkedin.jpg
Tokyo Lines (BTS)
Tokyo Lines (BTS)
map_blue_labelshd_twitter3b.png
map_day_21_elevation_vJHjh_hd.png
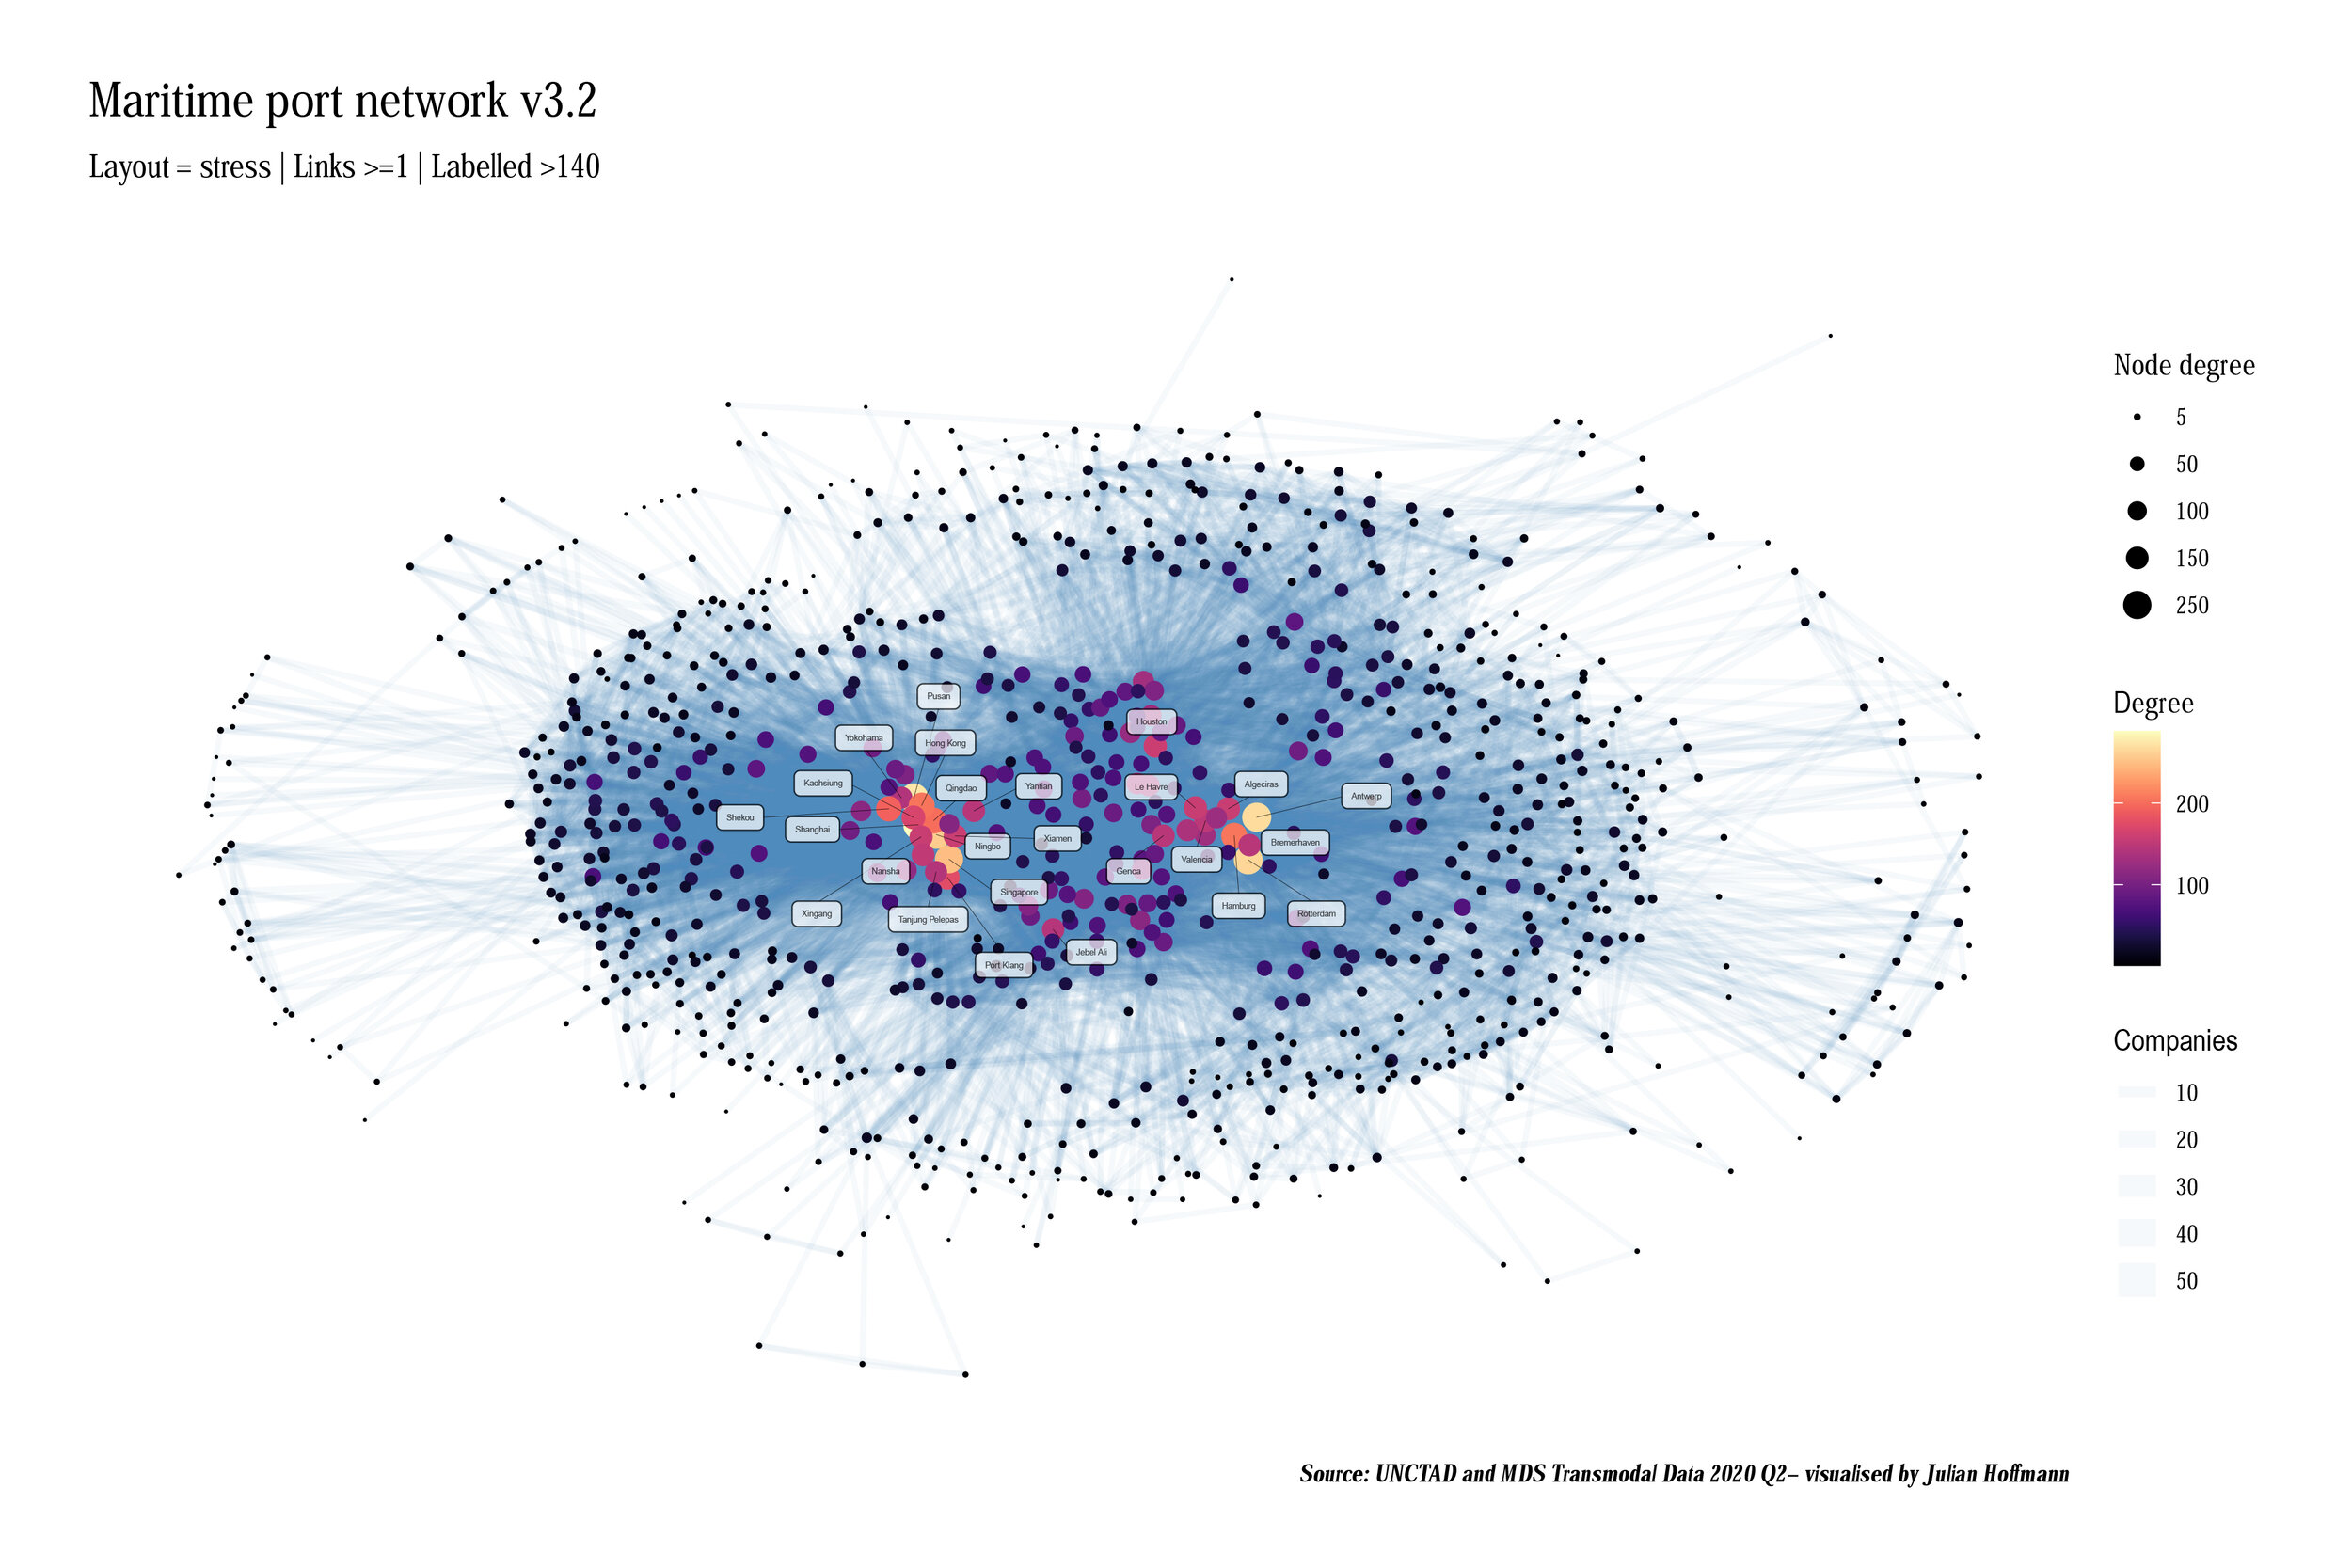
Ports in the global liner shipping network
Café à Paris
Café à Paris
world_grid_v2_1920_twitter.png
map_day_20_vessels_vJHjh_hd_vc.png
map_day_16_urban_vs_rural_mv6_jh.png
Raster Earth
Raster Earth
Behind the Scenes
Behind the Scenes
Containership port calls during the first 31 weeks of 2020 compared to the same period in 2019
Urban World
Urban World
Spatial Dish I.
Spatial Dish I.
map_day_3_polygons_99_cities_vJH_HD_fin_side_CB.png
Promo_fluffy_v1_africa_f260_previewdetail.png
first_london_render38_zoom_A_bis_insta_CB.png
Connected Countries in MENA
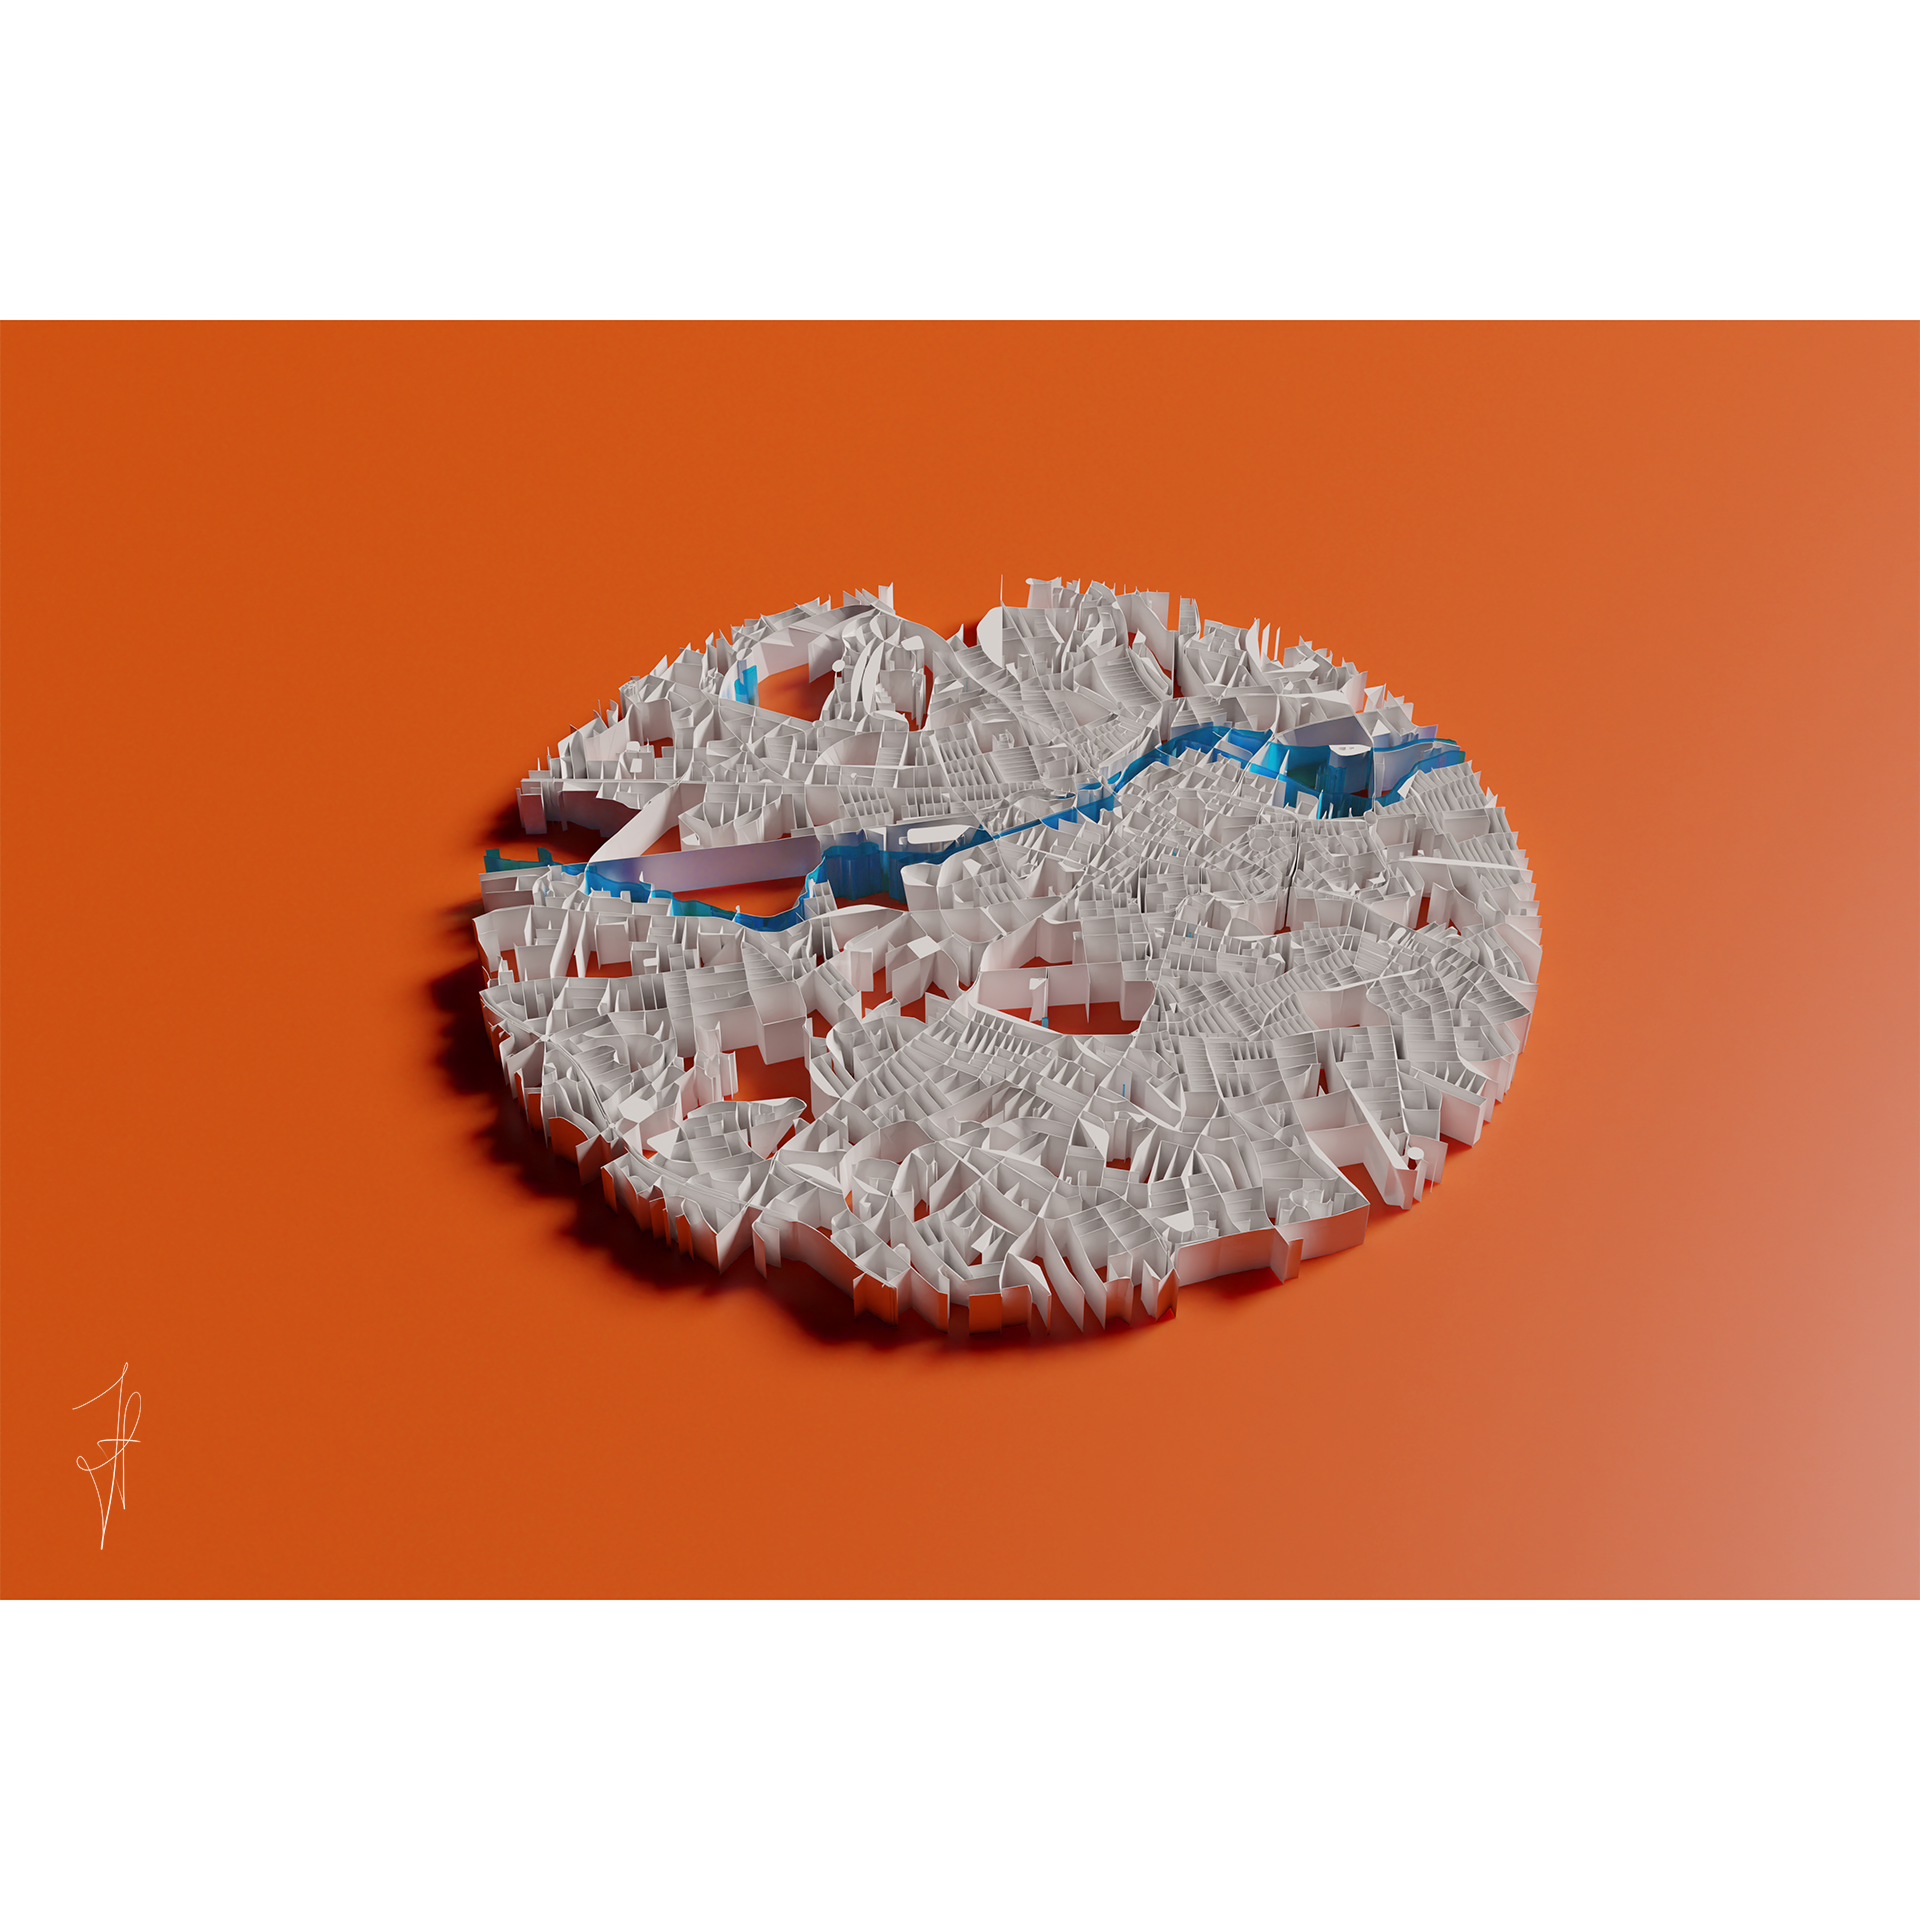
London: Spinning my Labytinth I.
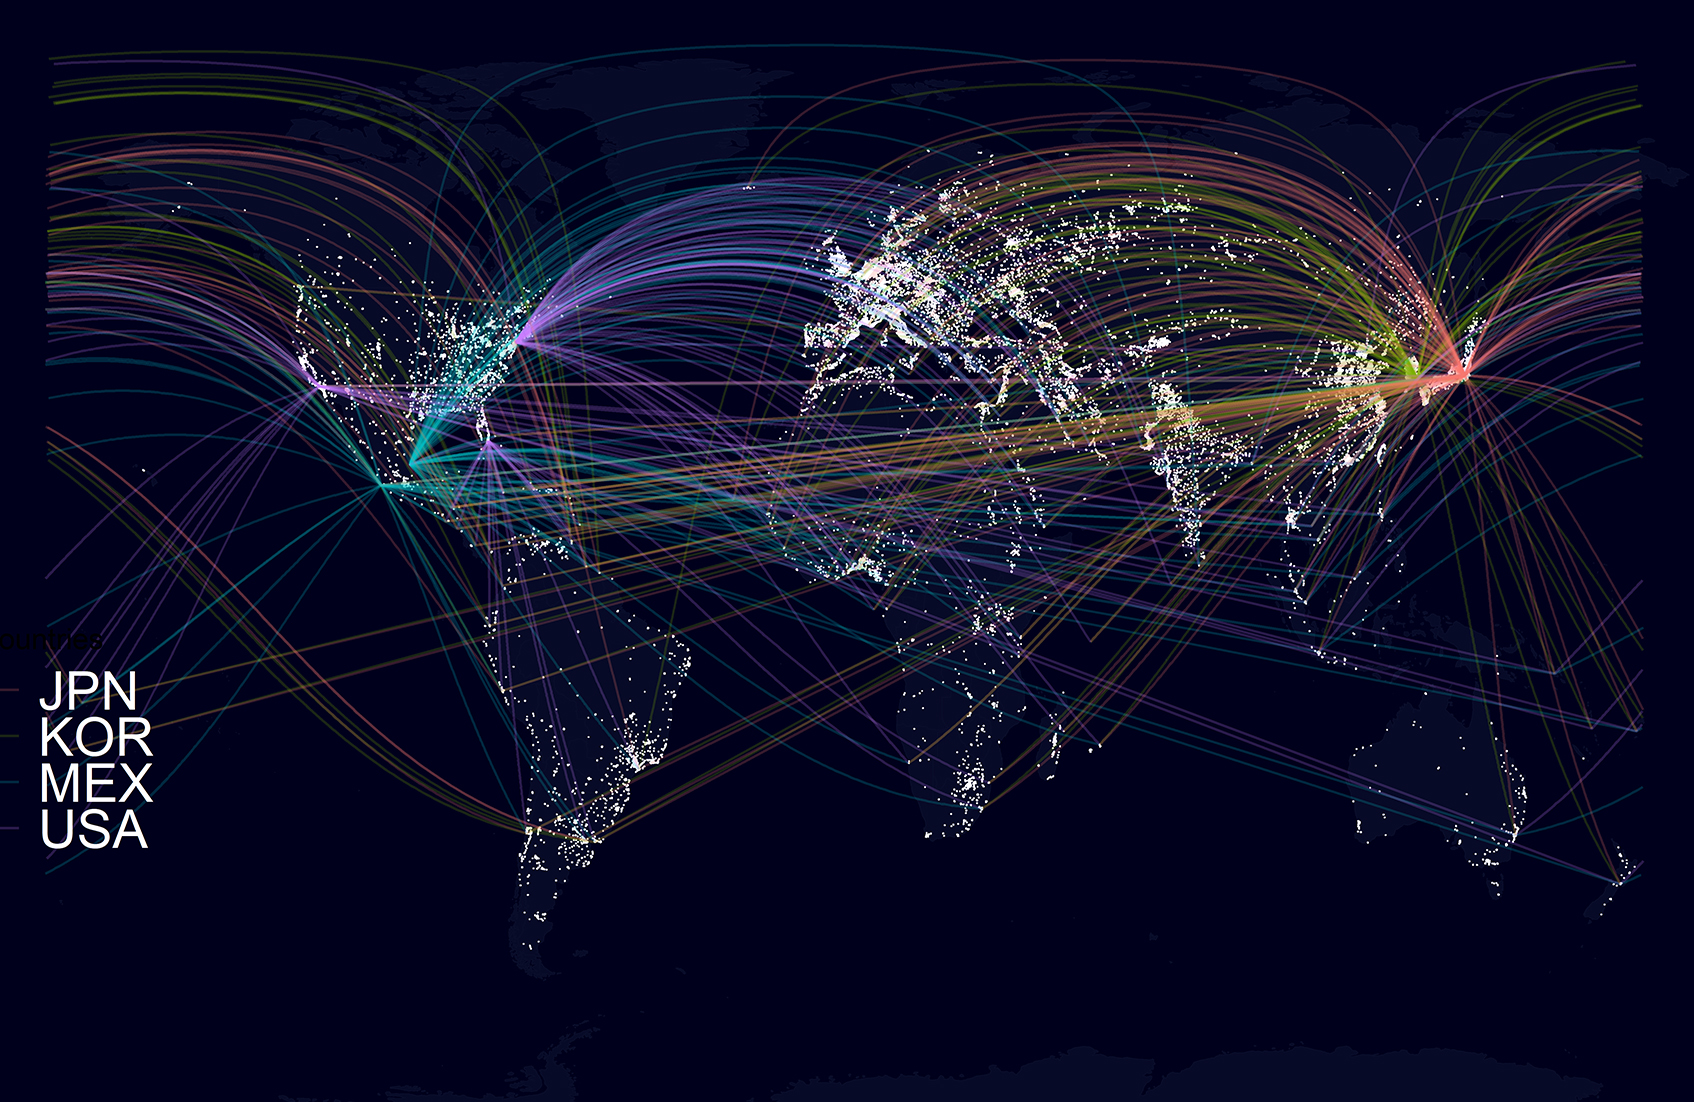
Top Import-Origin
Top Import-Origin
map_ukraine_labelsUkraine hd.png
Connected Ports & Oceans
Mont Blanc
Mont Blanc
Top Export-Destinations
Map: Size (TEU) of the largest container ship deployed
Spatial Memories I.
Spatial Memories I.
One Year Journey
One Year Journey
Manufactured Goods II
map_draft_world_findex_banked_15plus_lab_v2.jpg
Life is a maze
Life is a maze
Africa Dimensions
Africa Dimensions
map_day_14_new_york_vJHjhCB.png
Cartogram Ship Arrivals and Days
Bivariate Maps
Bivariate Maps
maritime_network_JH_v2_20_07_07_22_02.jpg
Manufactured Goods I
Public Transport Stop Density
pj_16_london_the_place_to_be_vFinal9Insta_blue.png
Mont Blanc - Top View
World map features A and B
World Population
World Population
proj_17_urbox_v3bInsta_blueCB.png
Transport Weak Spot Estimator
day_6_map_greener_Berliner_vJH_HD_twitter2.png
first_london_render38_zoom_C_bis_insta_CB.png
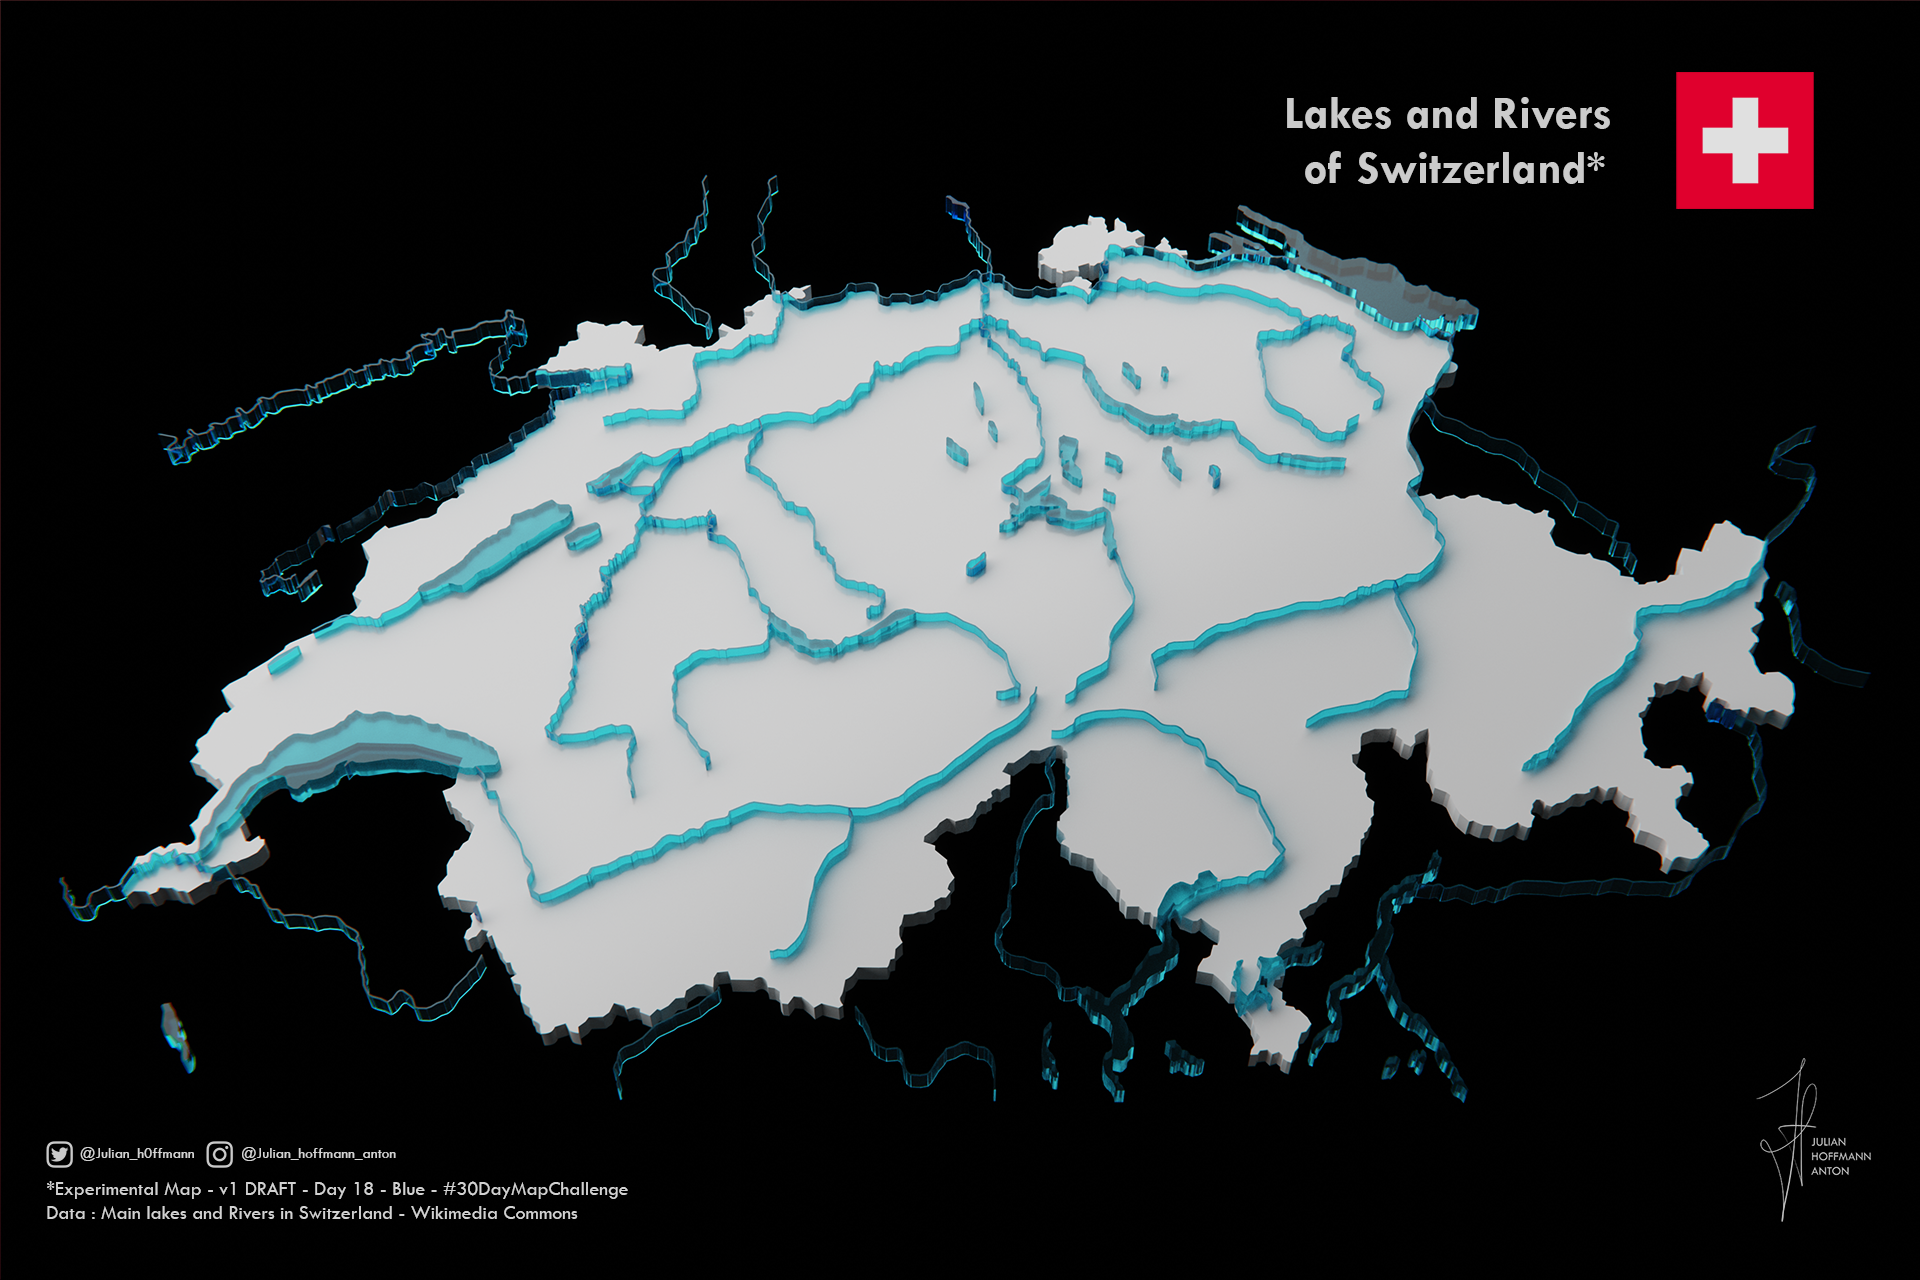
map_day_18_WATER_vJH_islands__HD_blue.png
map_day_cover_cityv3.png
map_day_22_boundaries_vJH_HD_top_black.png
map_day_2_lines_vJH_HD_side_black.png
interactive_index_bg_v4 _screenshot.png
day_6_map_greener_Berliner_vJH_HD_behind the scenesbehindthe.png
map_day_9_monochrome_vJH__HD_vzoom.png
world_population_v2_JH_behind.png
Mind-bending 3D Maps | ShowreelShowreel of Julian Hoffmann Anton's visual work! Let's bring your insights to life! Contact for collaborations: https://www.julian-hoffmann-anton.com/ Visuals made mainly with Blender, Photoshop and R.
A Clear View of Global Shipping TrafficGlobal Shipping Traffic Density : this is an experimental visualisation made in Blender with all observed ship movement from 2015-2020, at 500 m resolution from IMF's World Seaborne Trade Monitoring System & also NASA‘s Black Marble satellite imagery. As you can see, the oceans and seas are transparent, creating a unique view that includes the other side of the globe.
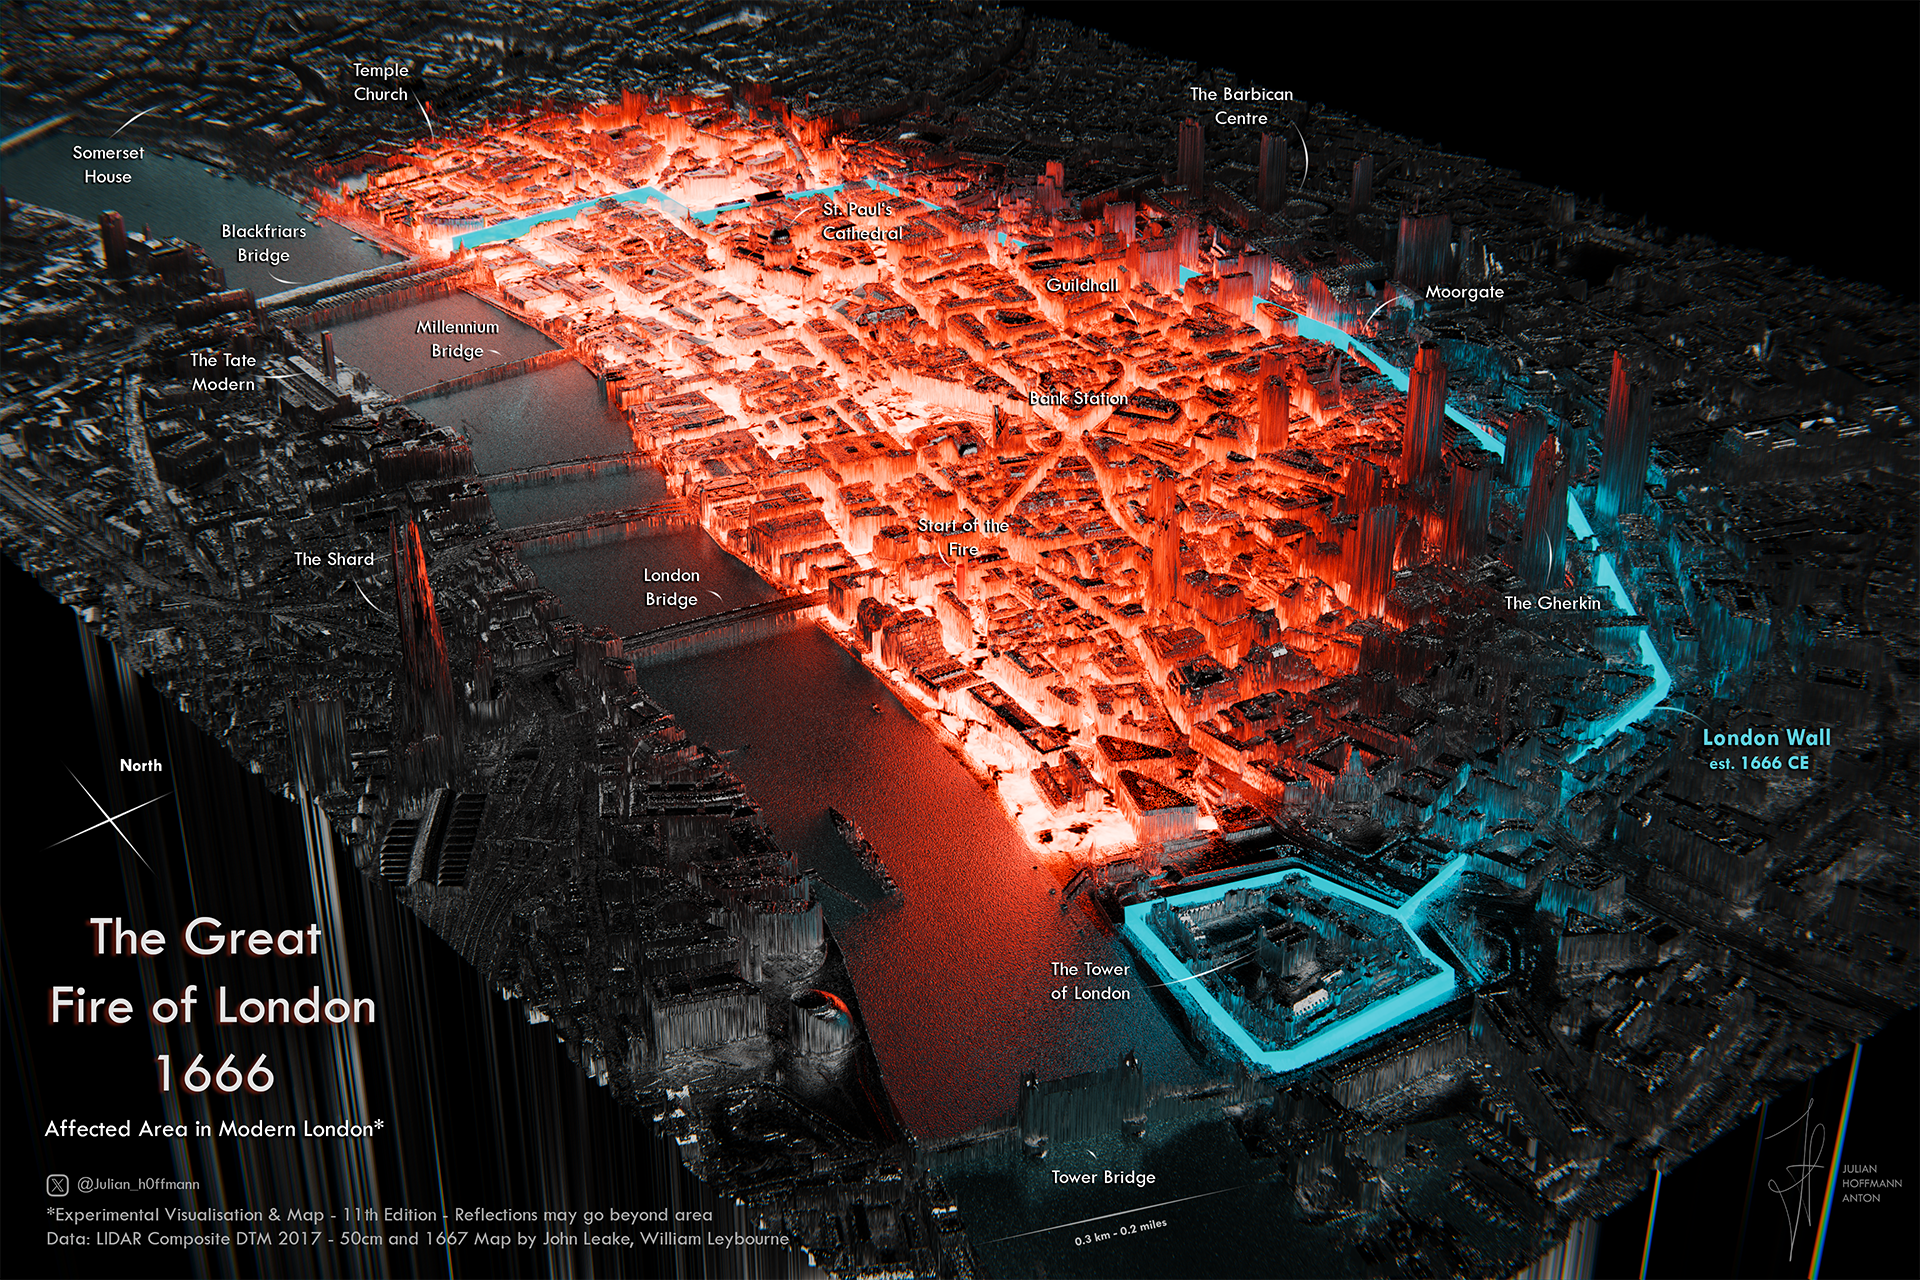
The Great Fire of London (1666)
Tokyo Eat Map
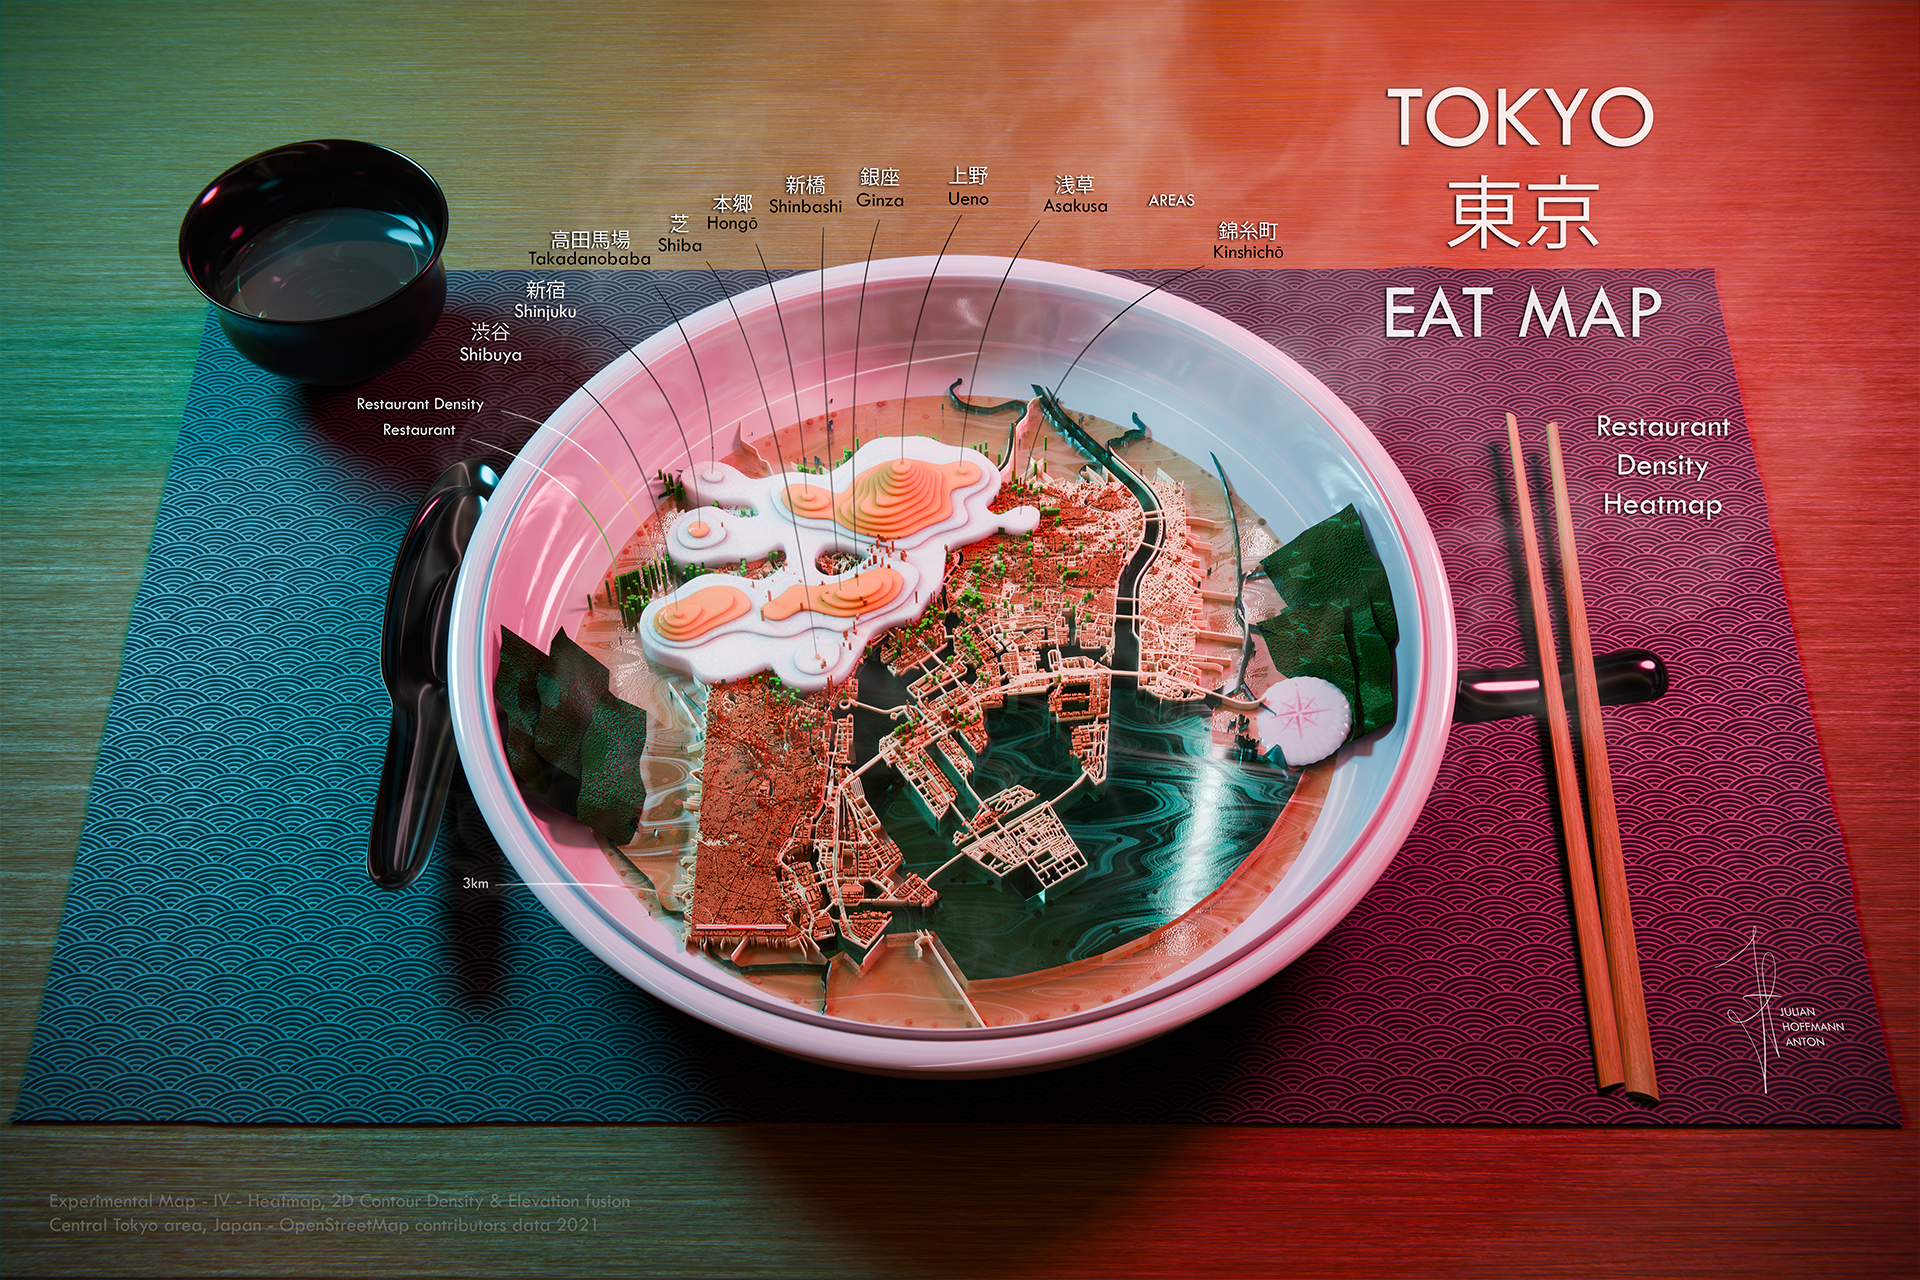
Tokyo Eat MapThe “Tokyo Eat Map” is an experimental data visualization in 3D with a “meta” reference to the data it displays. It represents the density of restaurants in central Tokyo on a map, morphed into a typical Japanese ramen dish. It is a mix of a heatmap, density map and contour visualization, embellished with artistic liberties. I see it as a simple story of finding the right ramen restaurant within Tokyo’s culinary hotspots, and dreaming the delicious dish as a map or vice versa, the map as a dish. The data is freely available from OpenStreetMap’s points of interest, specifically places labelled as “Restaurant”. The first version which I have been enriching since was made as part of an online creative mapping challenge: 30DayMapChallenge November 2021. All made with open-source programmatical GIS tools in R, then modelled in Blender, an open-source 3D visual effects software, and finally edited and labelled in Photoshop for the final touch.
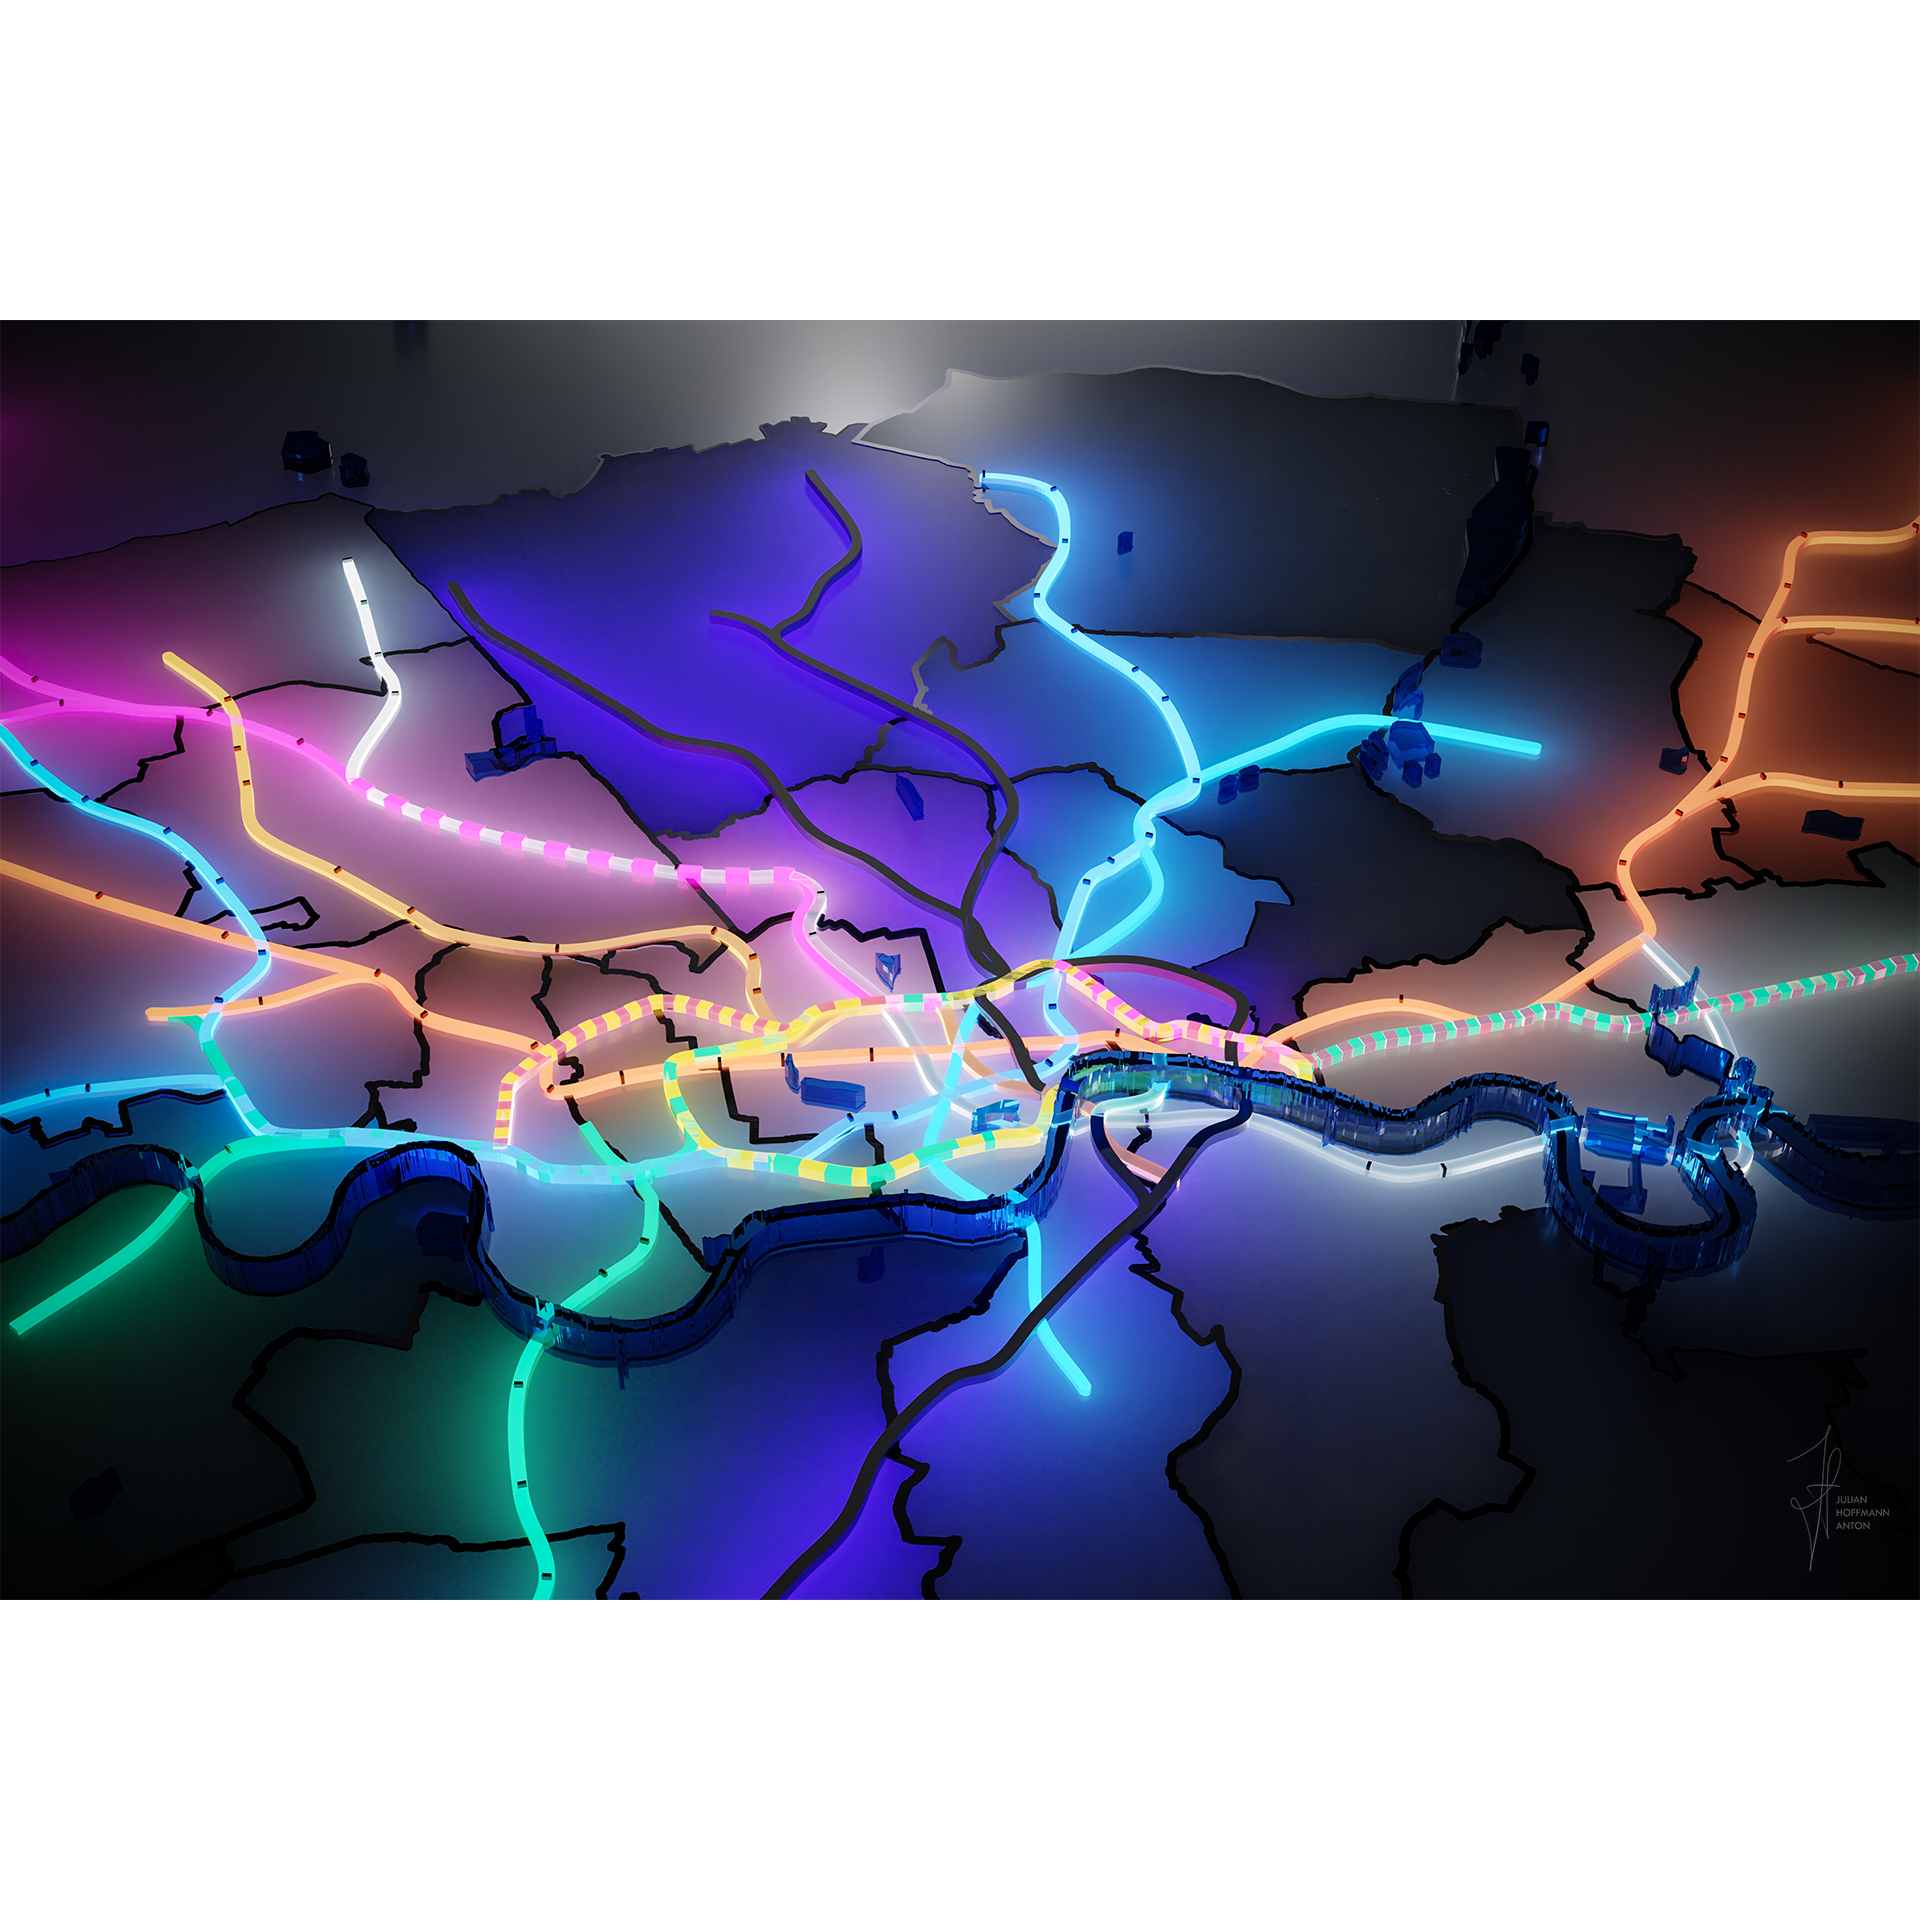
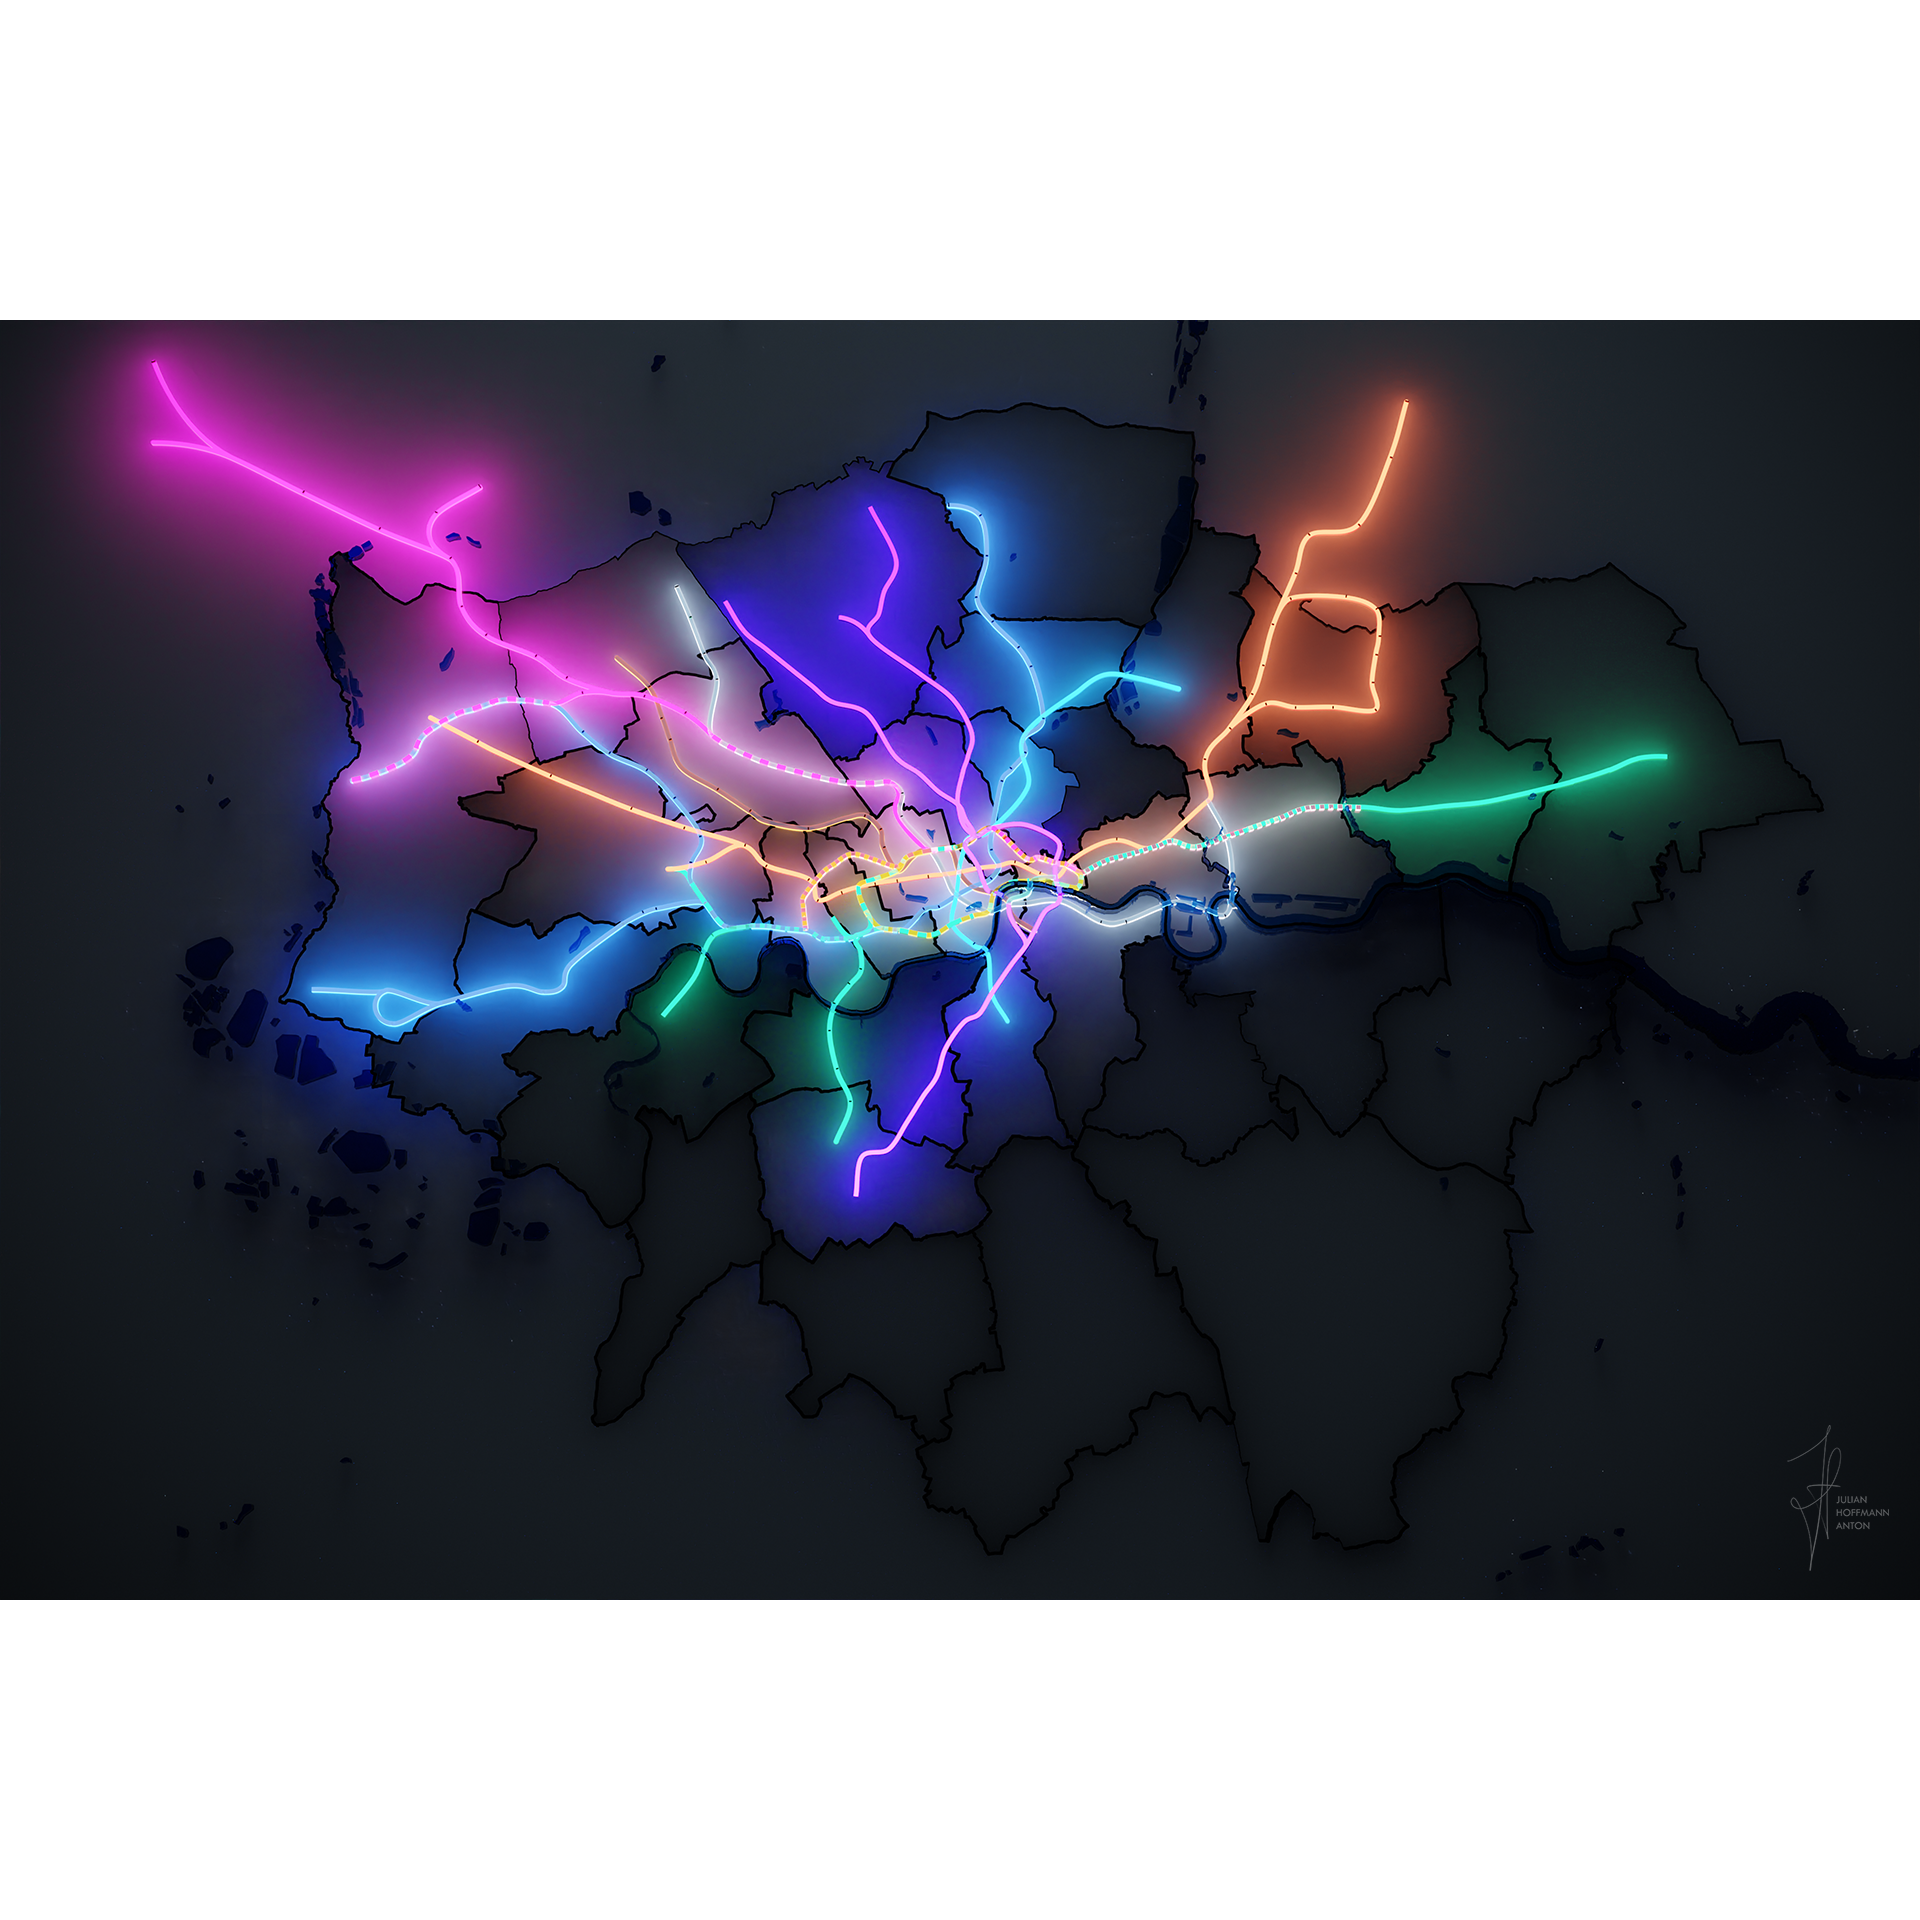
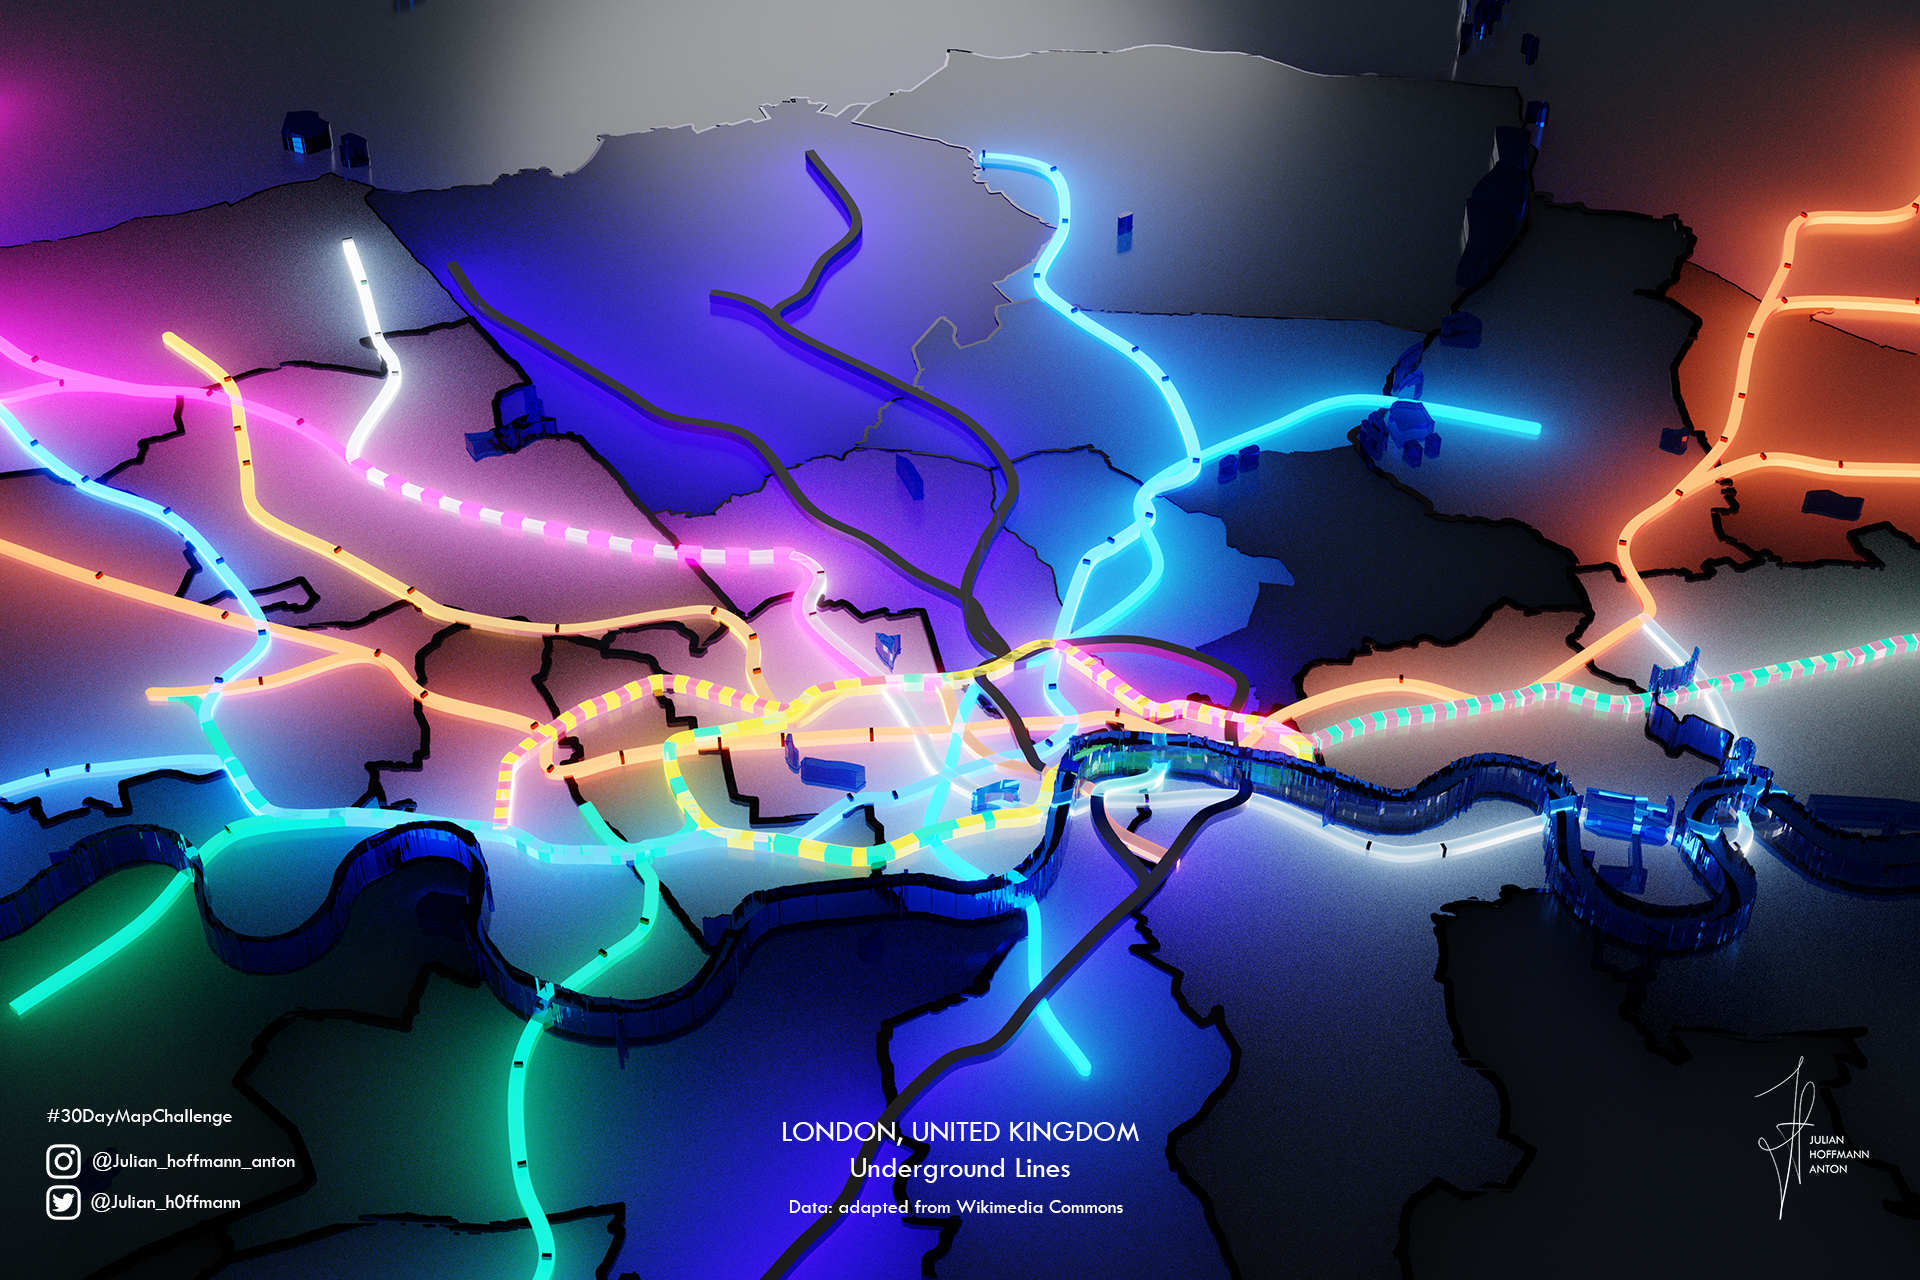
London Undeground
London UndegroundArtistic Visualisation of the London underground network, 2021. Made for the #30DayMapChallenge in Blender.
IRL_Carcassonne_v94_labels.png
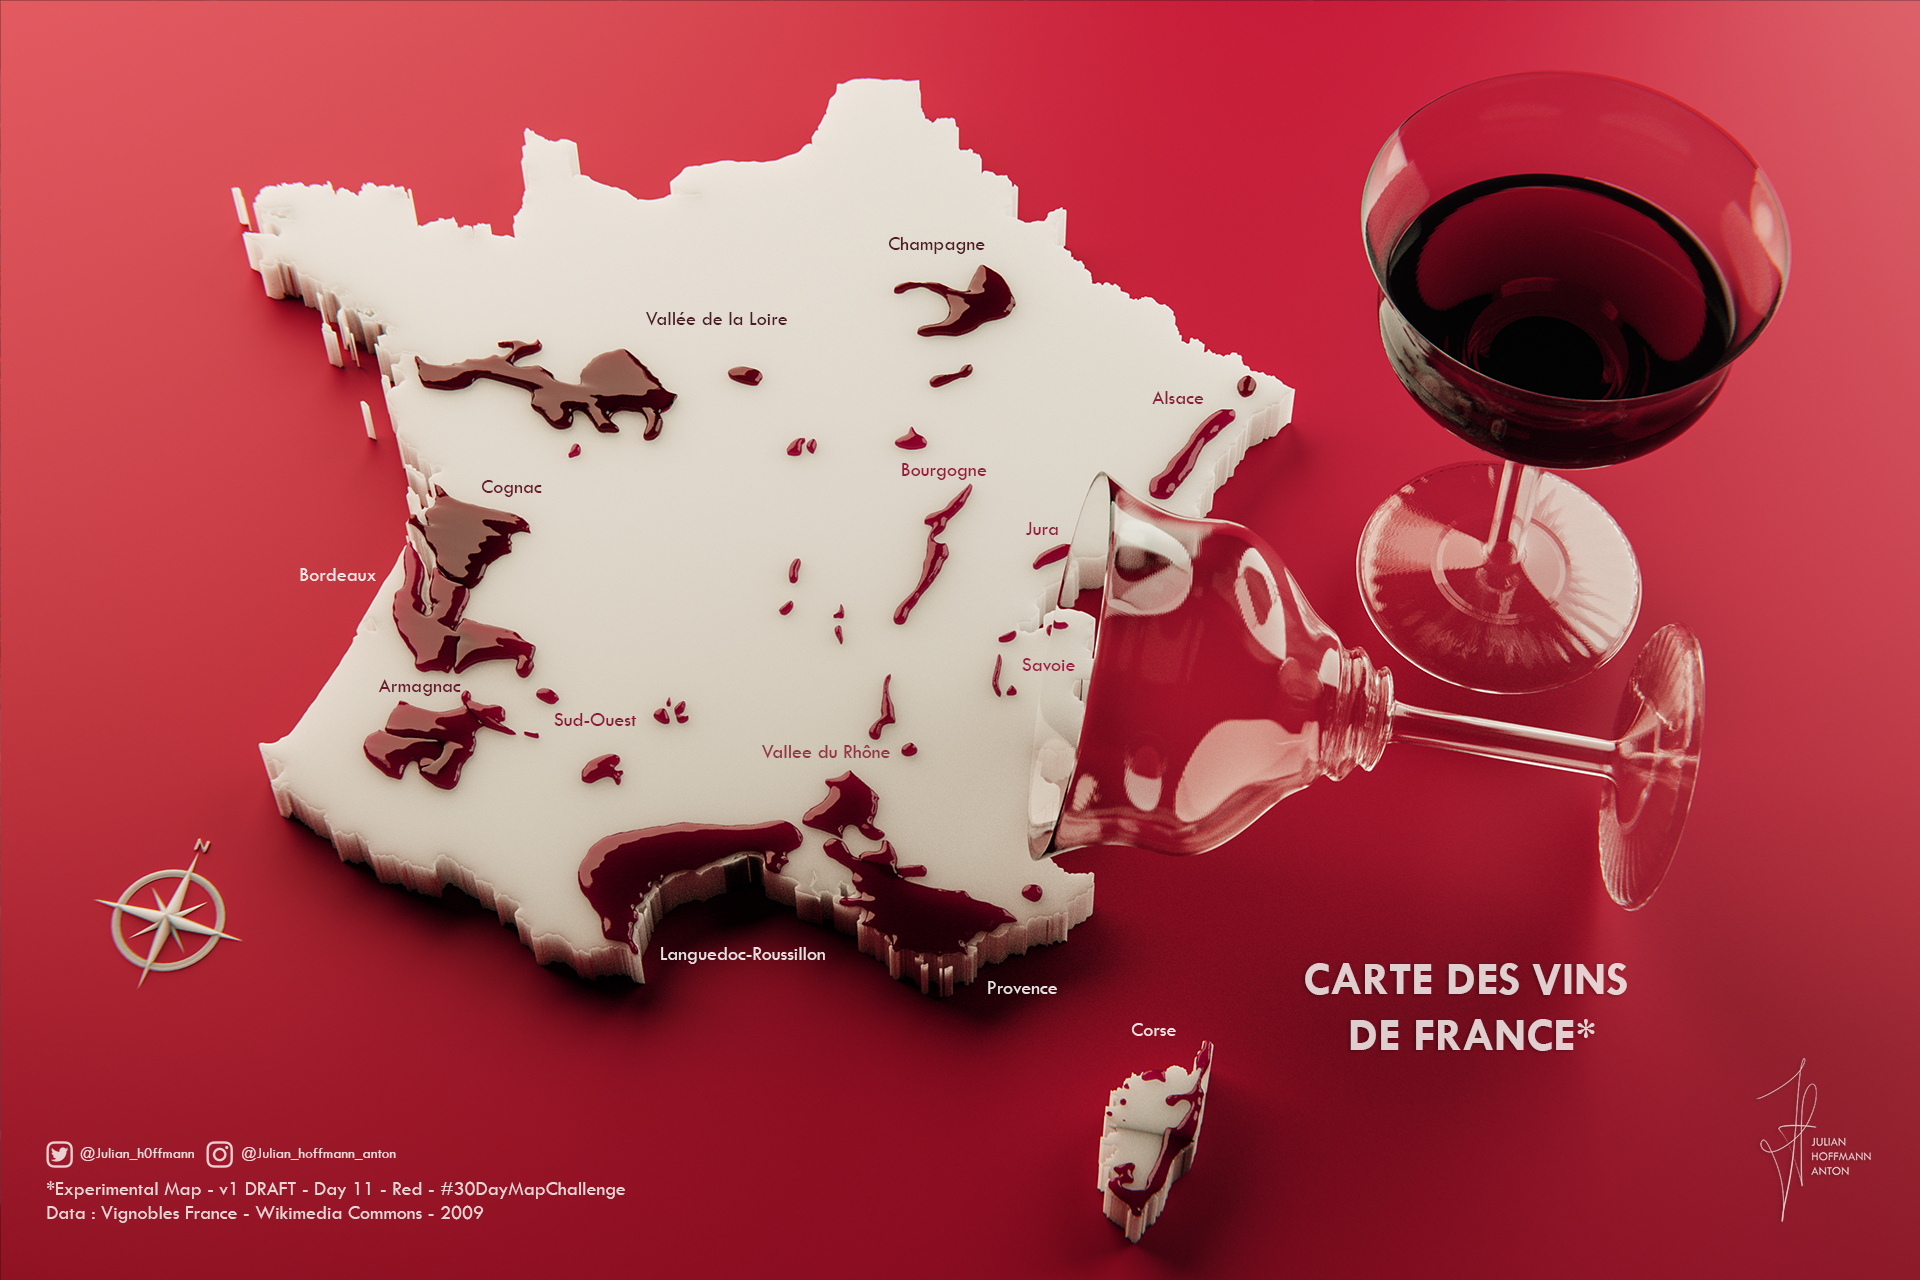
La Carte des Vins de France
Barcelona (Typography)
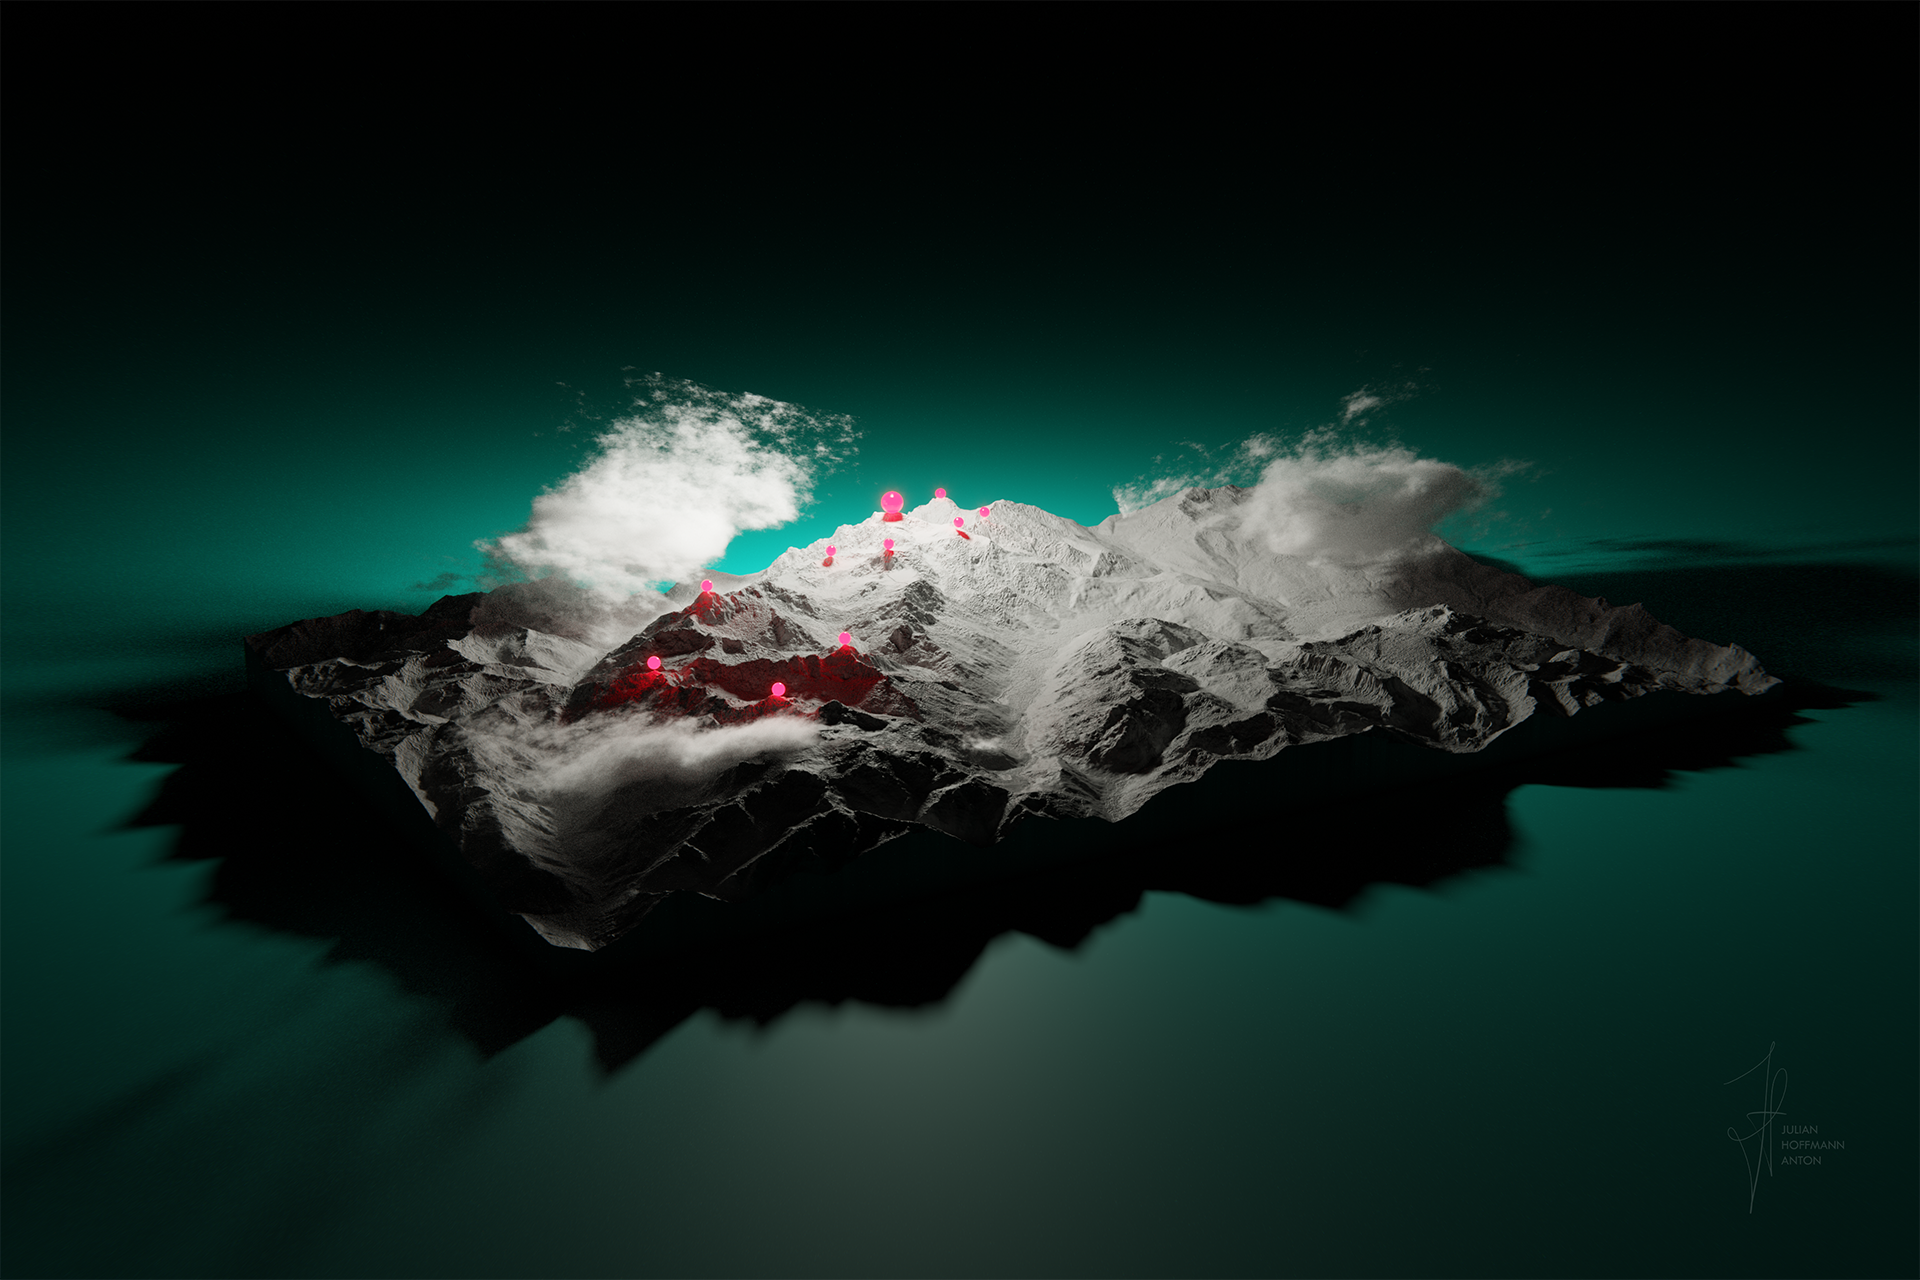
mont_blanc_example_3hd.png
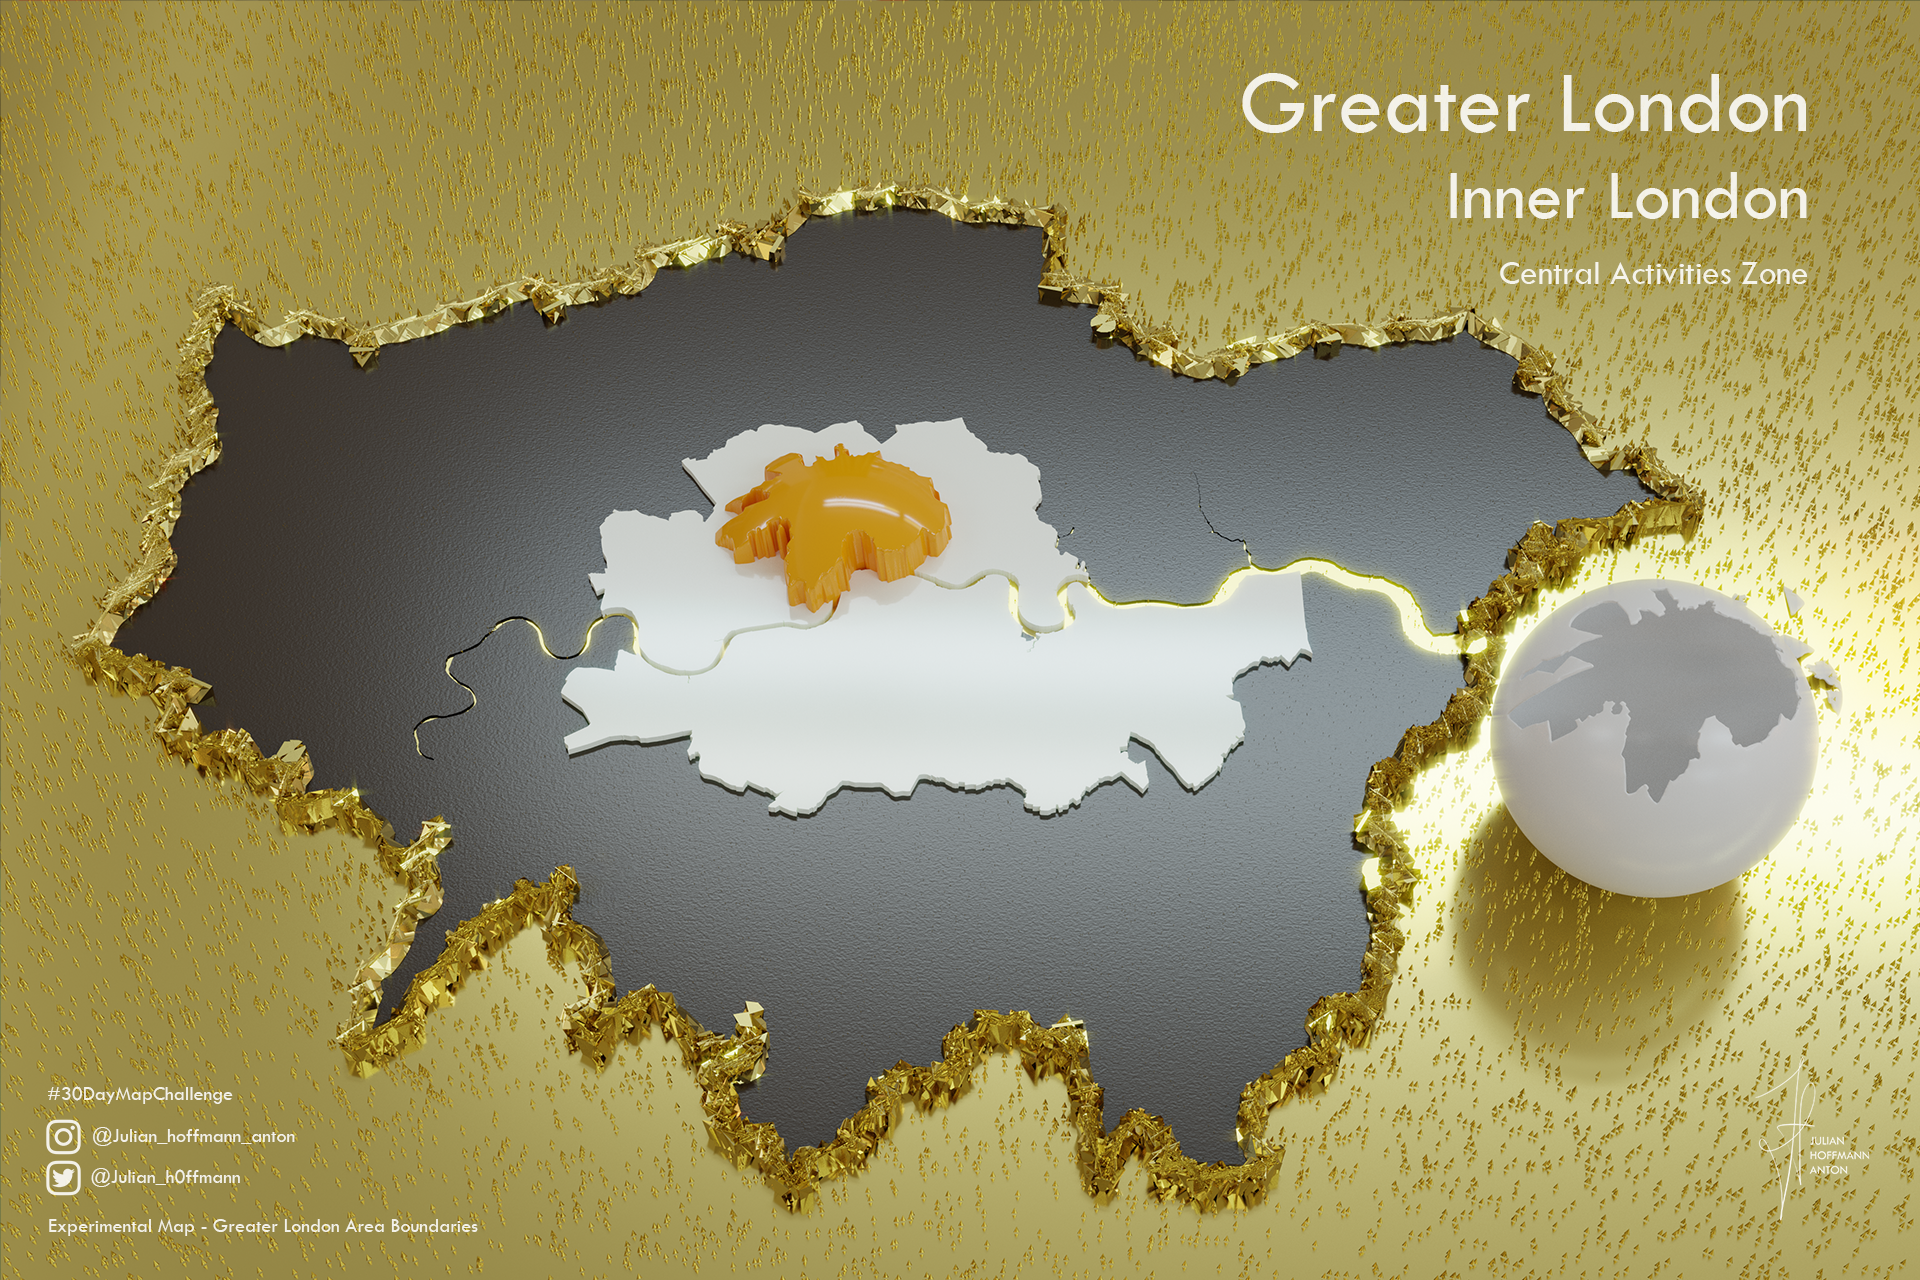
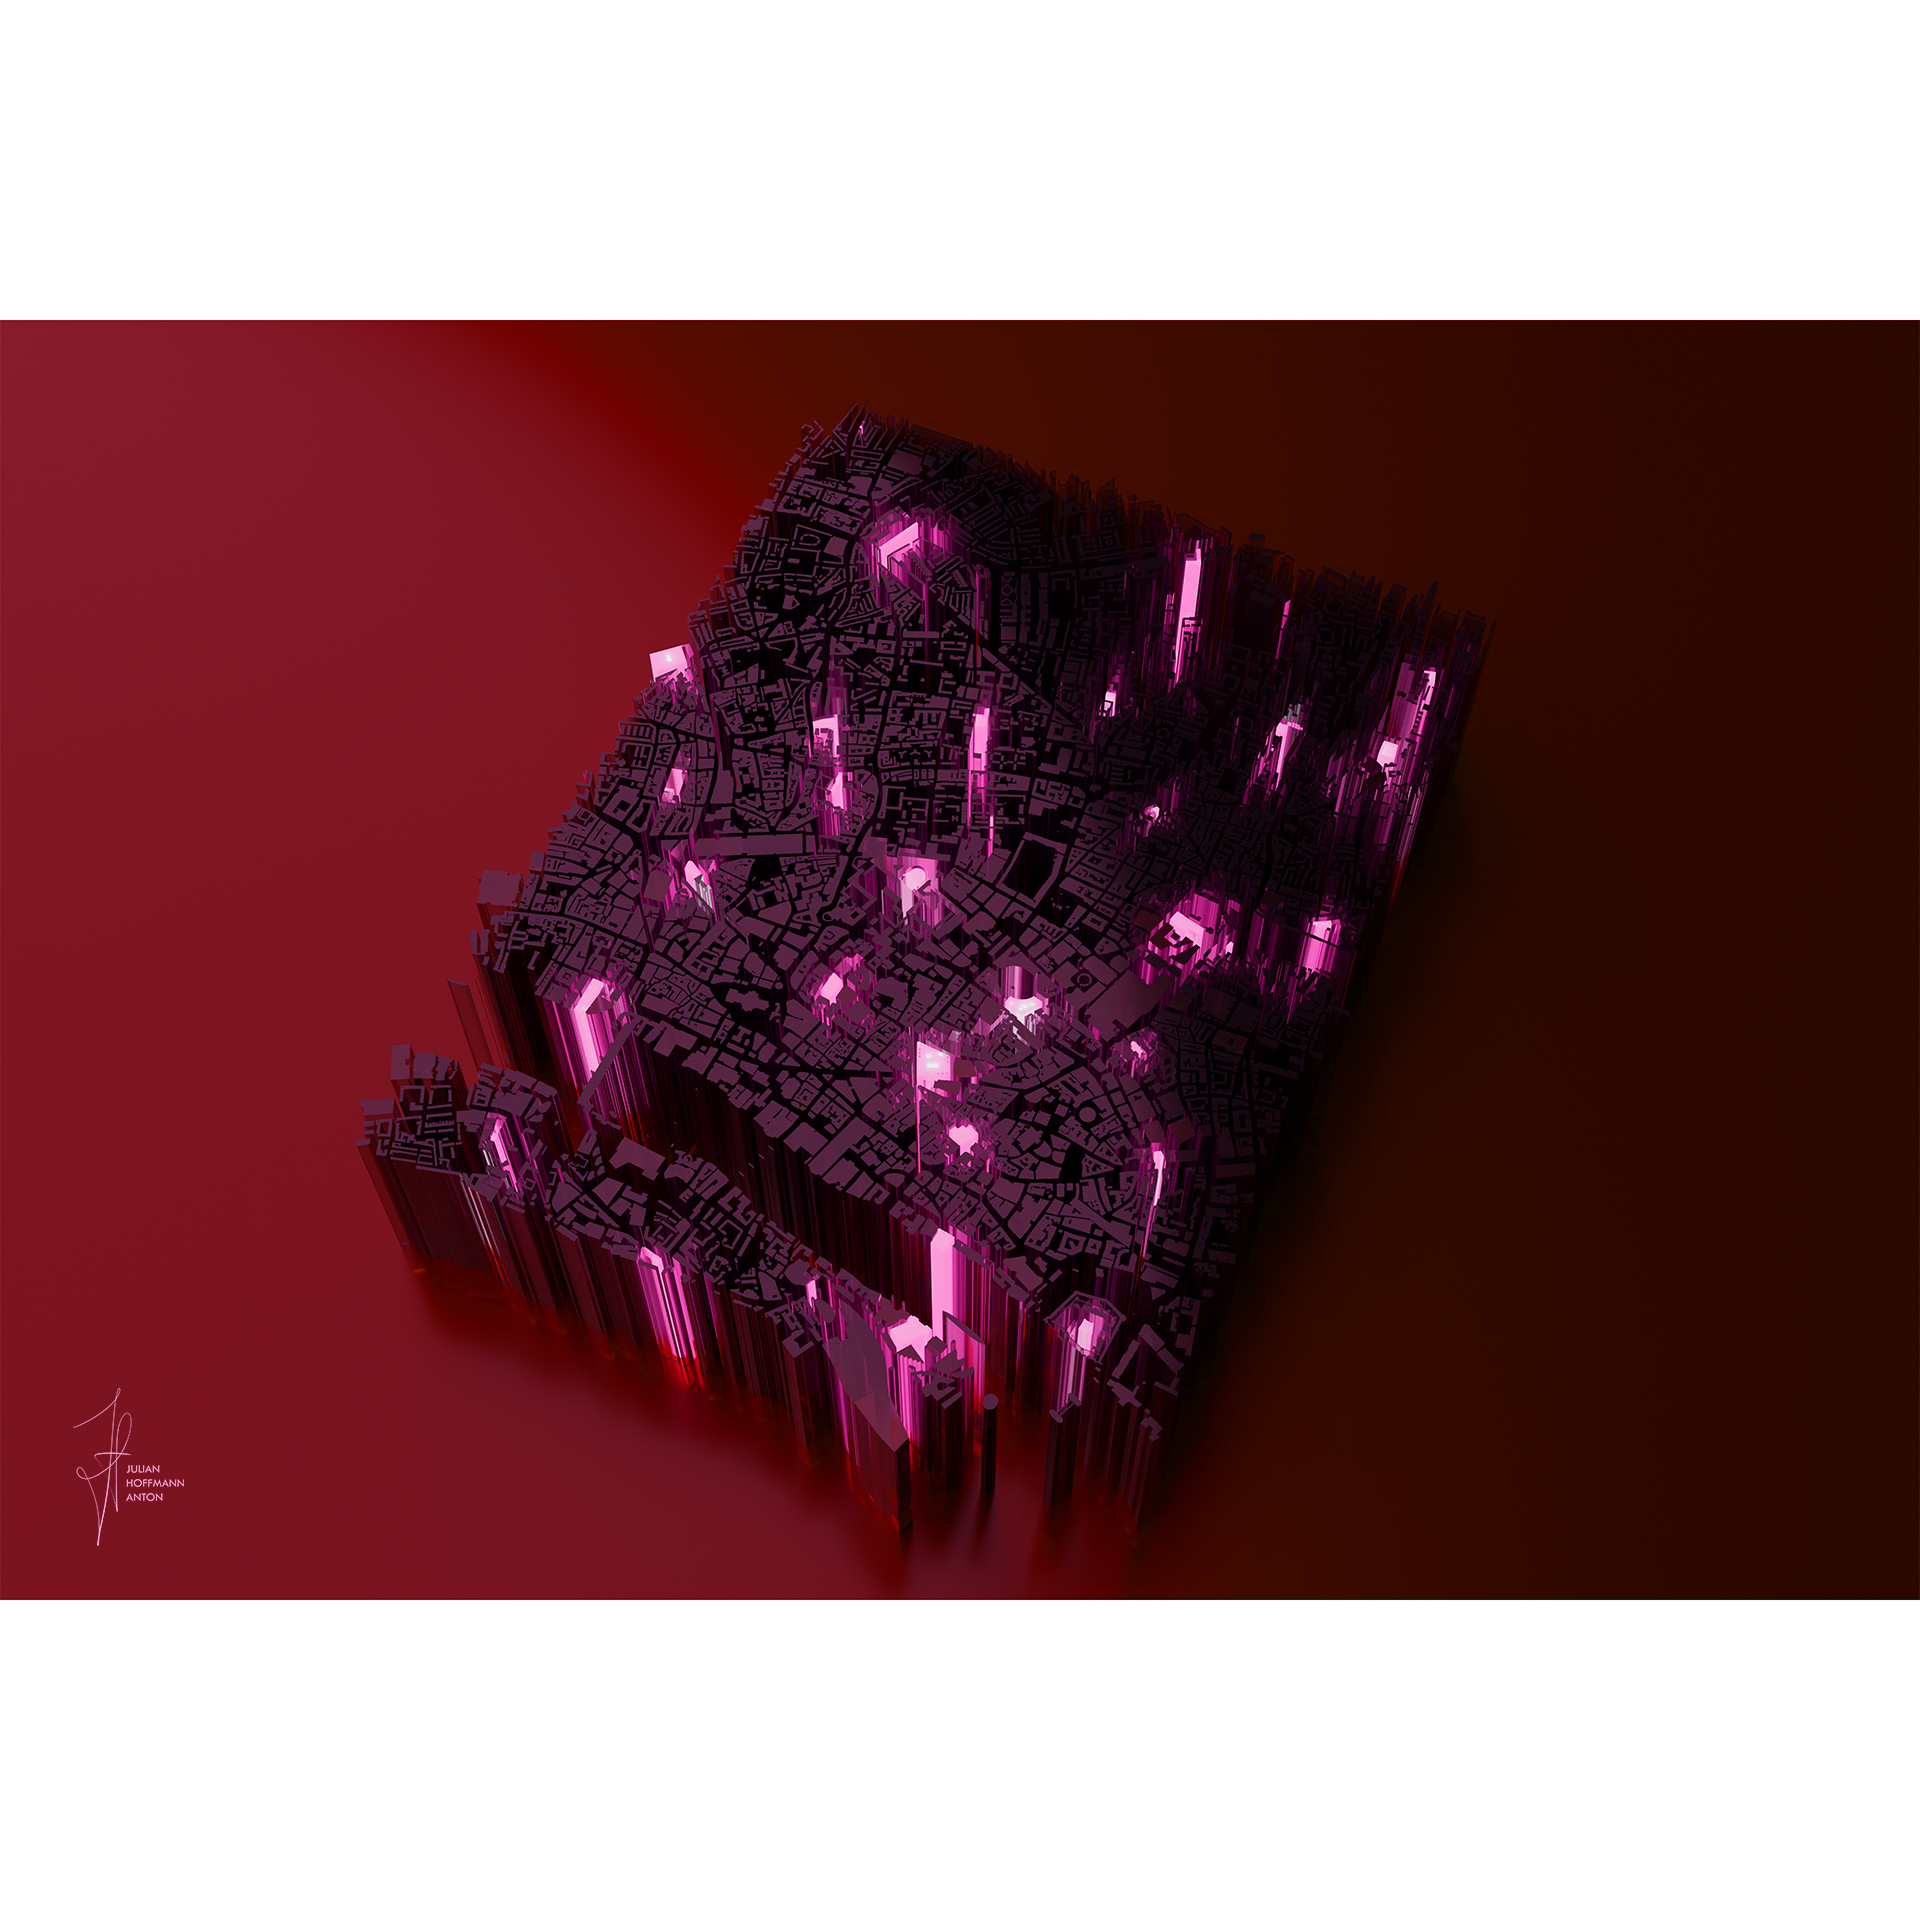
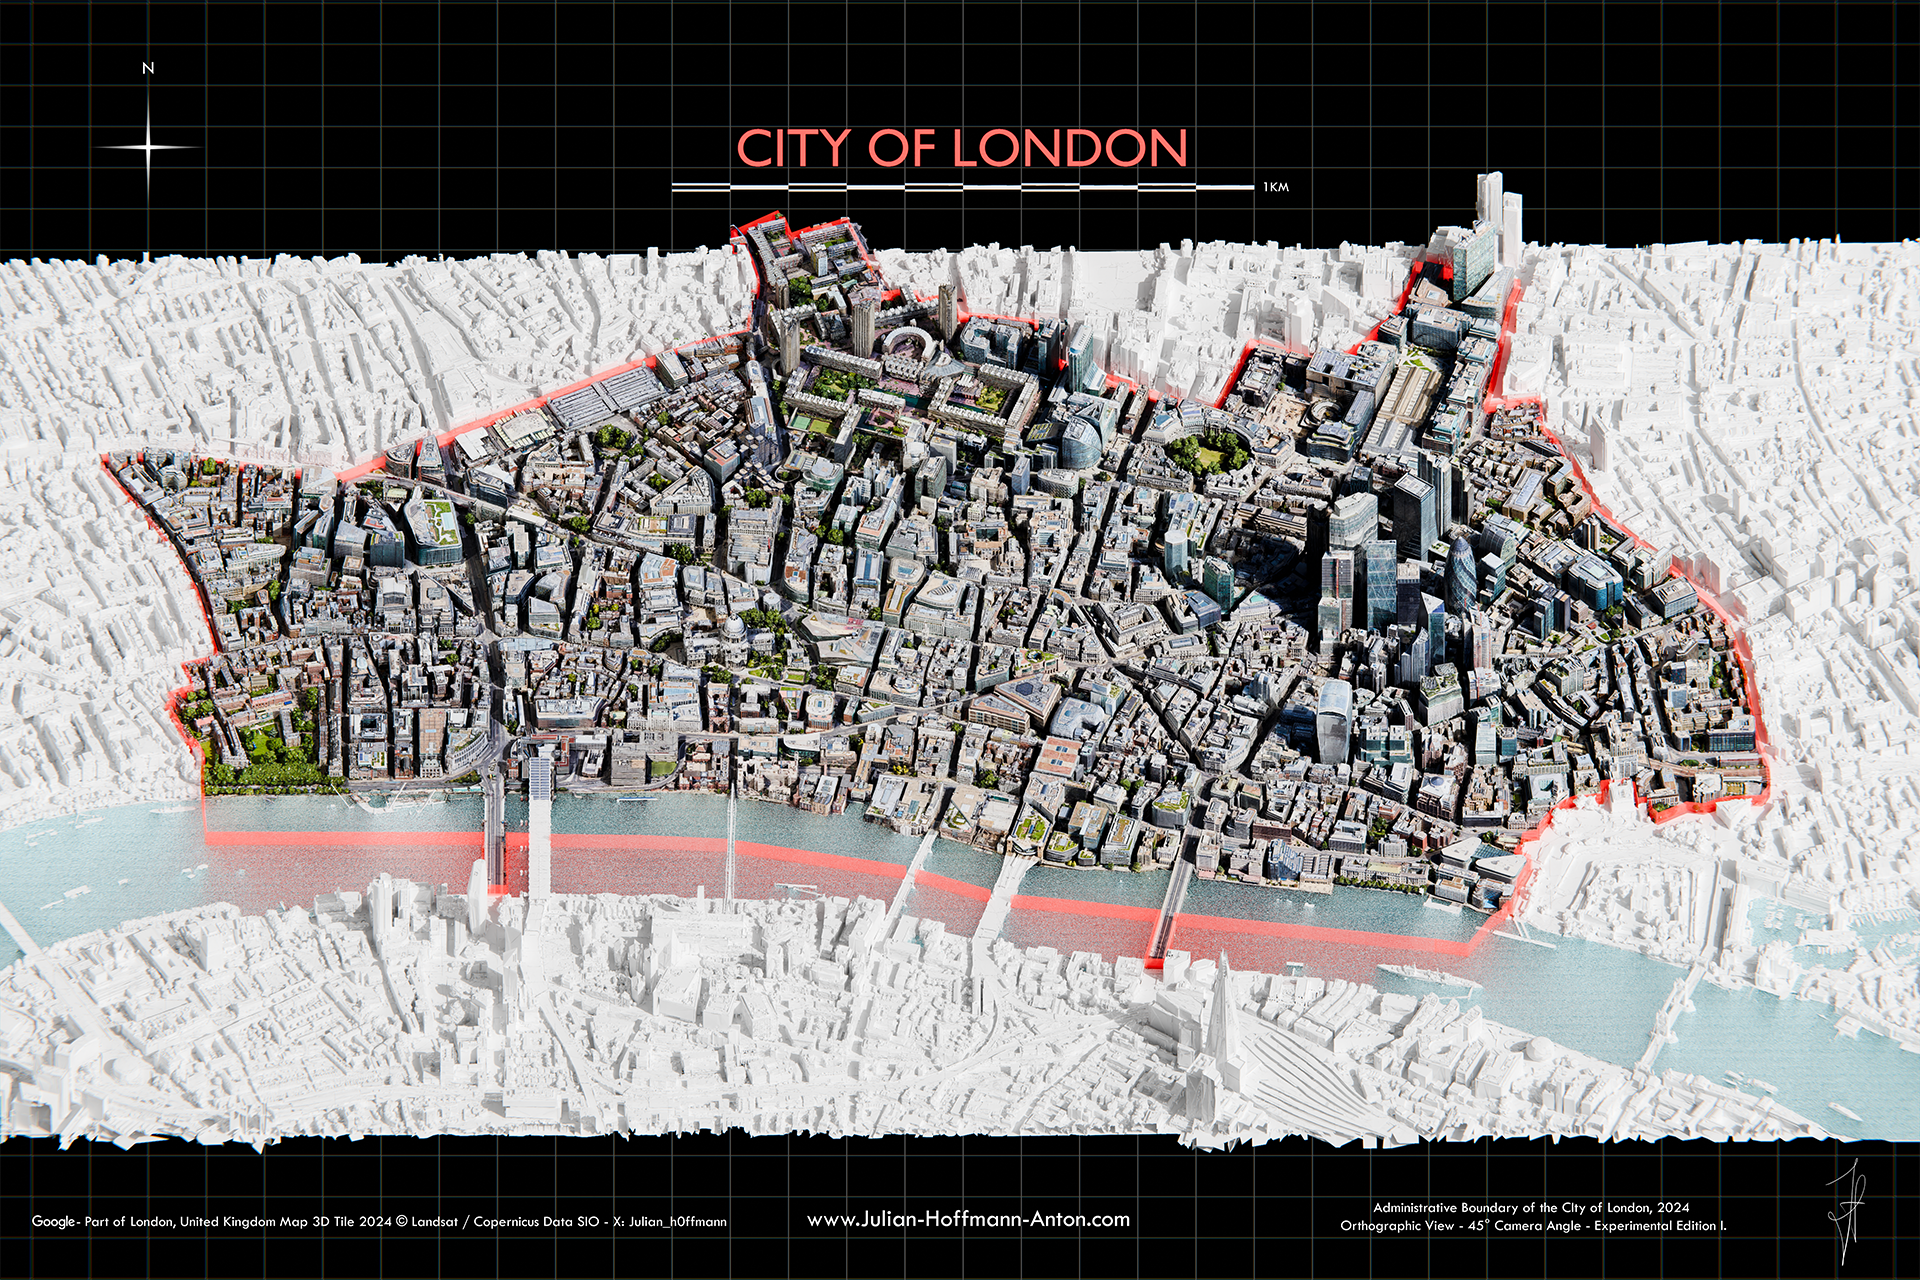
The City of London
The City of London
Global Shipping Density Network
map_day_27_Tokyo-Eat_Map_vJH_animation_print8K_PRINT_FHD.png
Halloween_phone_america_v2_fff.png
The Train Lines of Switzerland
Halloween_phone_africa_v2fff.png
Halloween_phone_australia_v3_ffffff.png
World Population 1950 - 2100Experimental cartogram animation of the UN Population Prospect's (2022) estimations from 1950 to 2100. More at: www.julia-hoffmann-anton.com Analysis made in R and 3D visualisation in Blender.
ISometric_new_york_vhd_Godzilla_minus_one_v4_HD.png
Golden Age of Creativity
Golden Age of CreativityVisual experiment created for IMEdD conference and Keynote talk in Athens: https://youtu.be/Ya38ZYH68is?si=39sR3ay6HVcJymfA
The Eiffel Tower of London
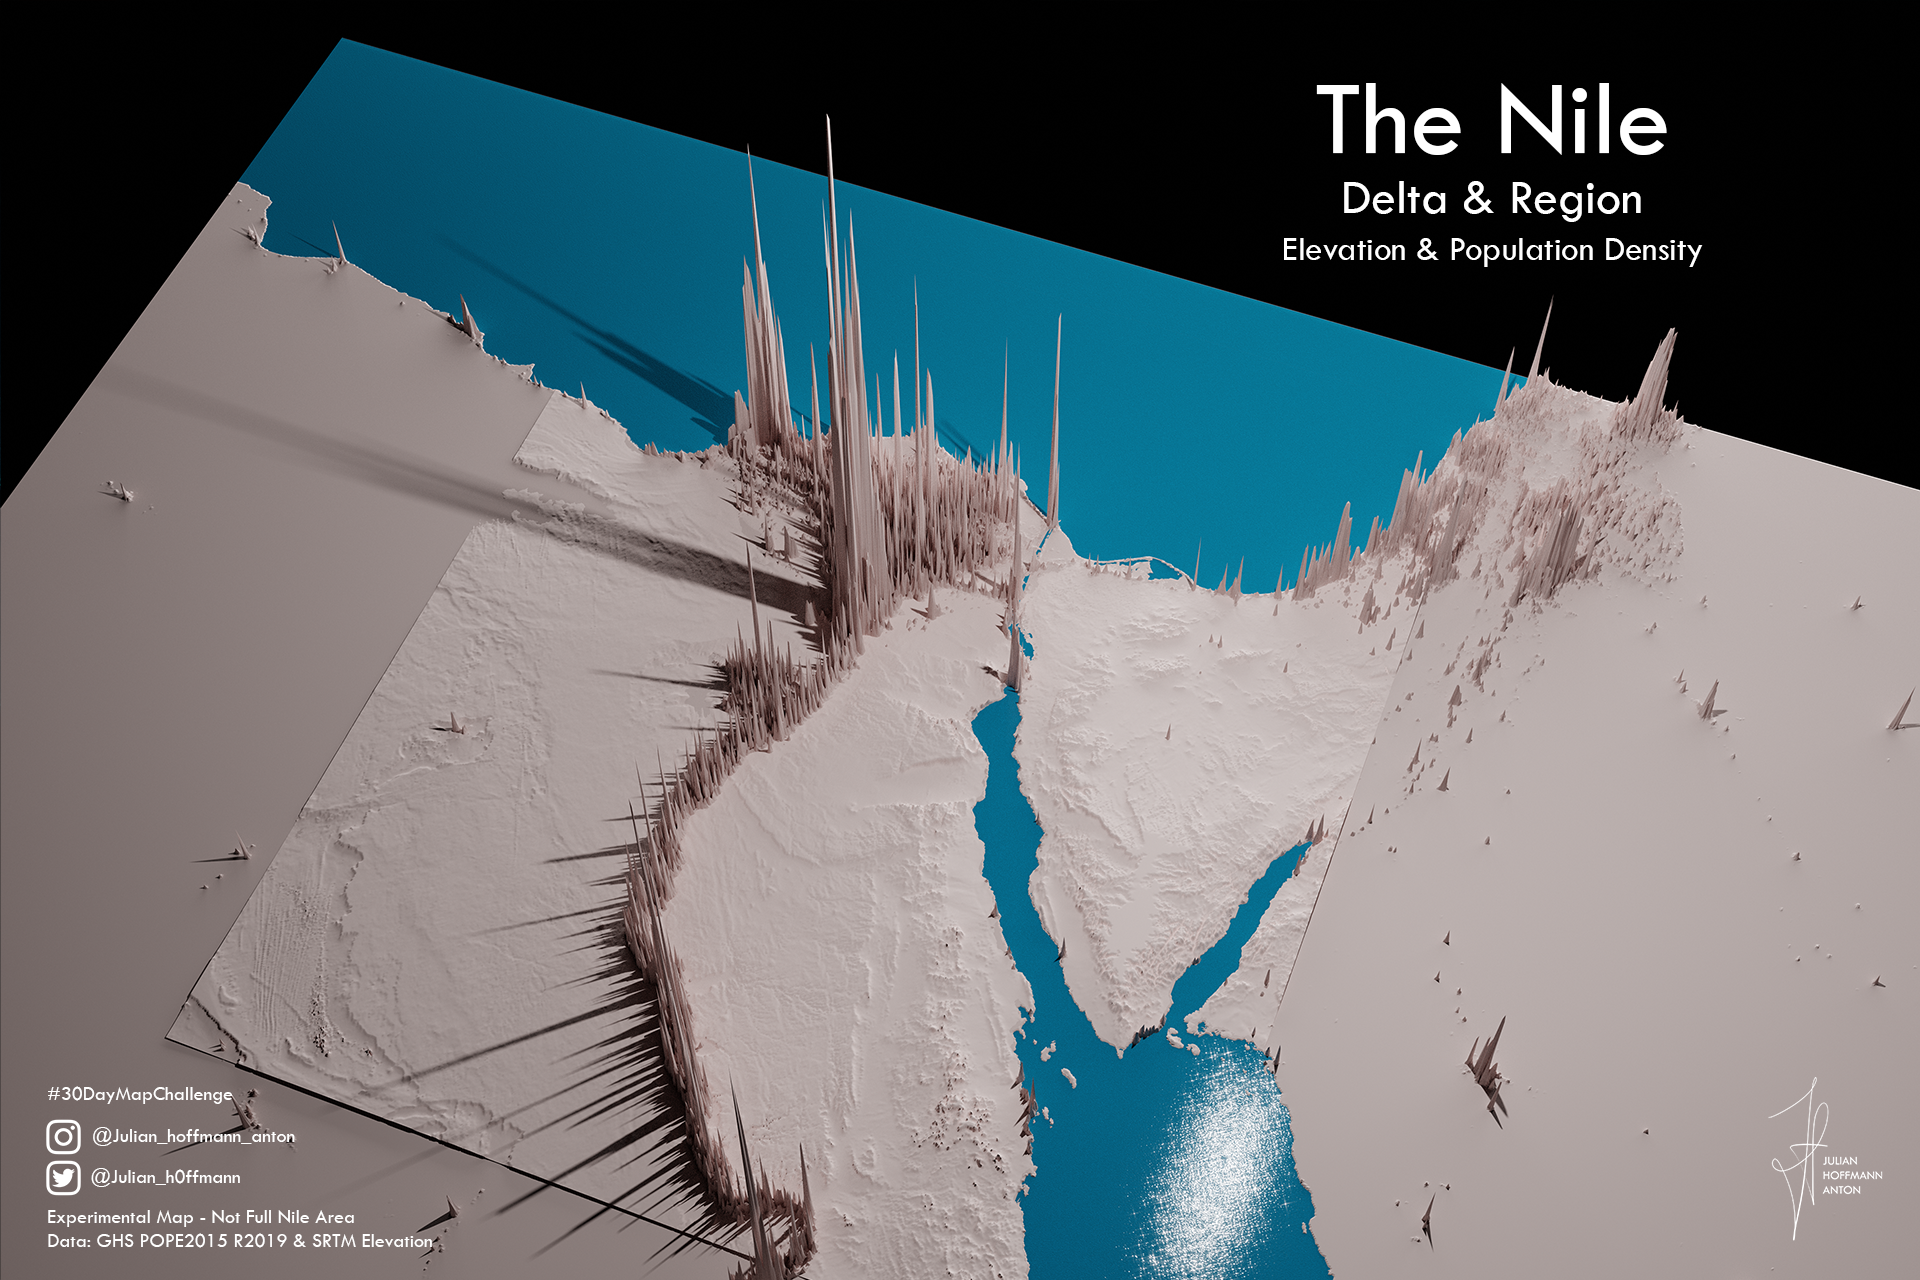
screenshot_nile.png
map_day_5_COP26_vJH_HD_CB.png
map_iceland_labels_draft_v1twitter.png
Midtown_v2_edition_III.png
Paris Neon-Expo v1
Paris Neon-Expo v1
Not_a_chart_templatetwitter.png
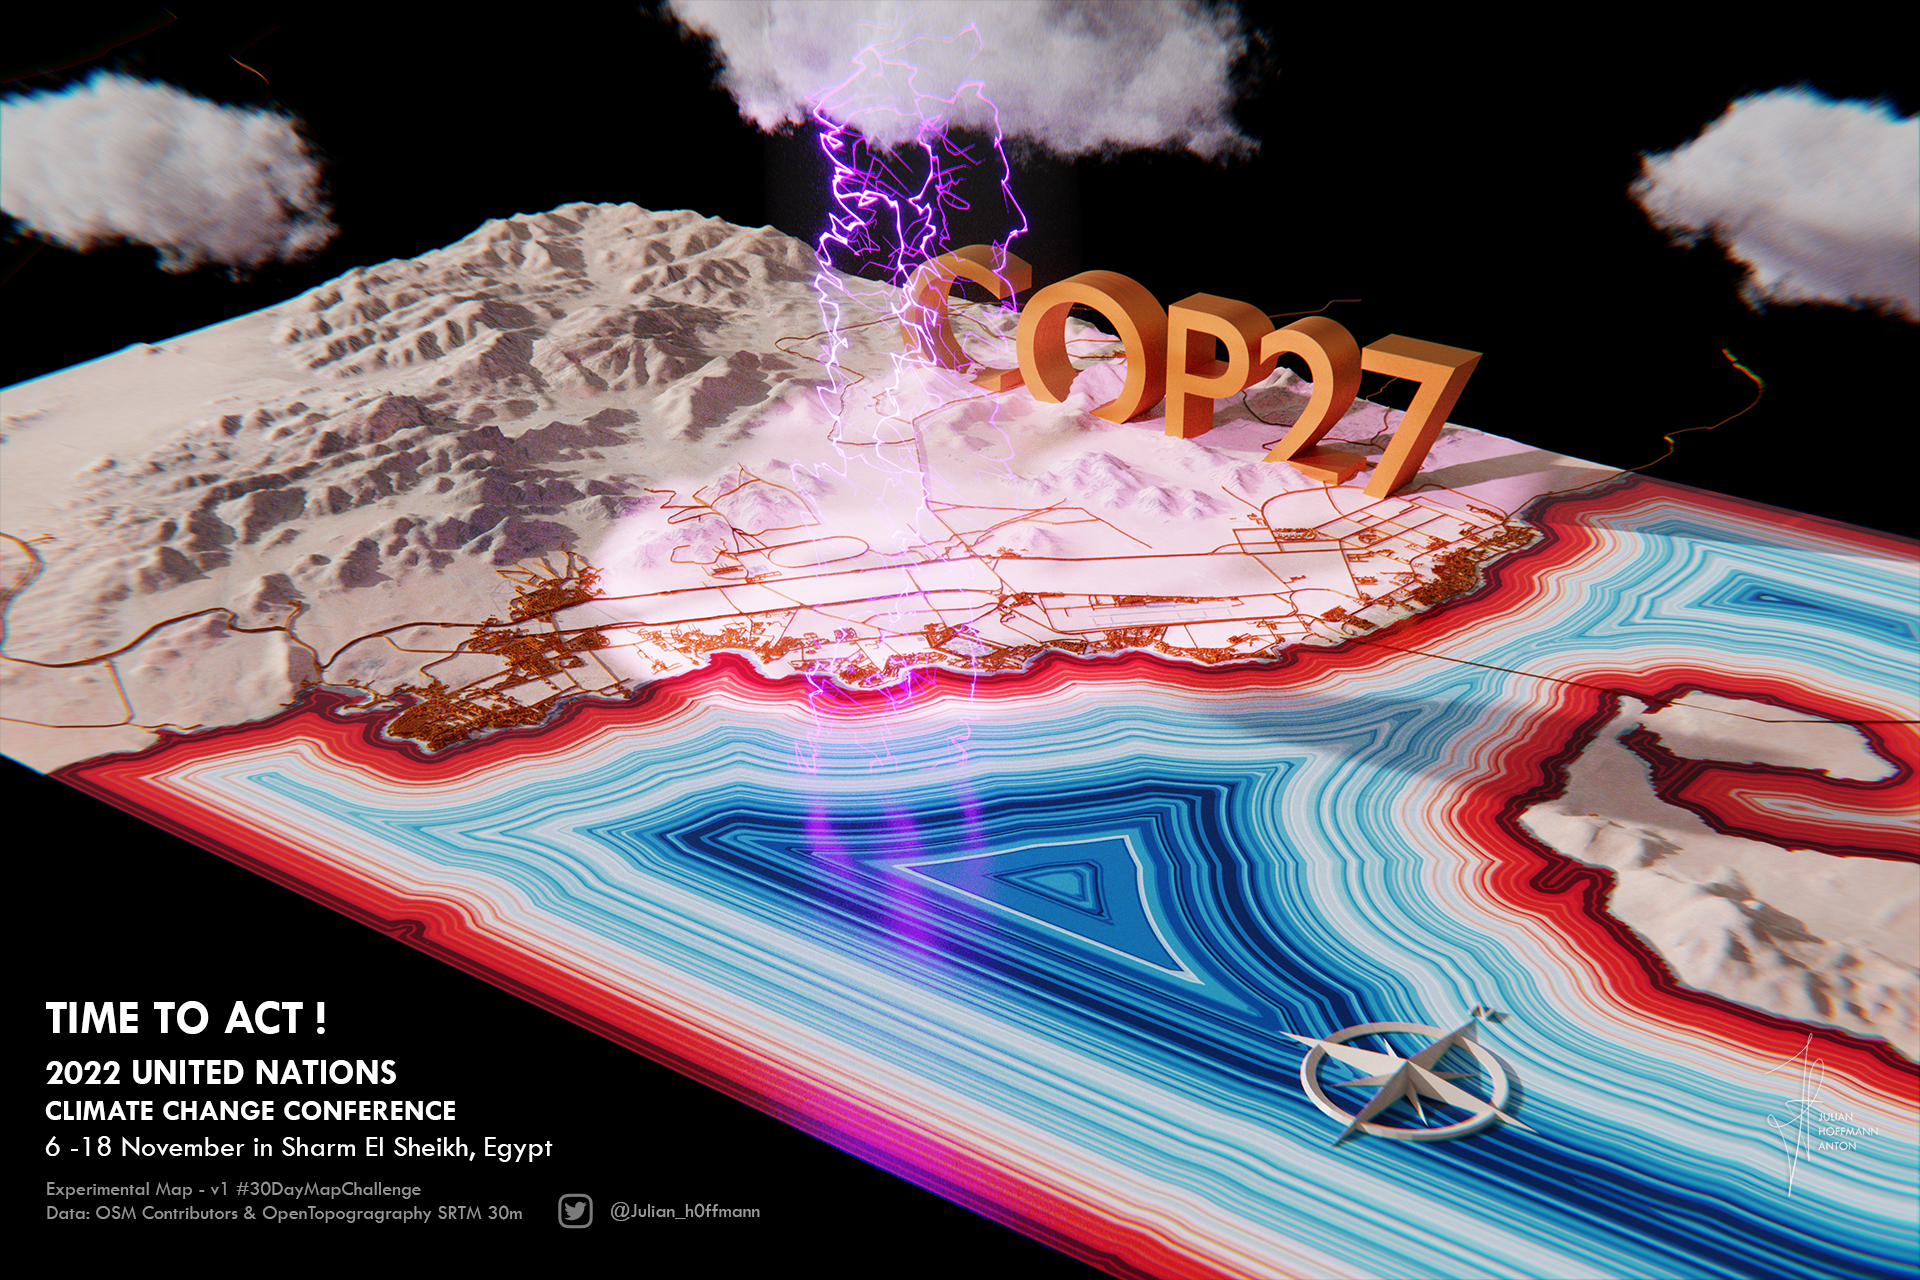
map_cop27_labelsstatic_1-Julian_Hoffmann.png
Pieces of the USA
Pieces of the USADraft Visualisation
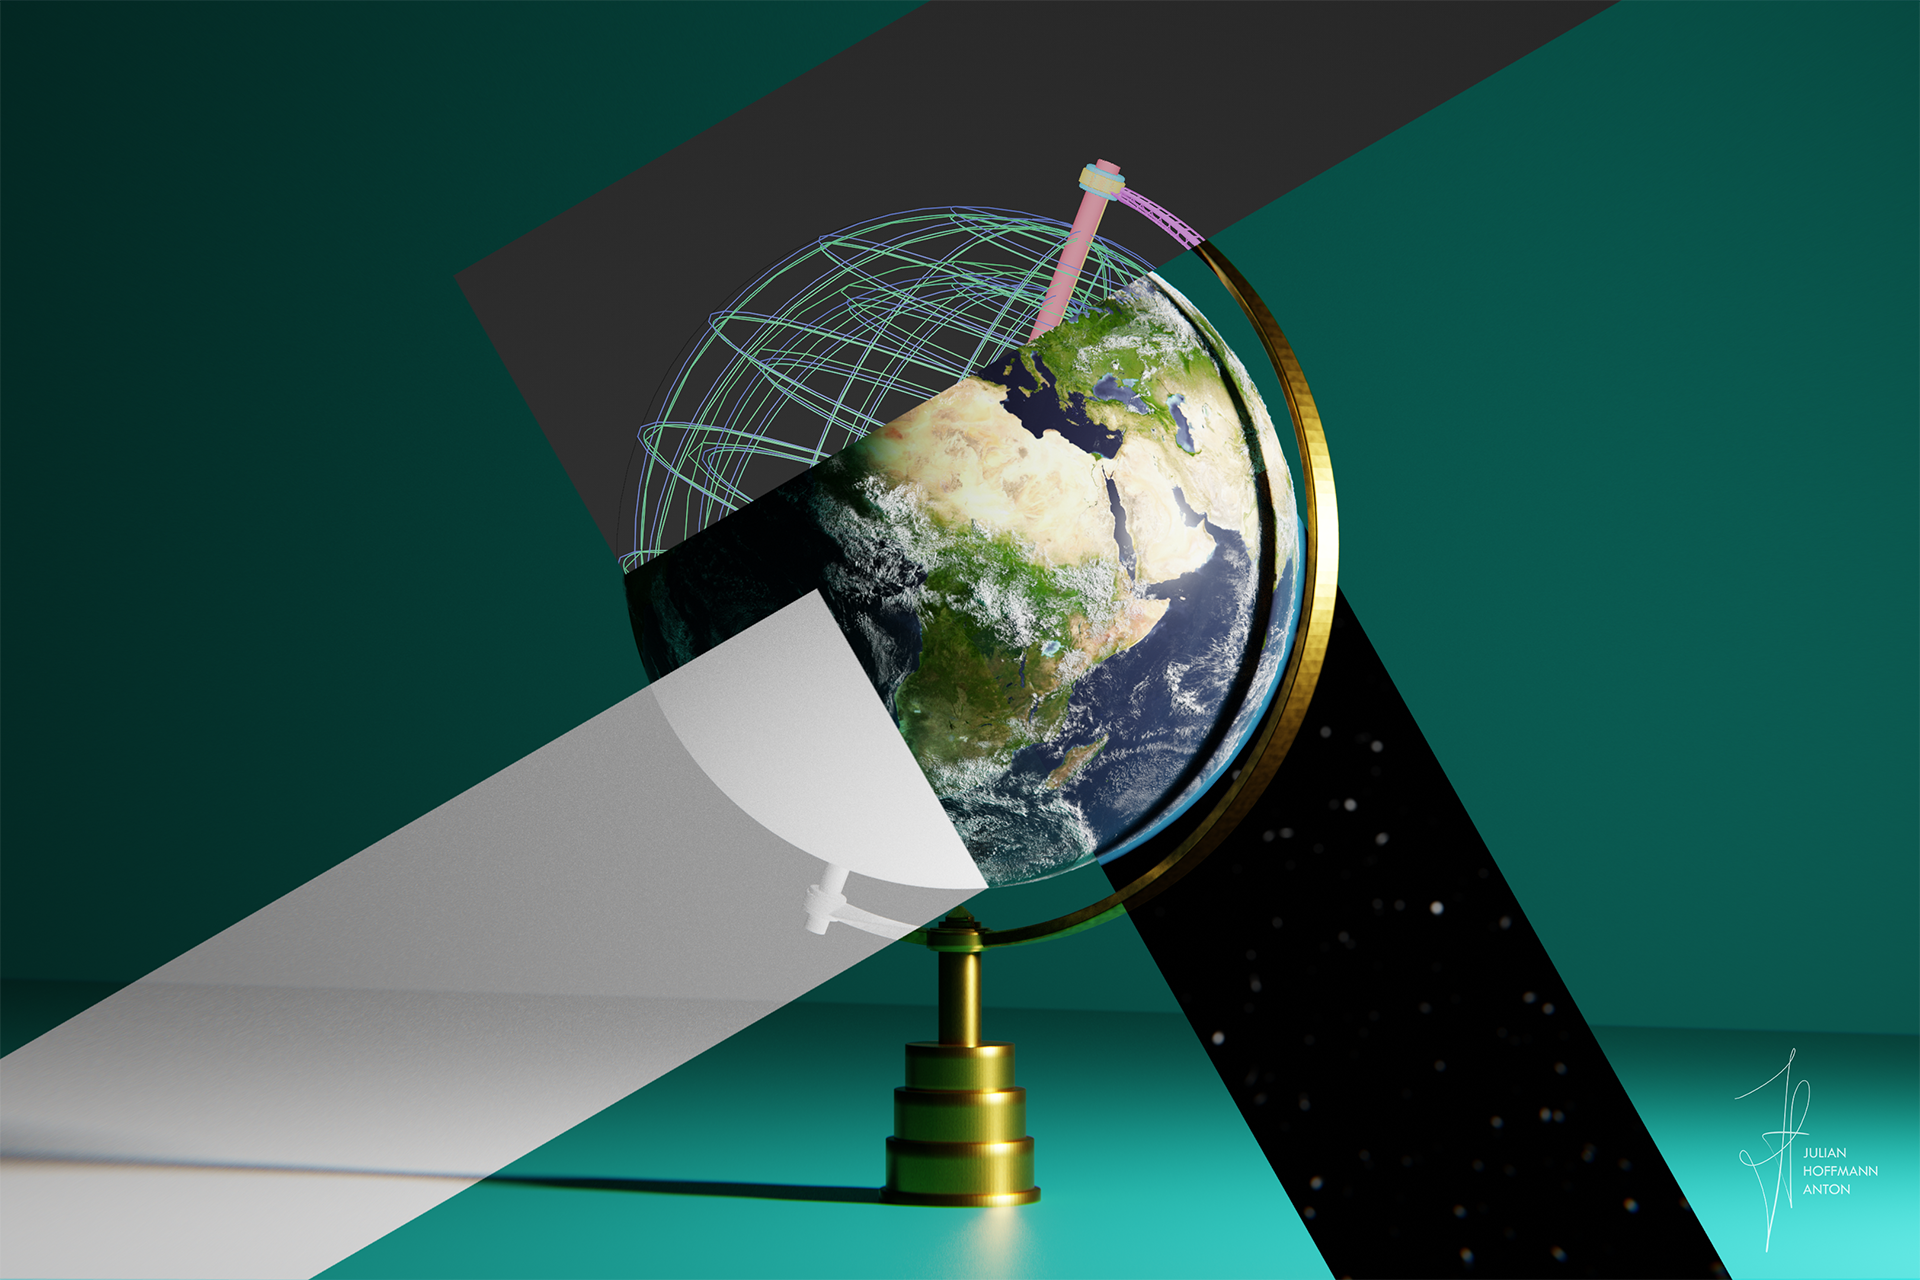
globe_base_comparison4b64b6.png
map_red_wine_labelshd_twitter3.png
map_day_24_historical_vJH_queen_queue_v1queen_line_v.png
l_hexagone_v3.png
Navigation_v20_217_labels.png
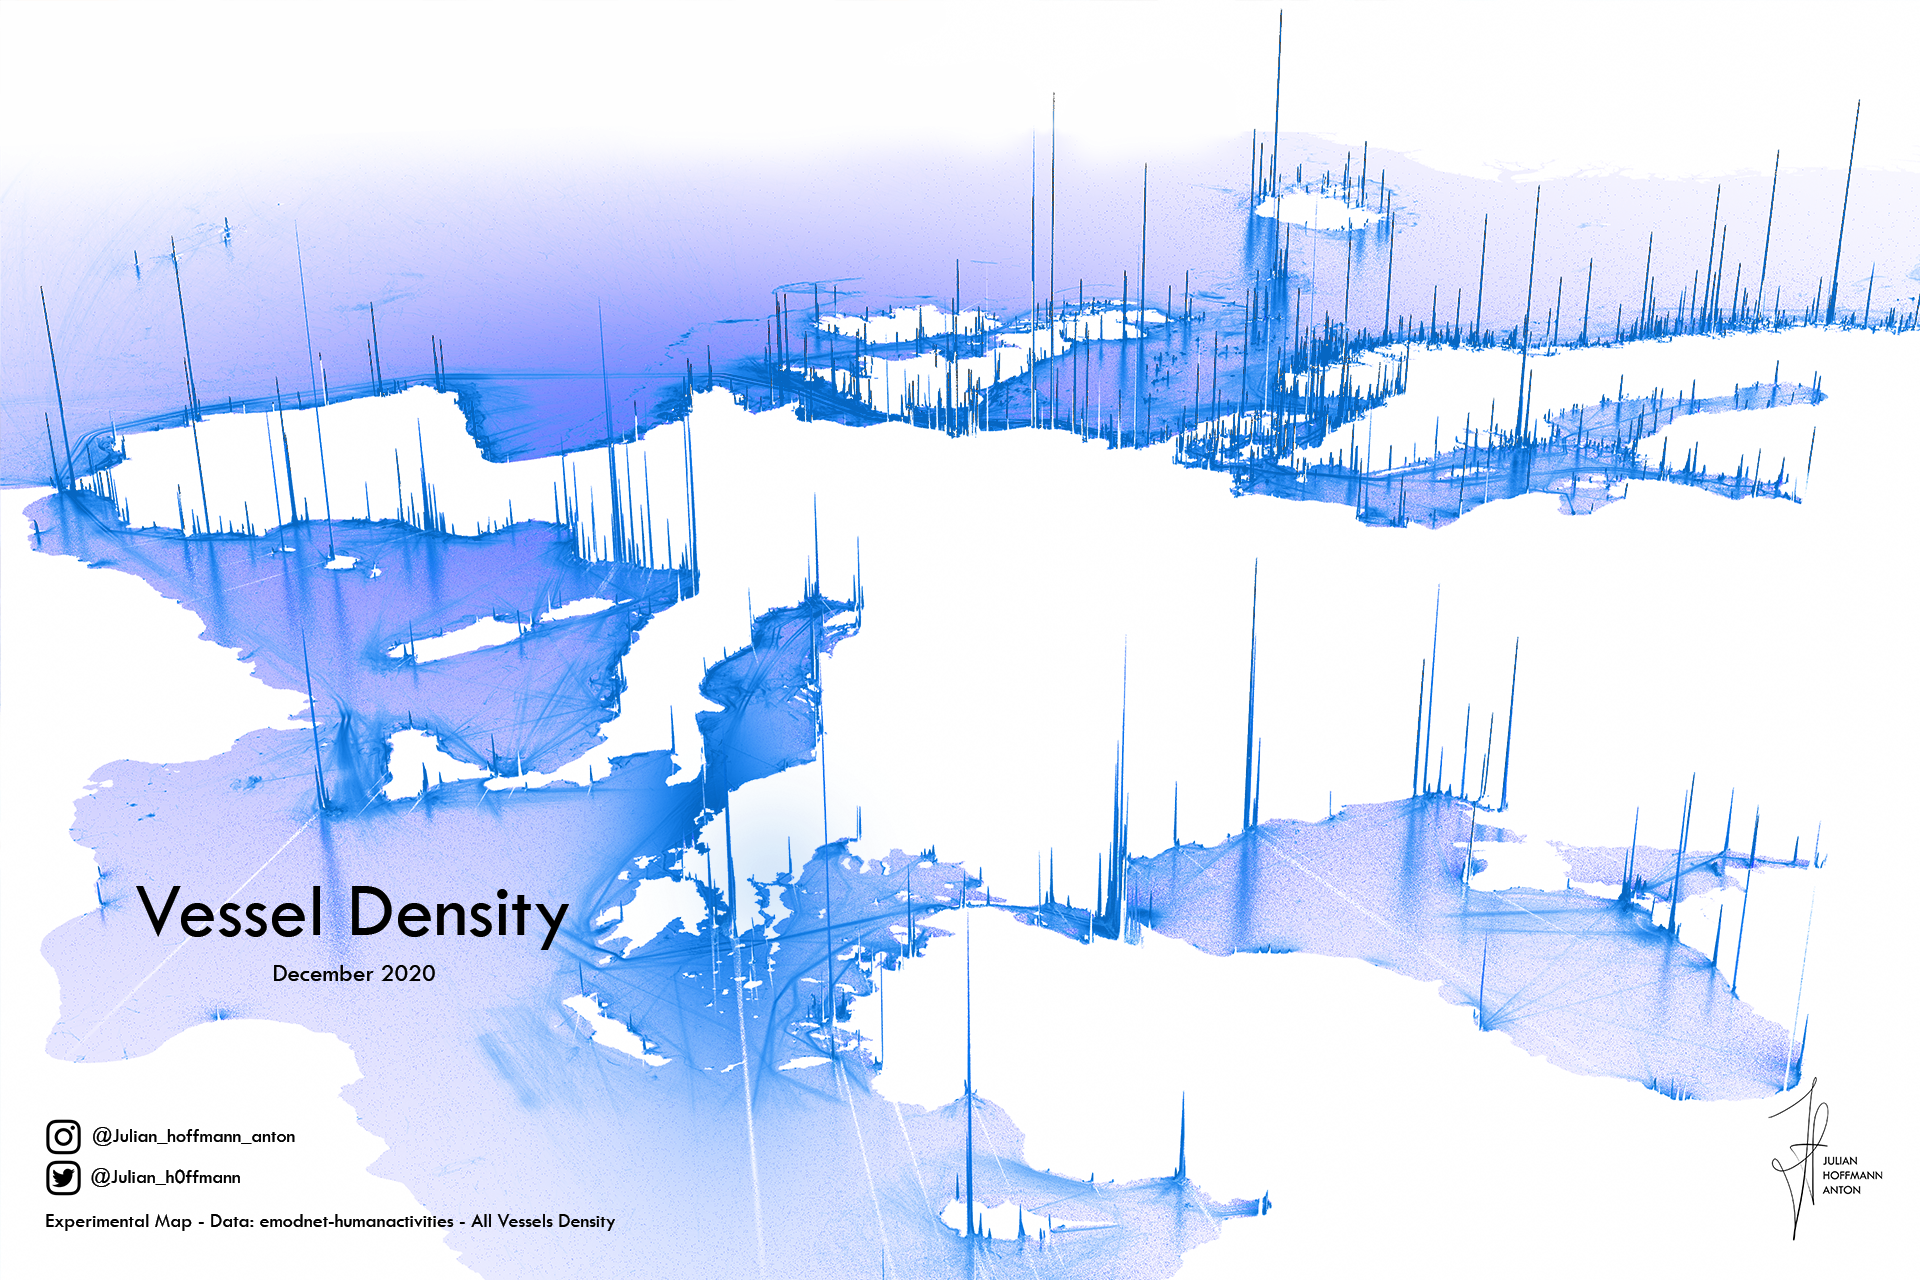
map_day_20_vessels_vJHjh_hd.png
Map_point_world_v8_frame100final_hd.png
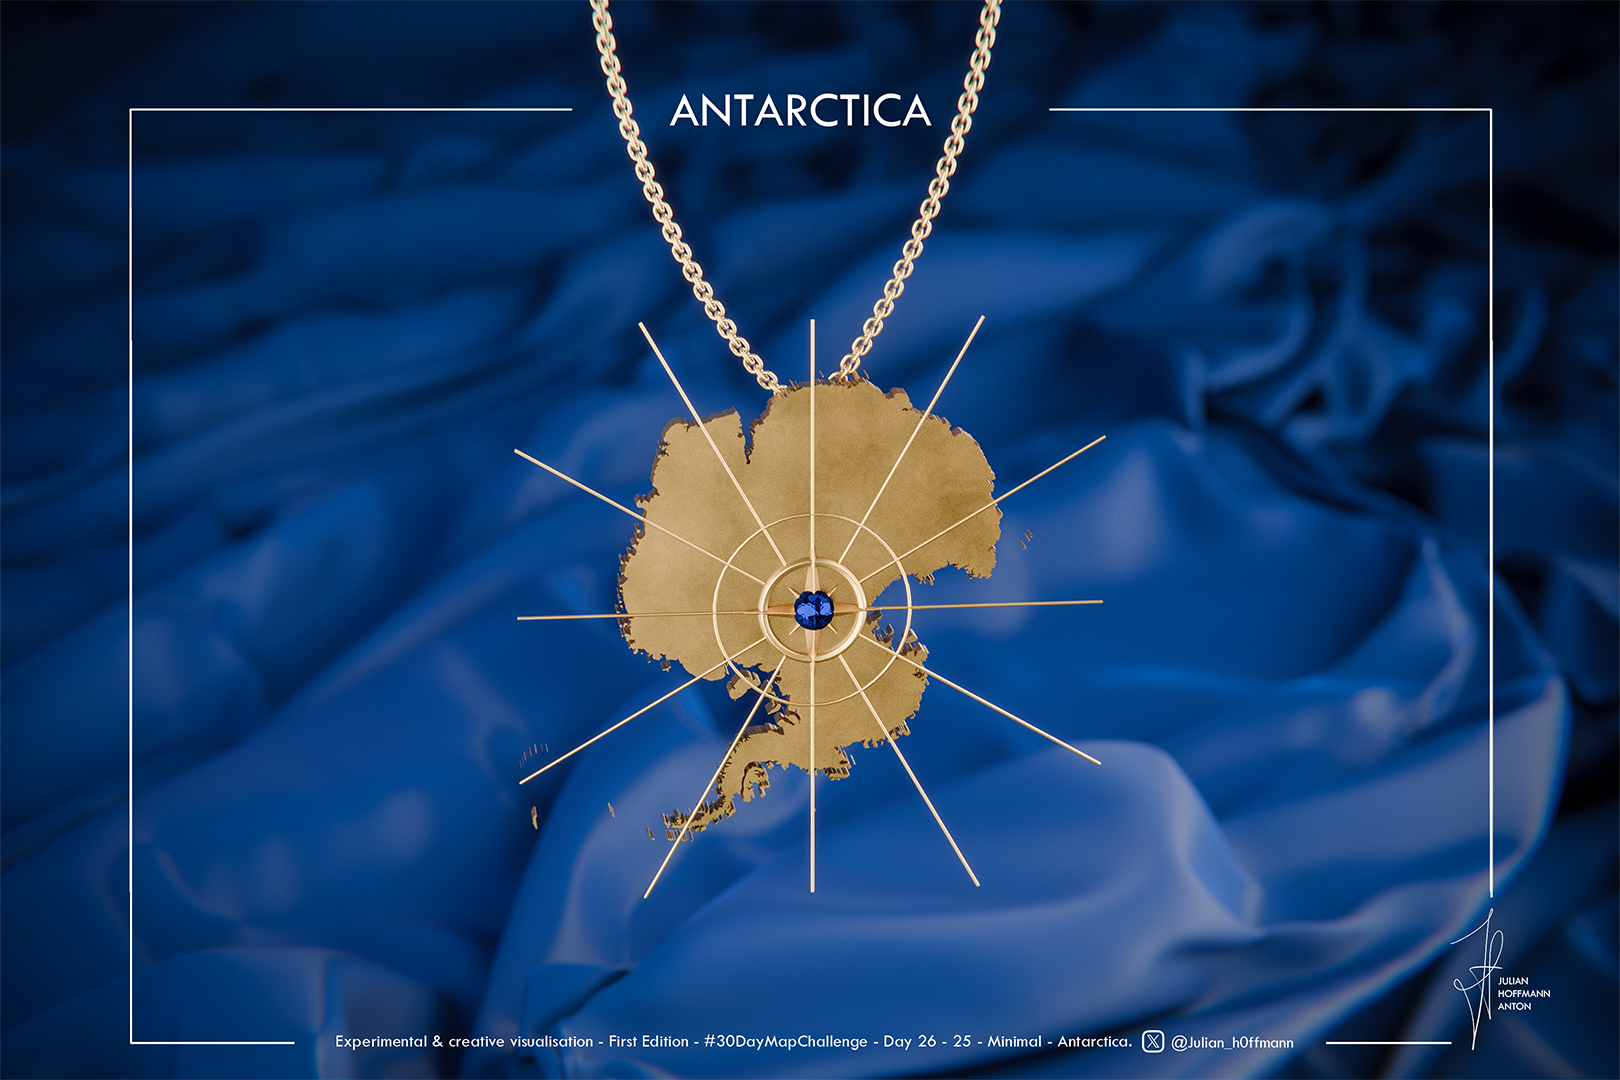
Antarctica_vtwitter_1firstfirst.png
map_day_9_BW_Barcelona_vJH__twitter.png
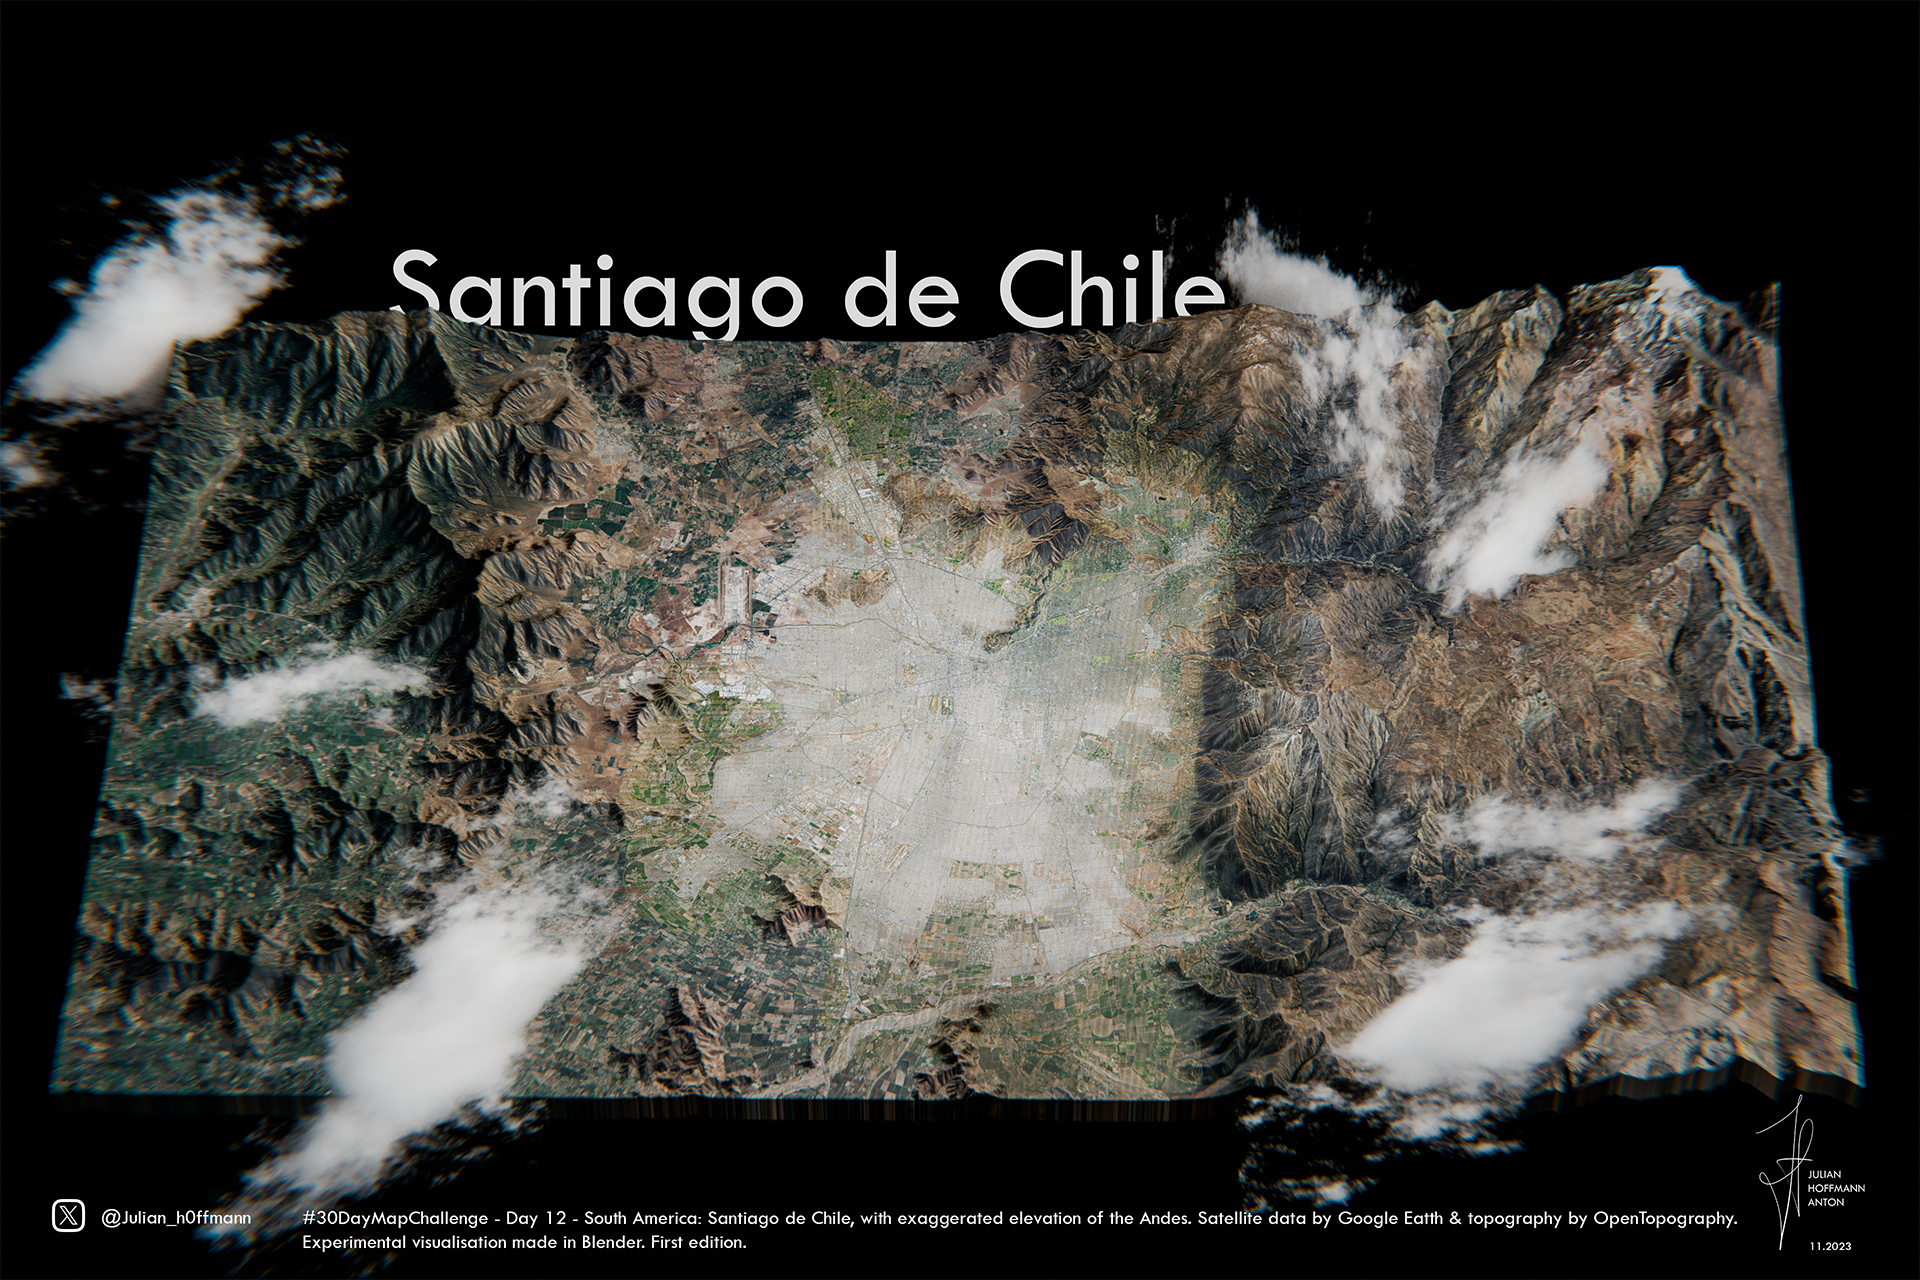
day_12_santiago_1.png
3D London
3D London
Tokyo Lines
Tokyo Lines
map_day_24_historical_vJH_queen_queue_kingv_legend10final_twitte.png
Tokyo Eat Map BTS
Tokyo Eat Map BTS
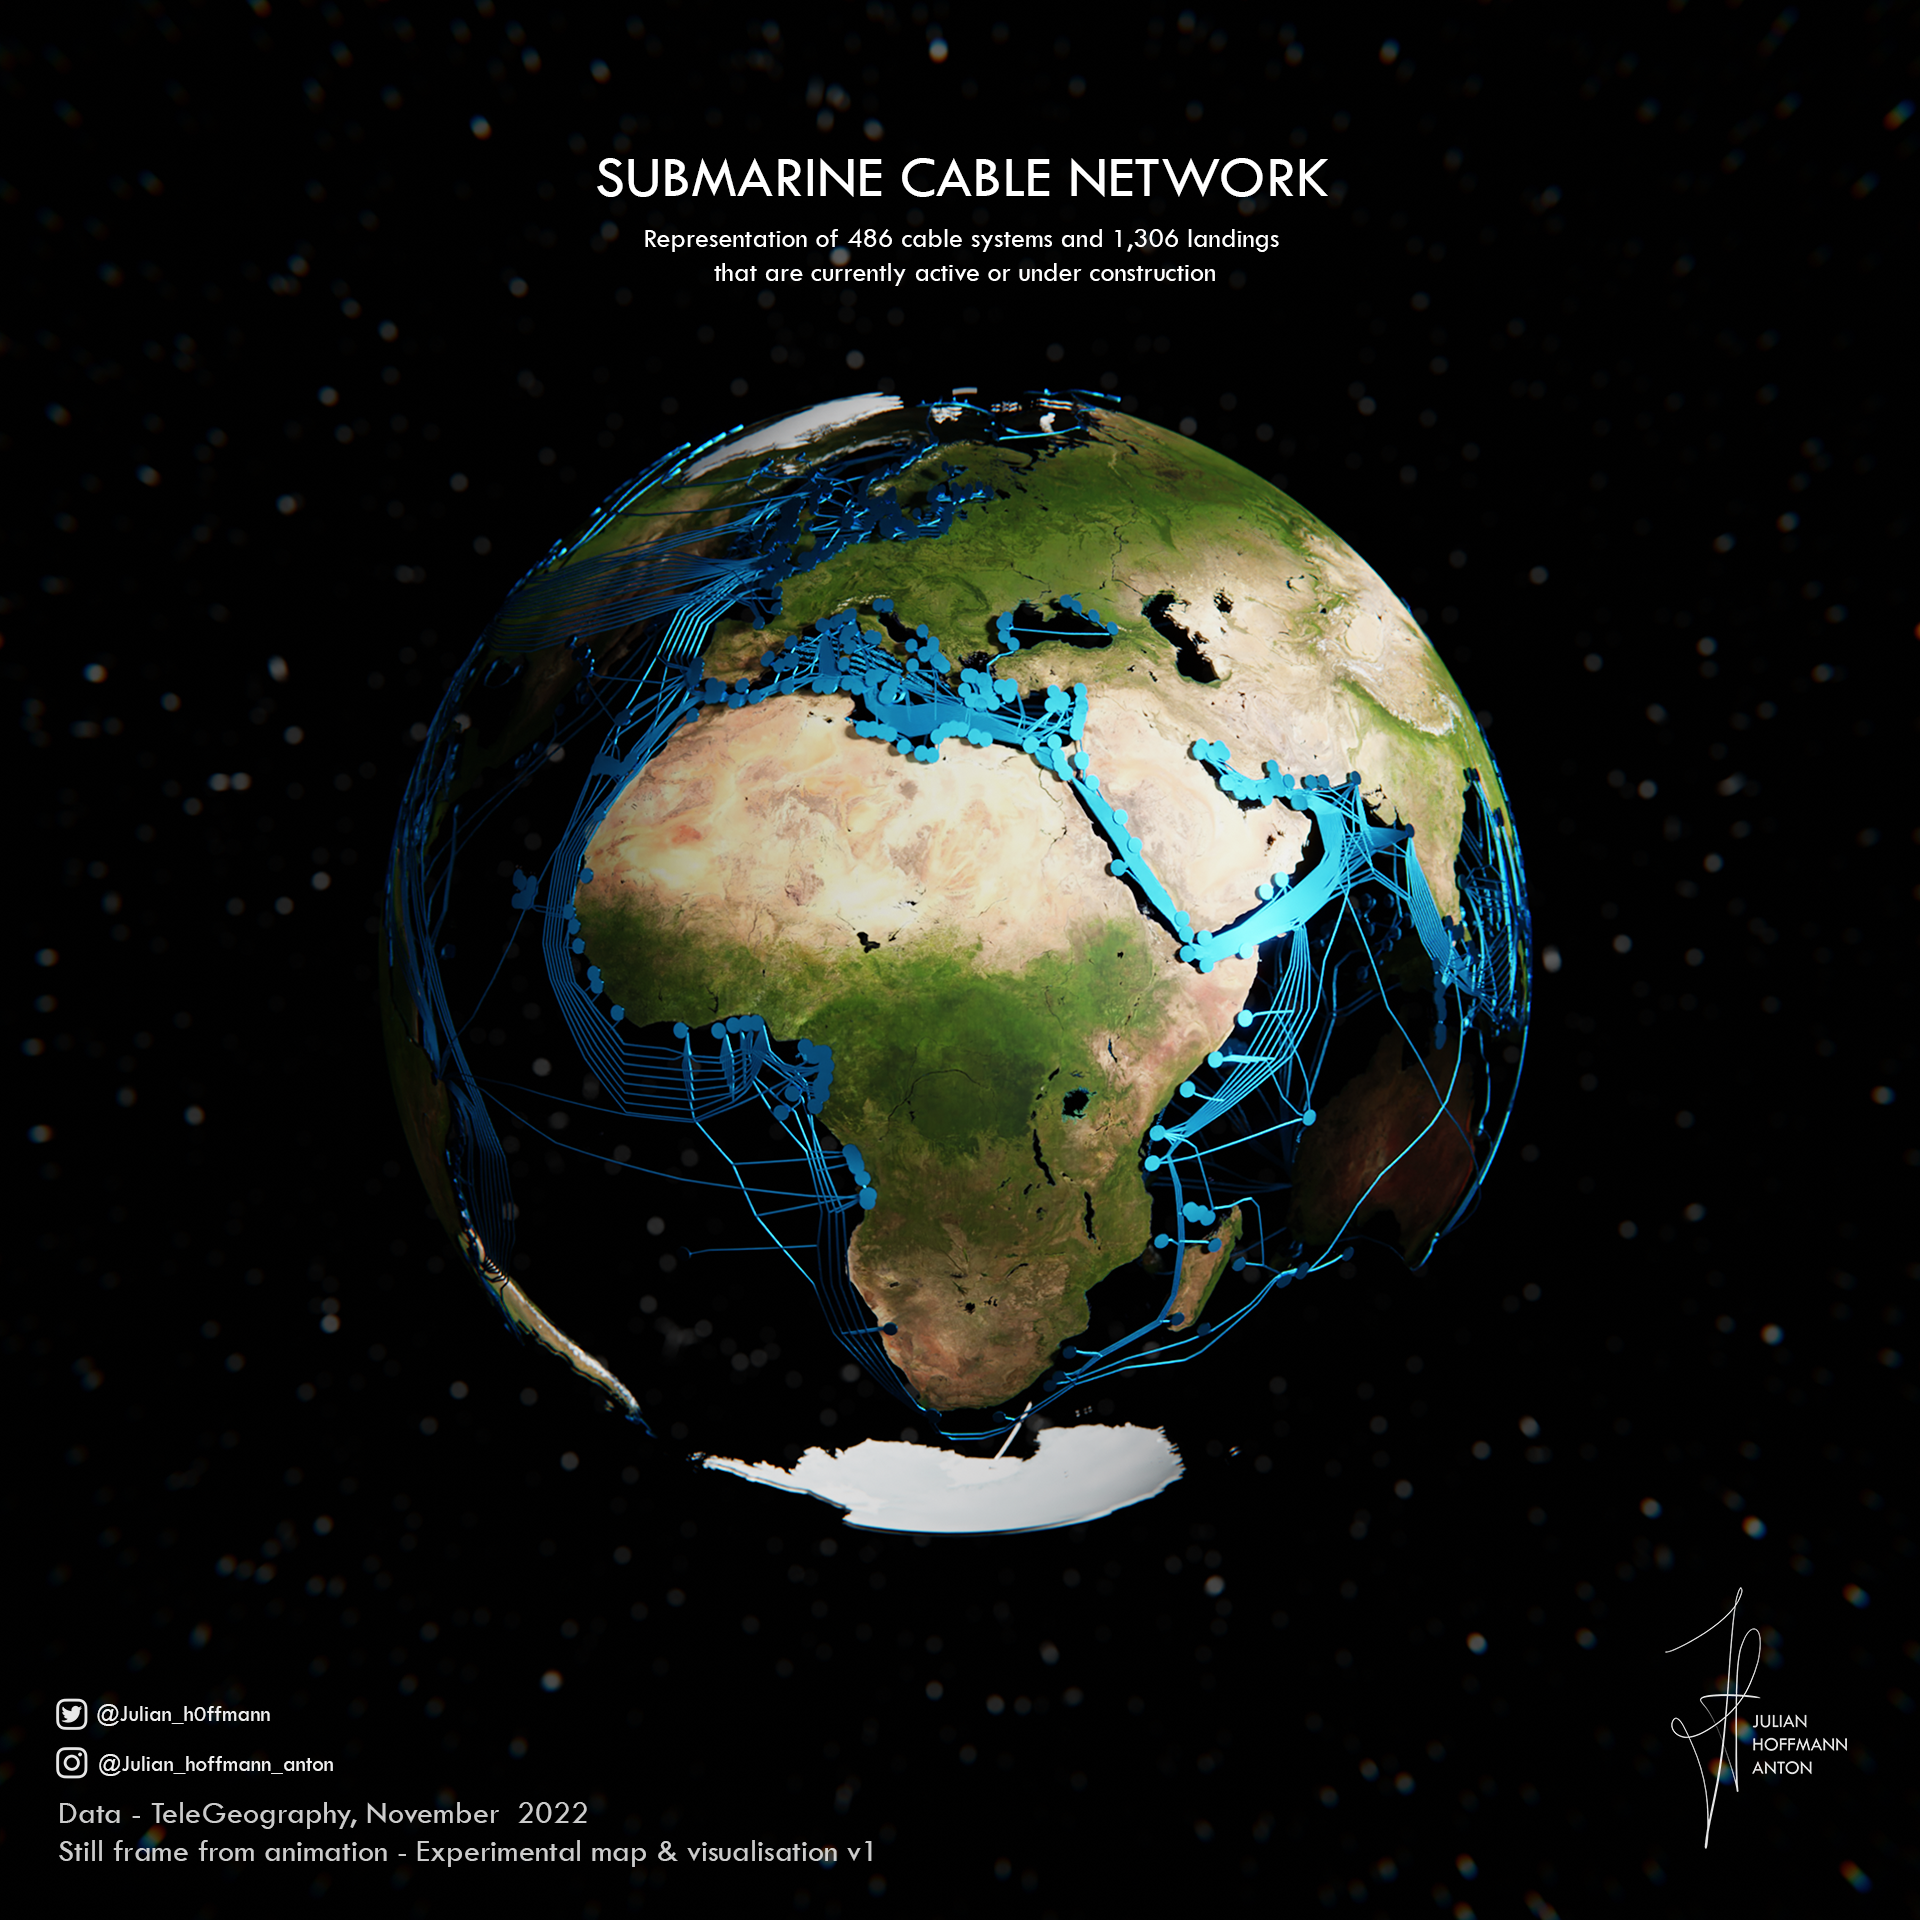
map_internet_network_template_CBvgeneral.png
map_21_elevation_switzerland_v4b_hs_b3.0_animation_8_4_loop_thumbnail.png
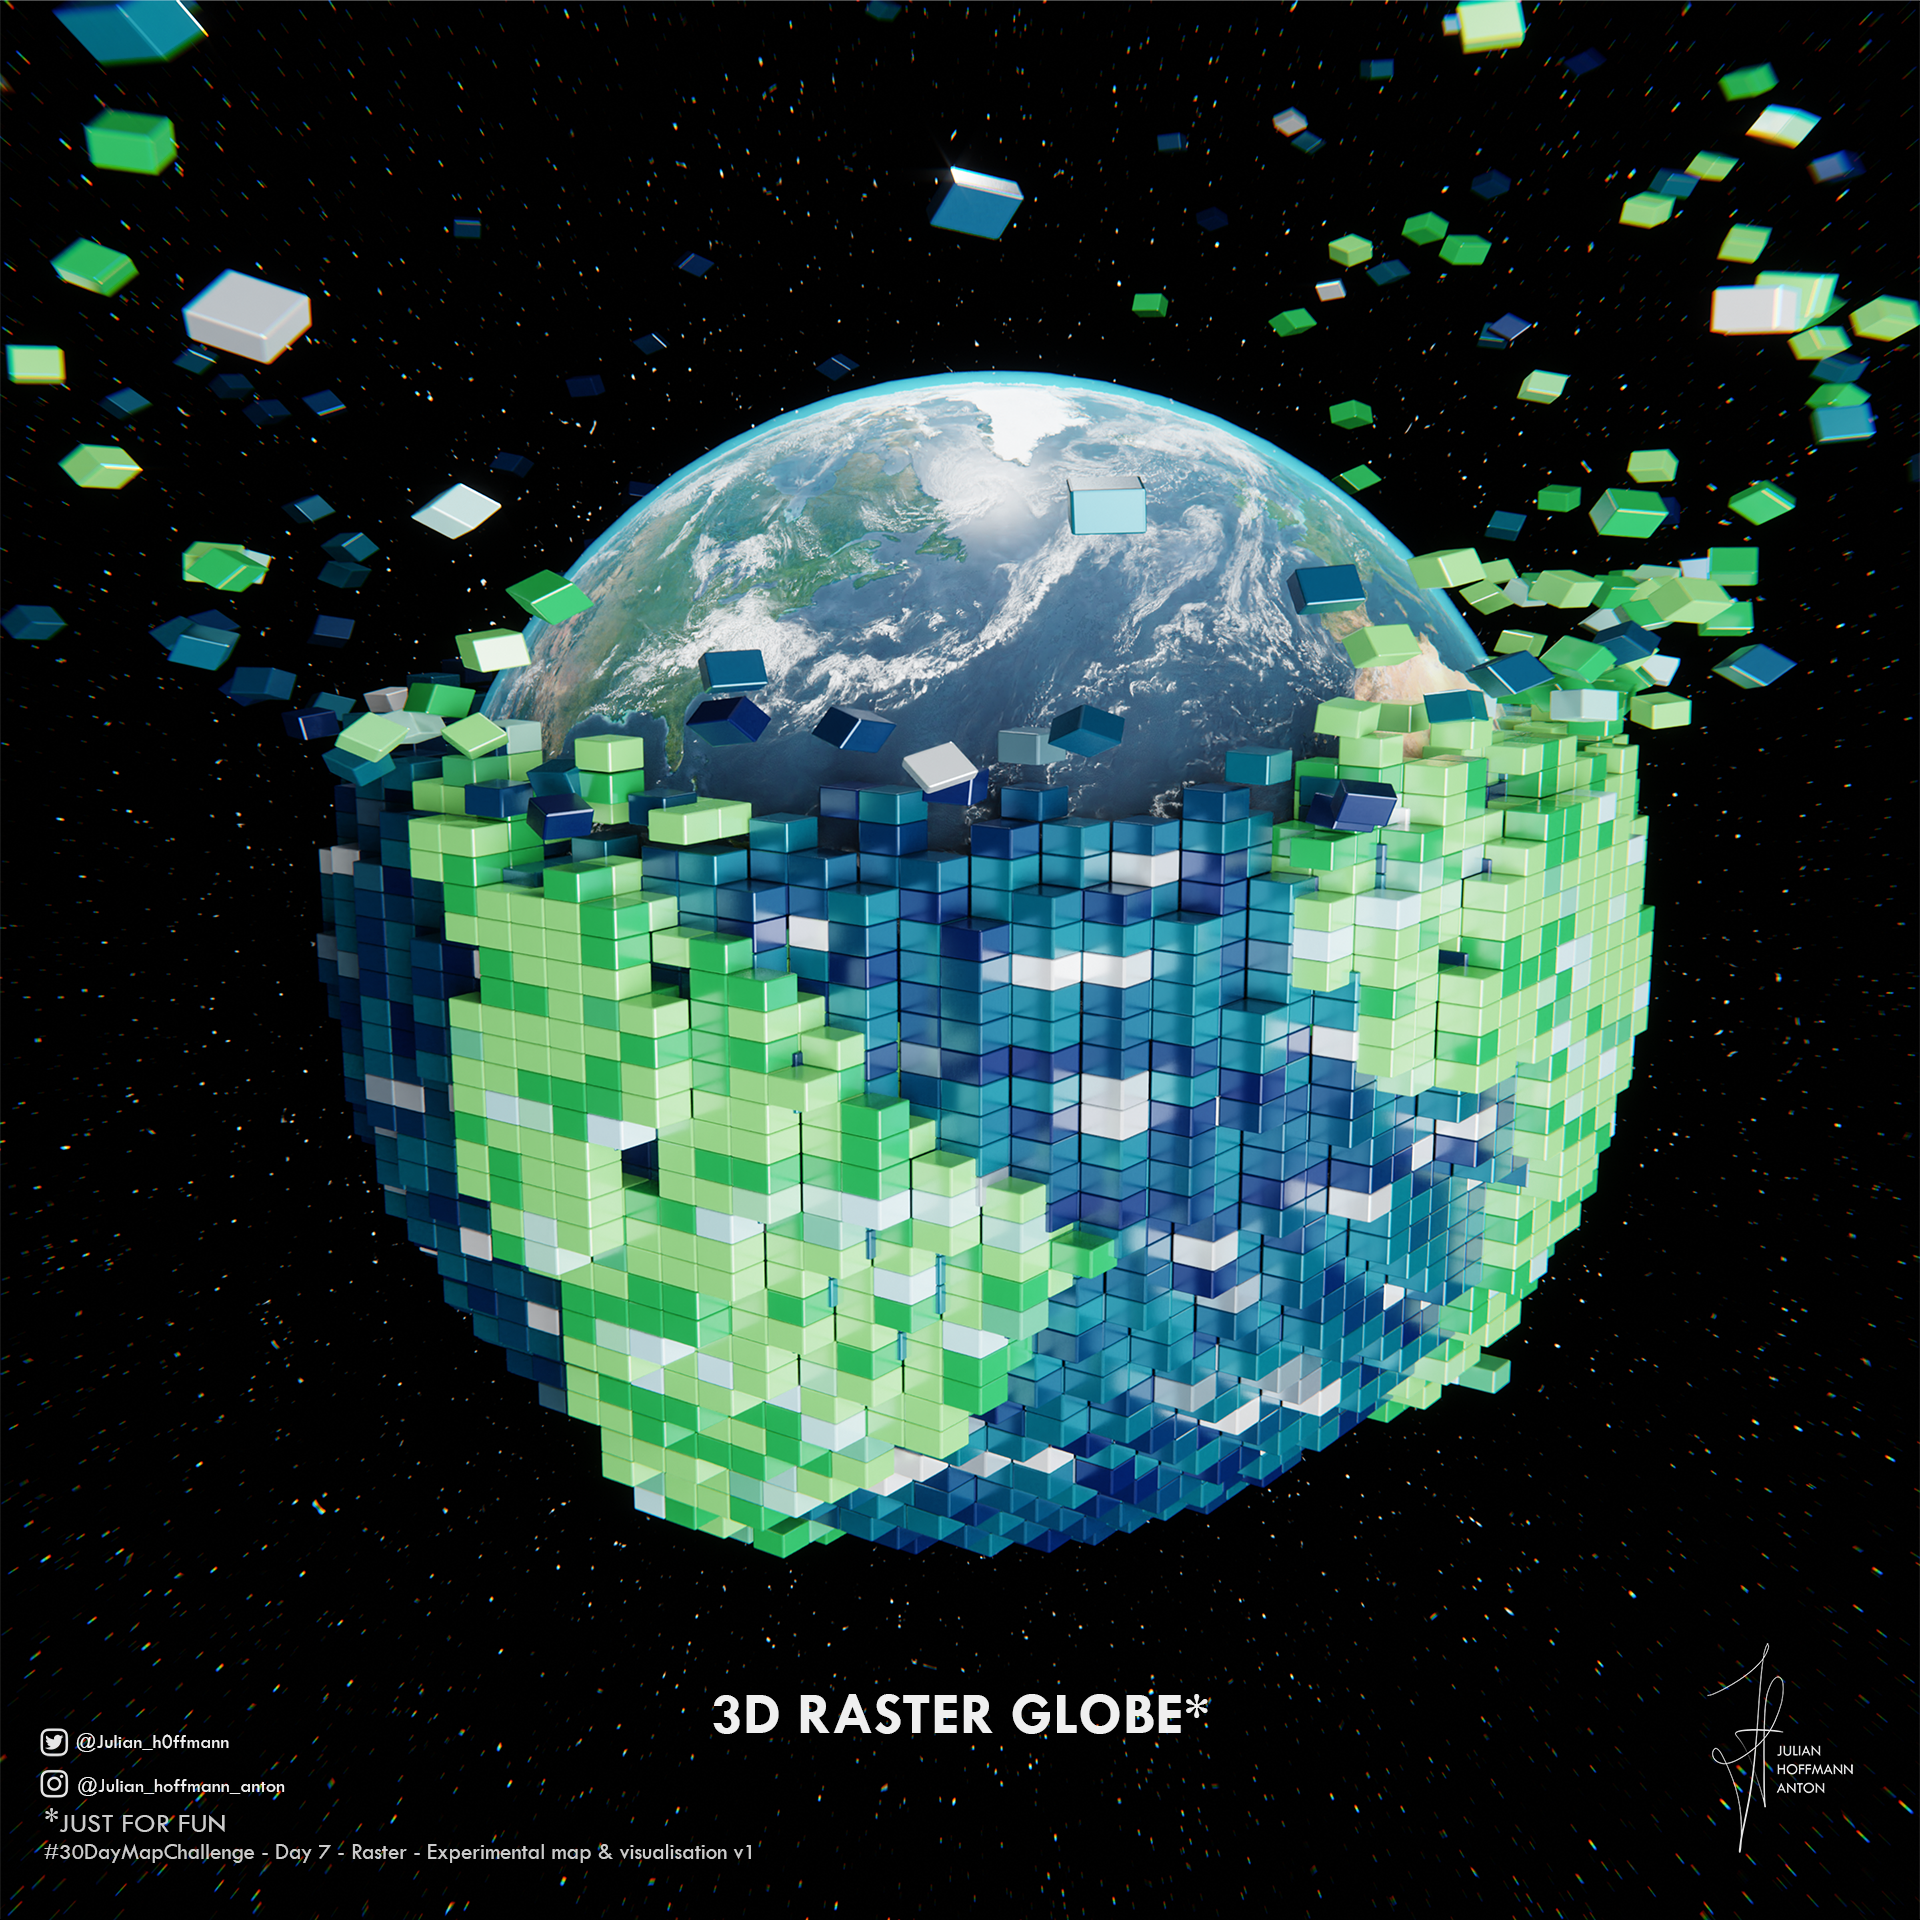
3d raster earth -v3 twitter labelstwitter.png
Polynesian Polygons
Polynesian Polygons
newborn_globe_v24.png
map_day_9_monochrome_vJH__HD_vzoom.png
map_day_6_RED_vJH_HD_CB_corre.png
Chile Pre Fossilisation
map_day_21_Nile_vJH_testjh_hd_v2.png
From points to map
From points to mapGolden sand
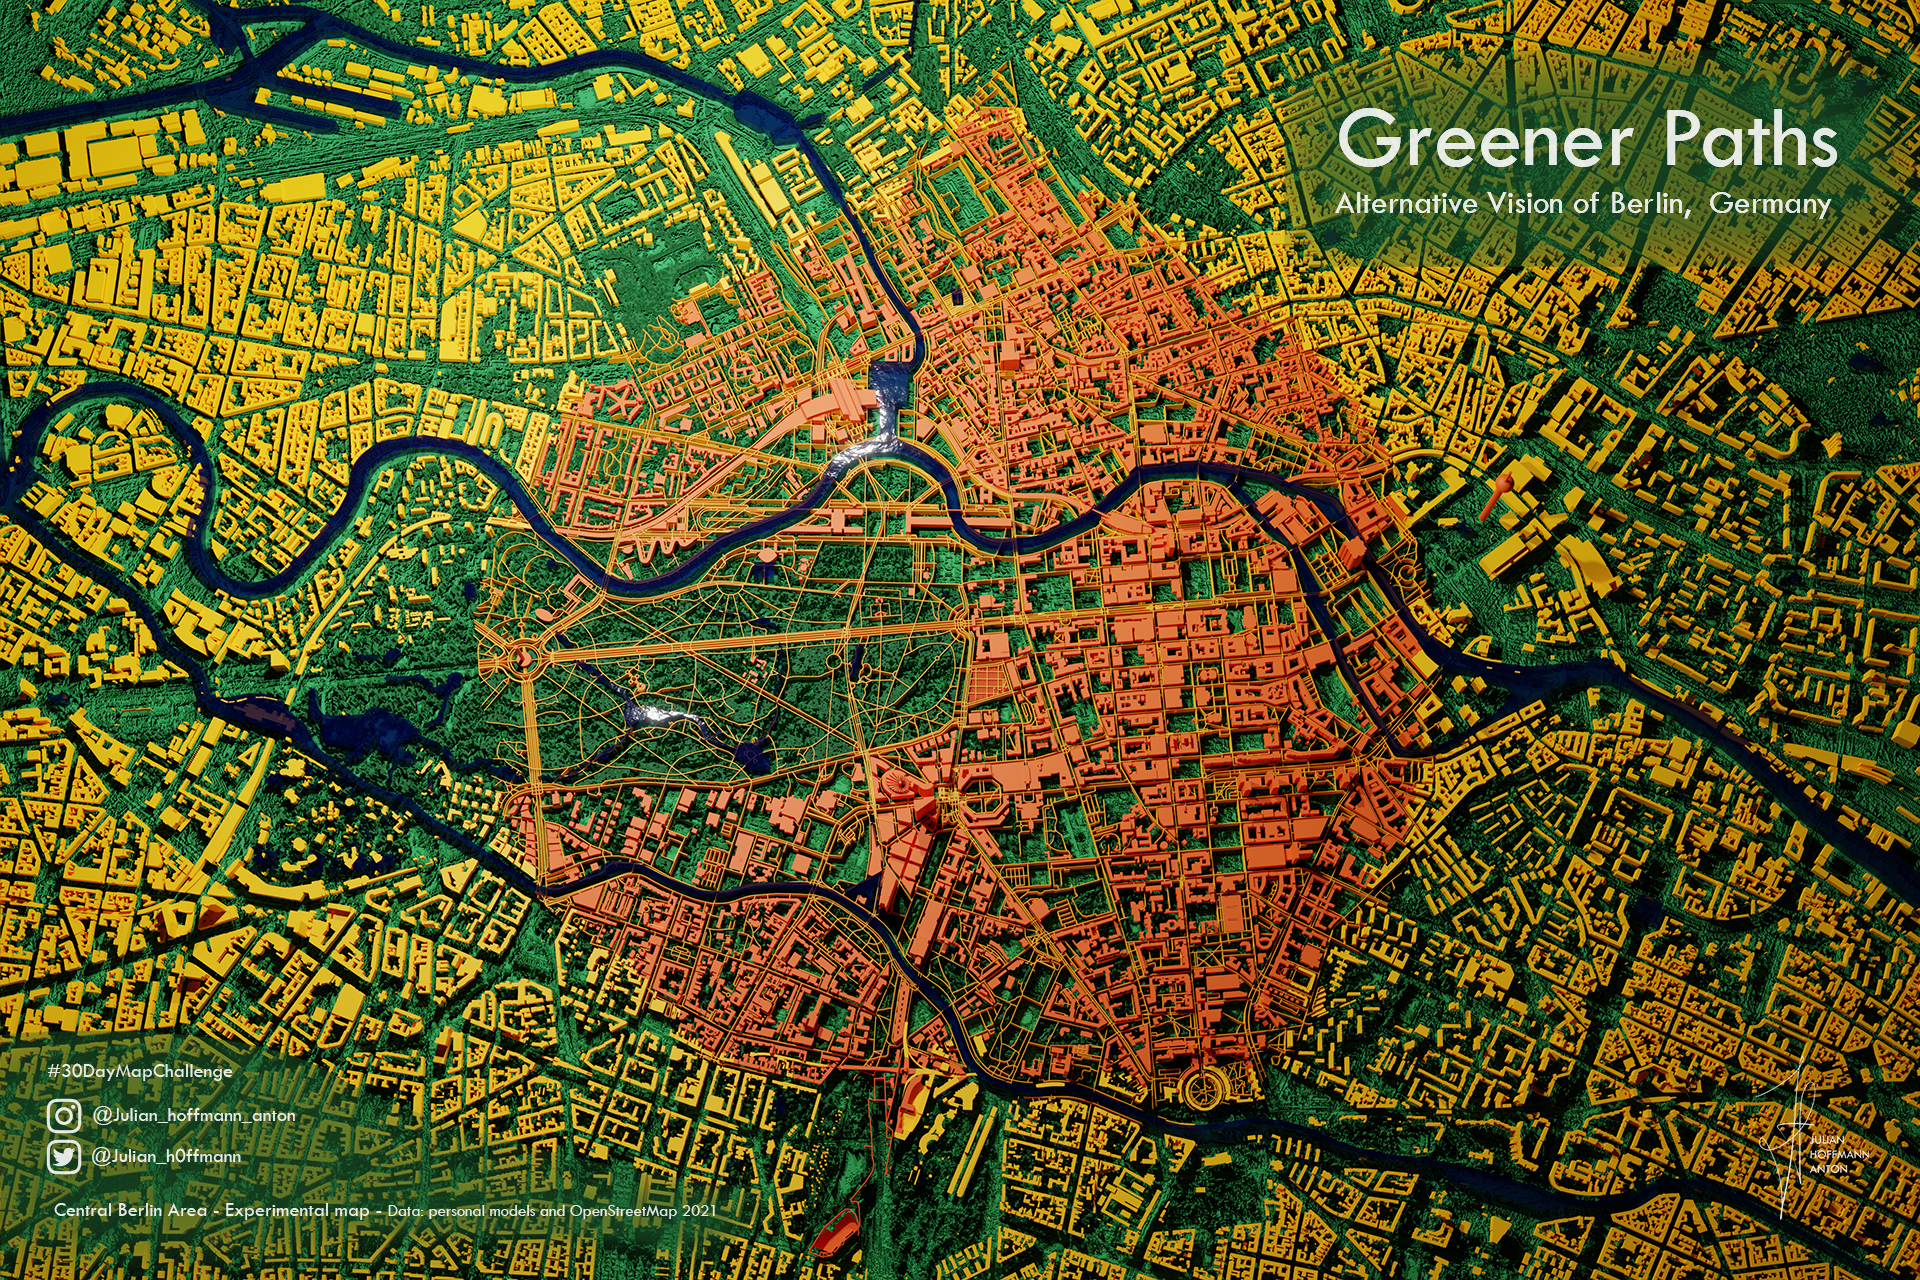
Testing Greener Worlds
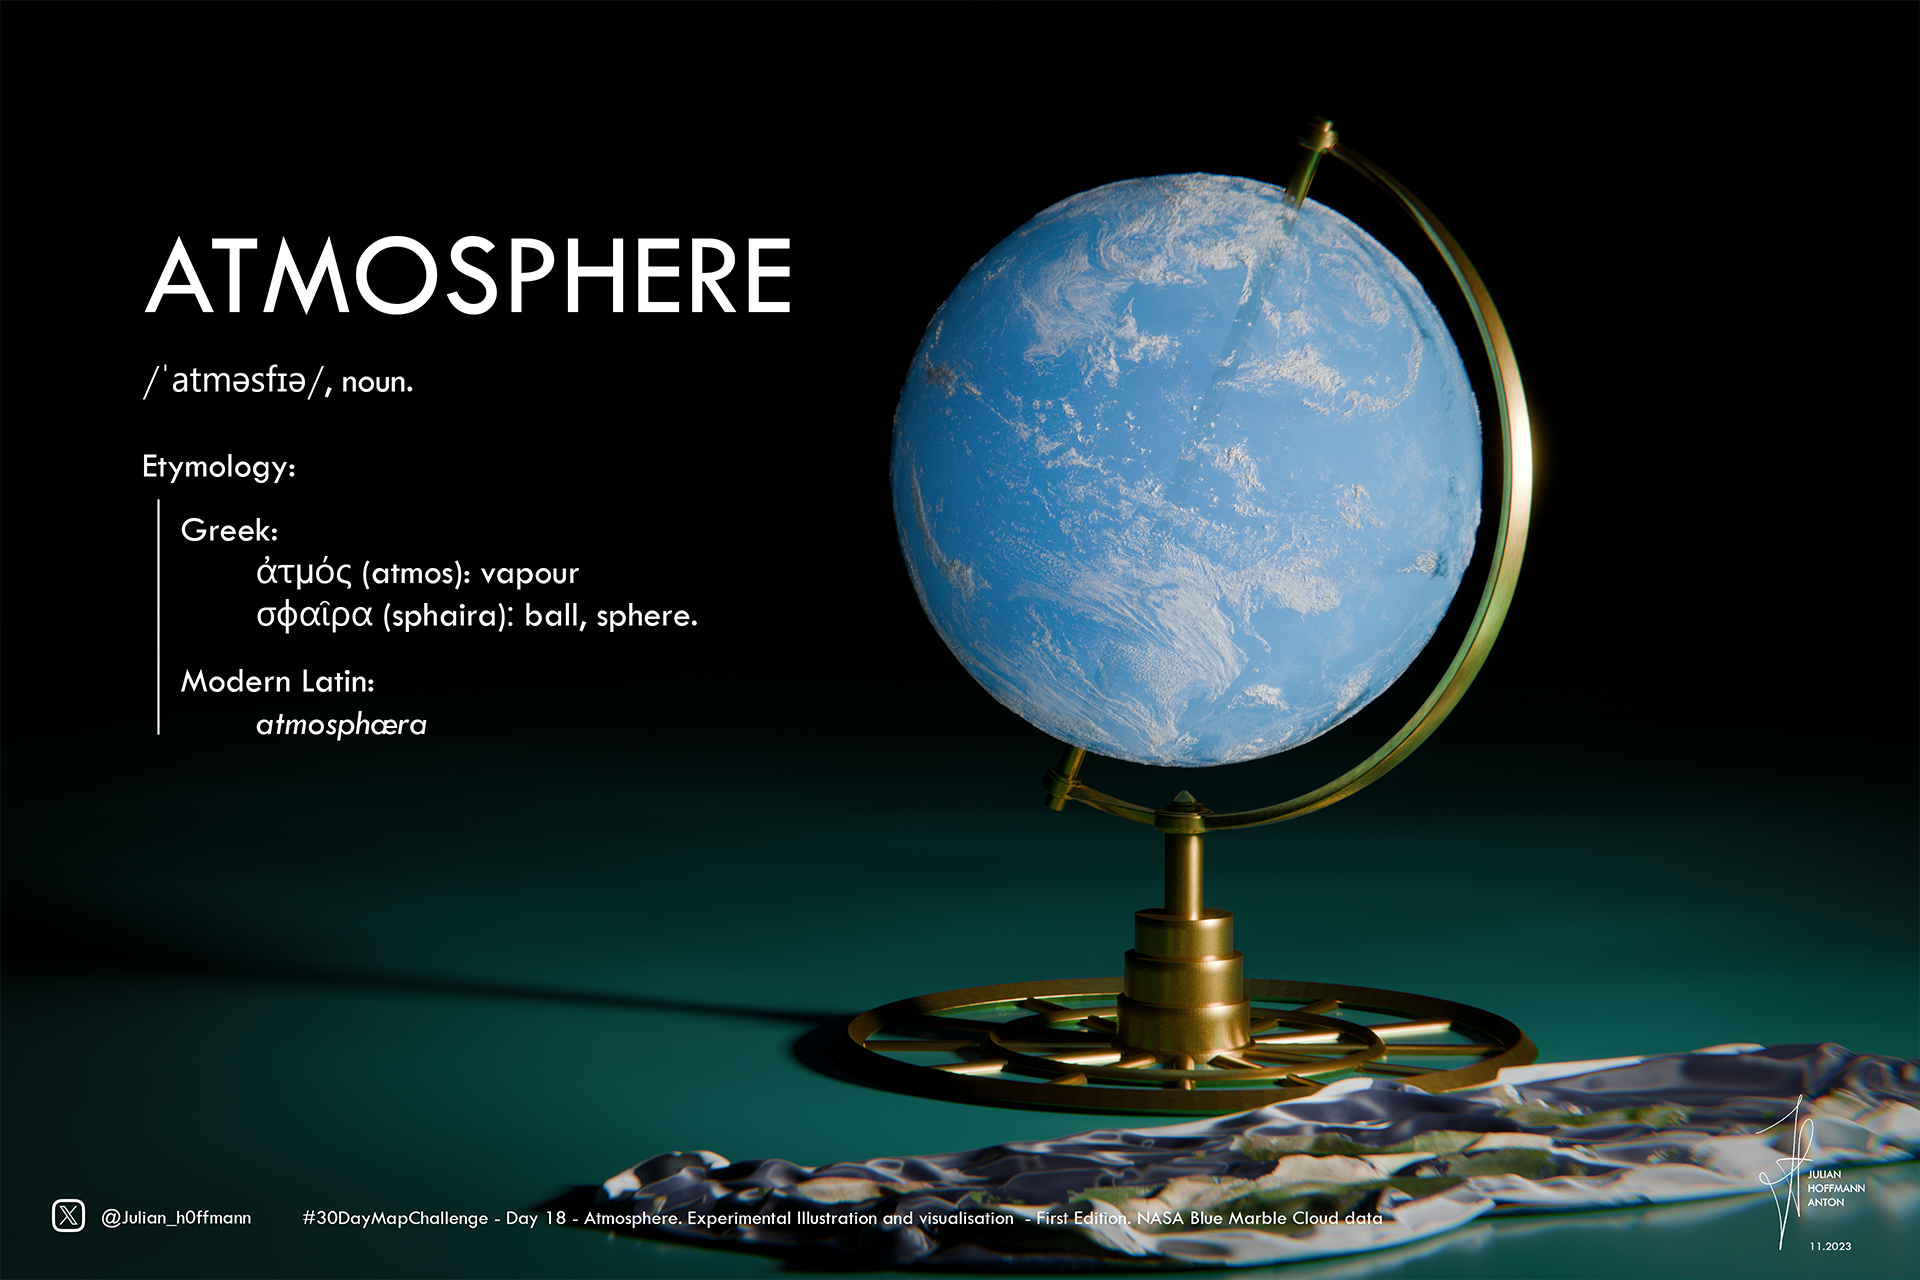
day_18_Atmospheretwitter.png
newborn_globe_v26_linkedin.jpg
Tokyo Lines (BTS)
Tokyo Lines (BTS)
map_blue_labelshd_twitter3b.png
map_day_21_elevation_vJHjh_hd.png
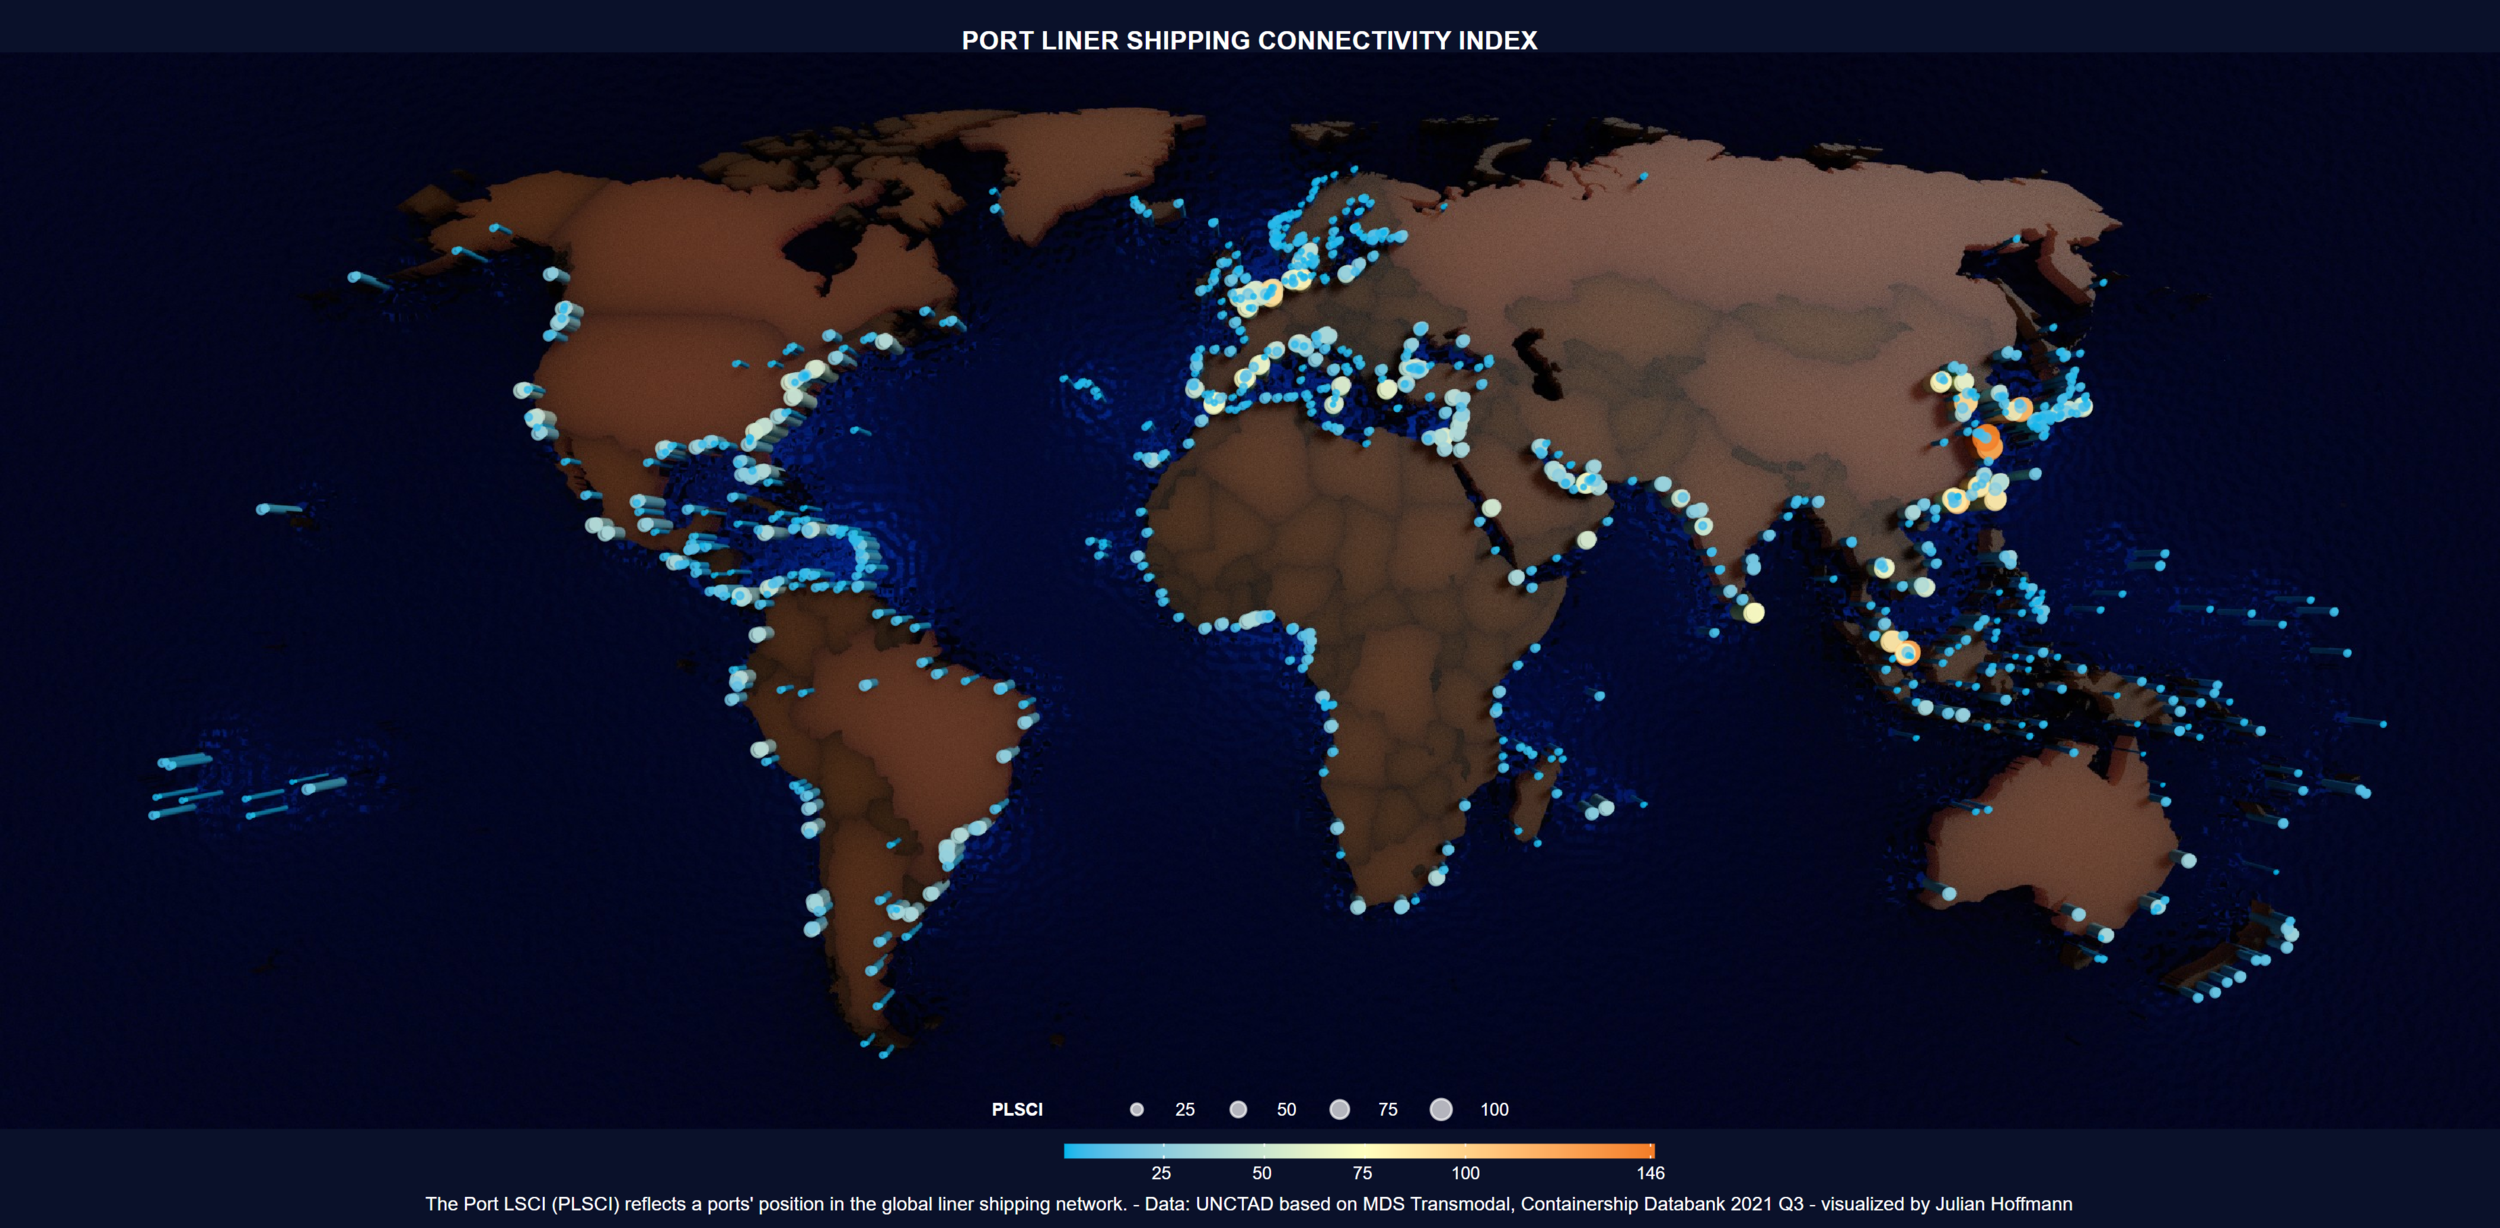
Ports in the global liner shipping network
Ports in the global liner shipping networkPorts in the global liner shipping network: Understanding their position, connectivity, and changes over time. New UNCTAD article by father and son Jan Hoffmann and Julian Hoffmann with data from MDS TRANSMODAL LIMITED. https://lnkd.in/depPGRB
Café à Paris
Café à Paris
world_grid_v2_1920_twitter.png
map_day_20_vessels_vJHjh_hd_vc.png
map_day_16_urban_vs_rural_mv6_jh.png
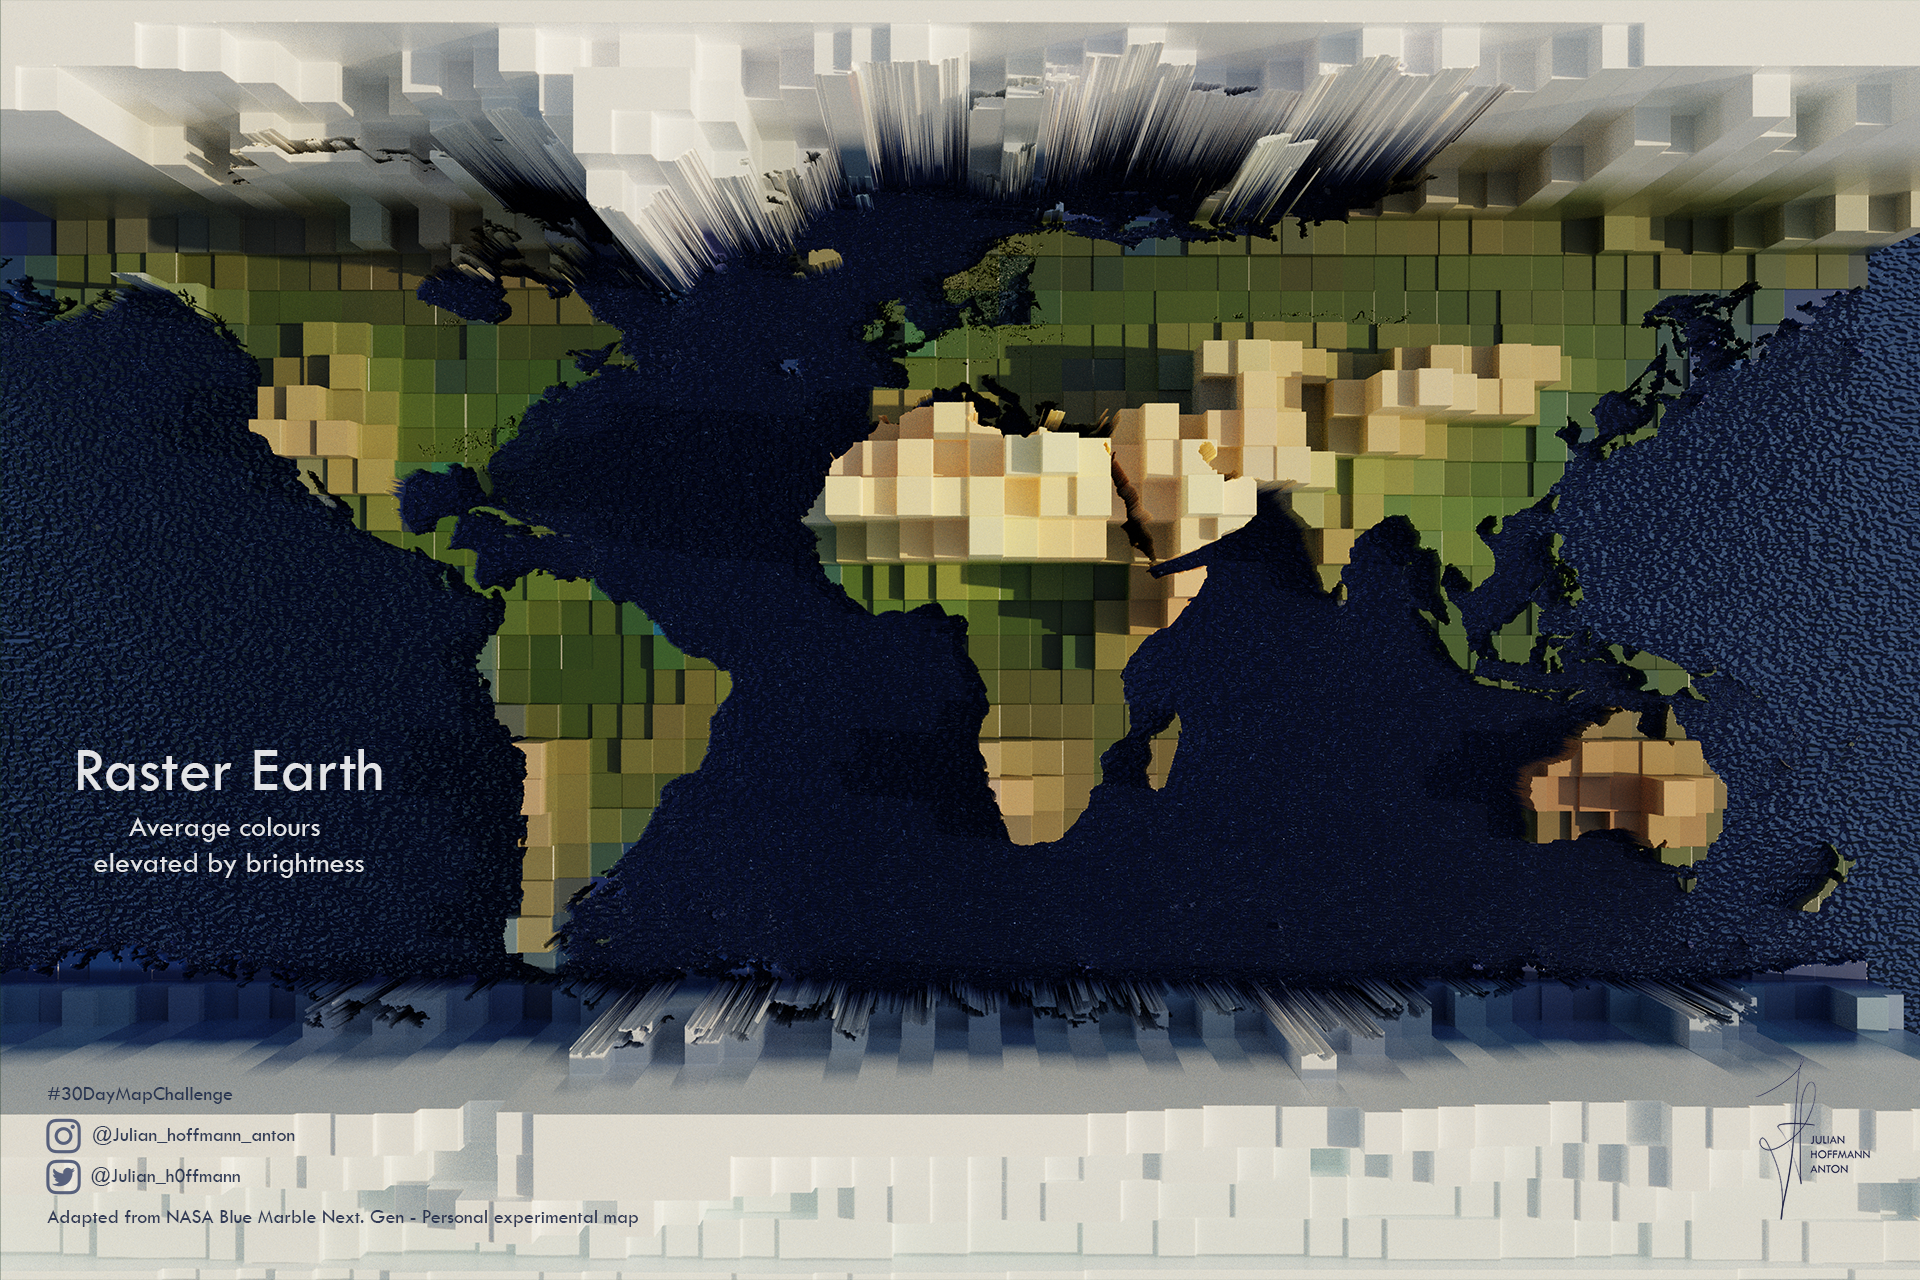
Raster Earth
Raster Earth
Behind the Scenes
Behind the Scenes
Containership port calls during the first 31 weeks of 2020 compared to the same period in 2019Full Article: https://unctad.org/en/pages/newsdetails.aspx?OriginalVersionID=2465
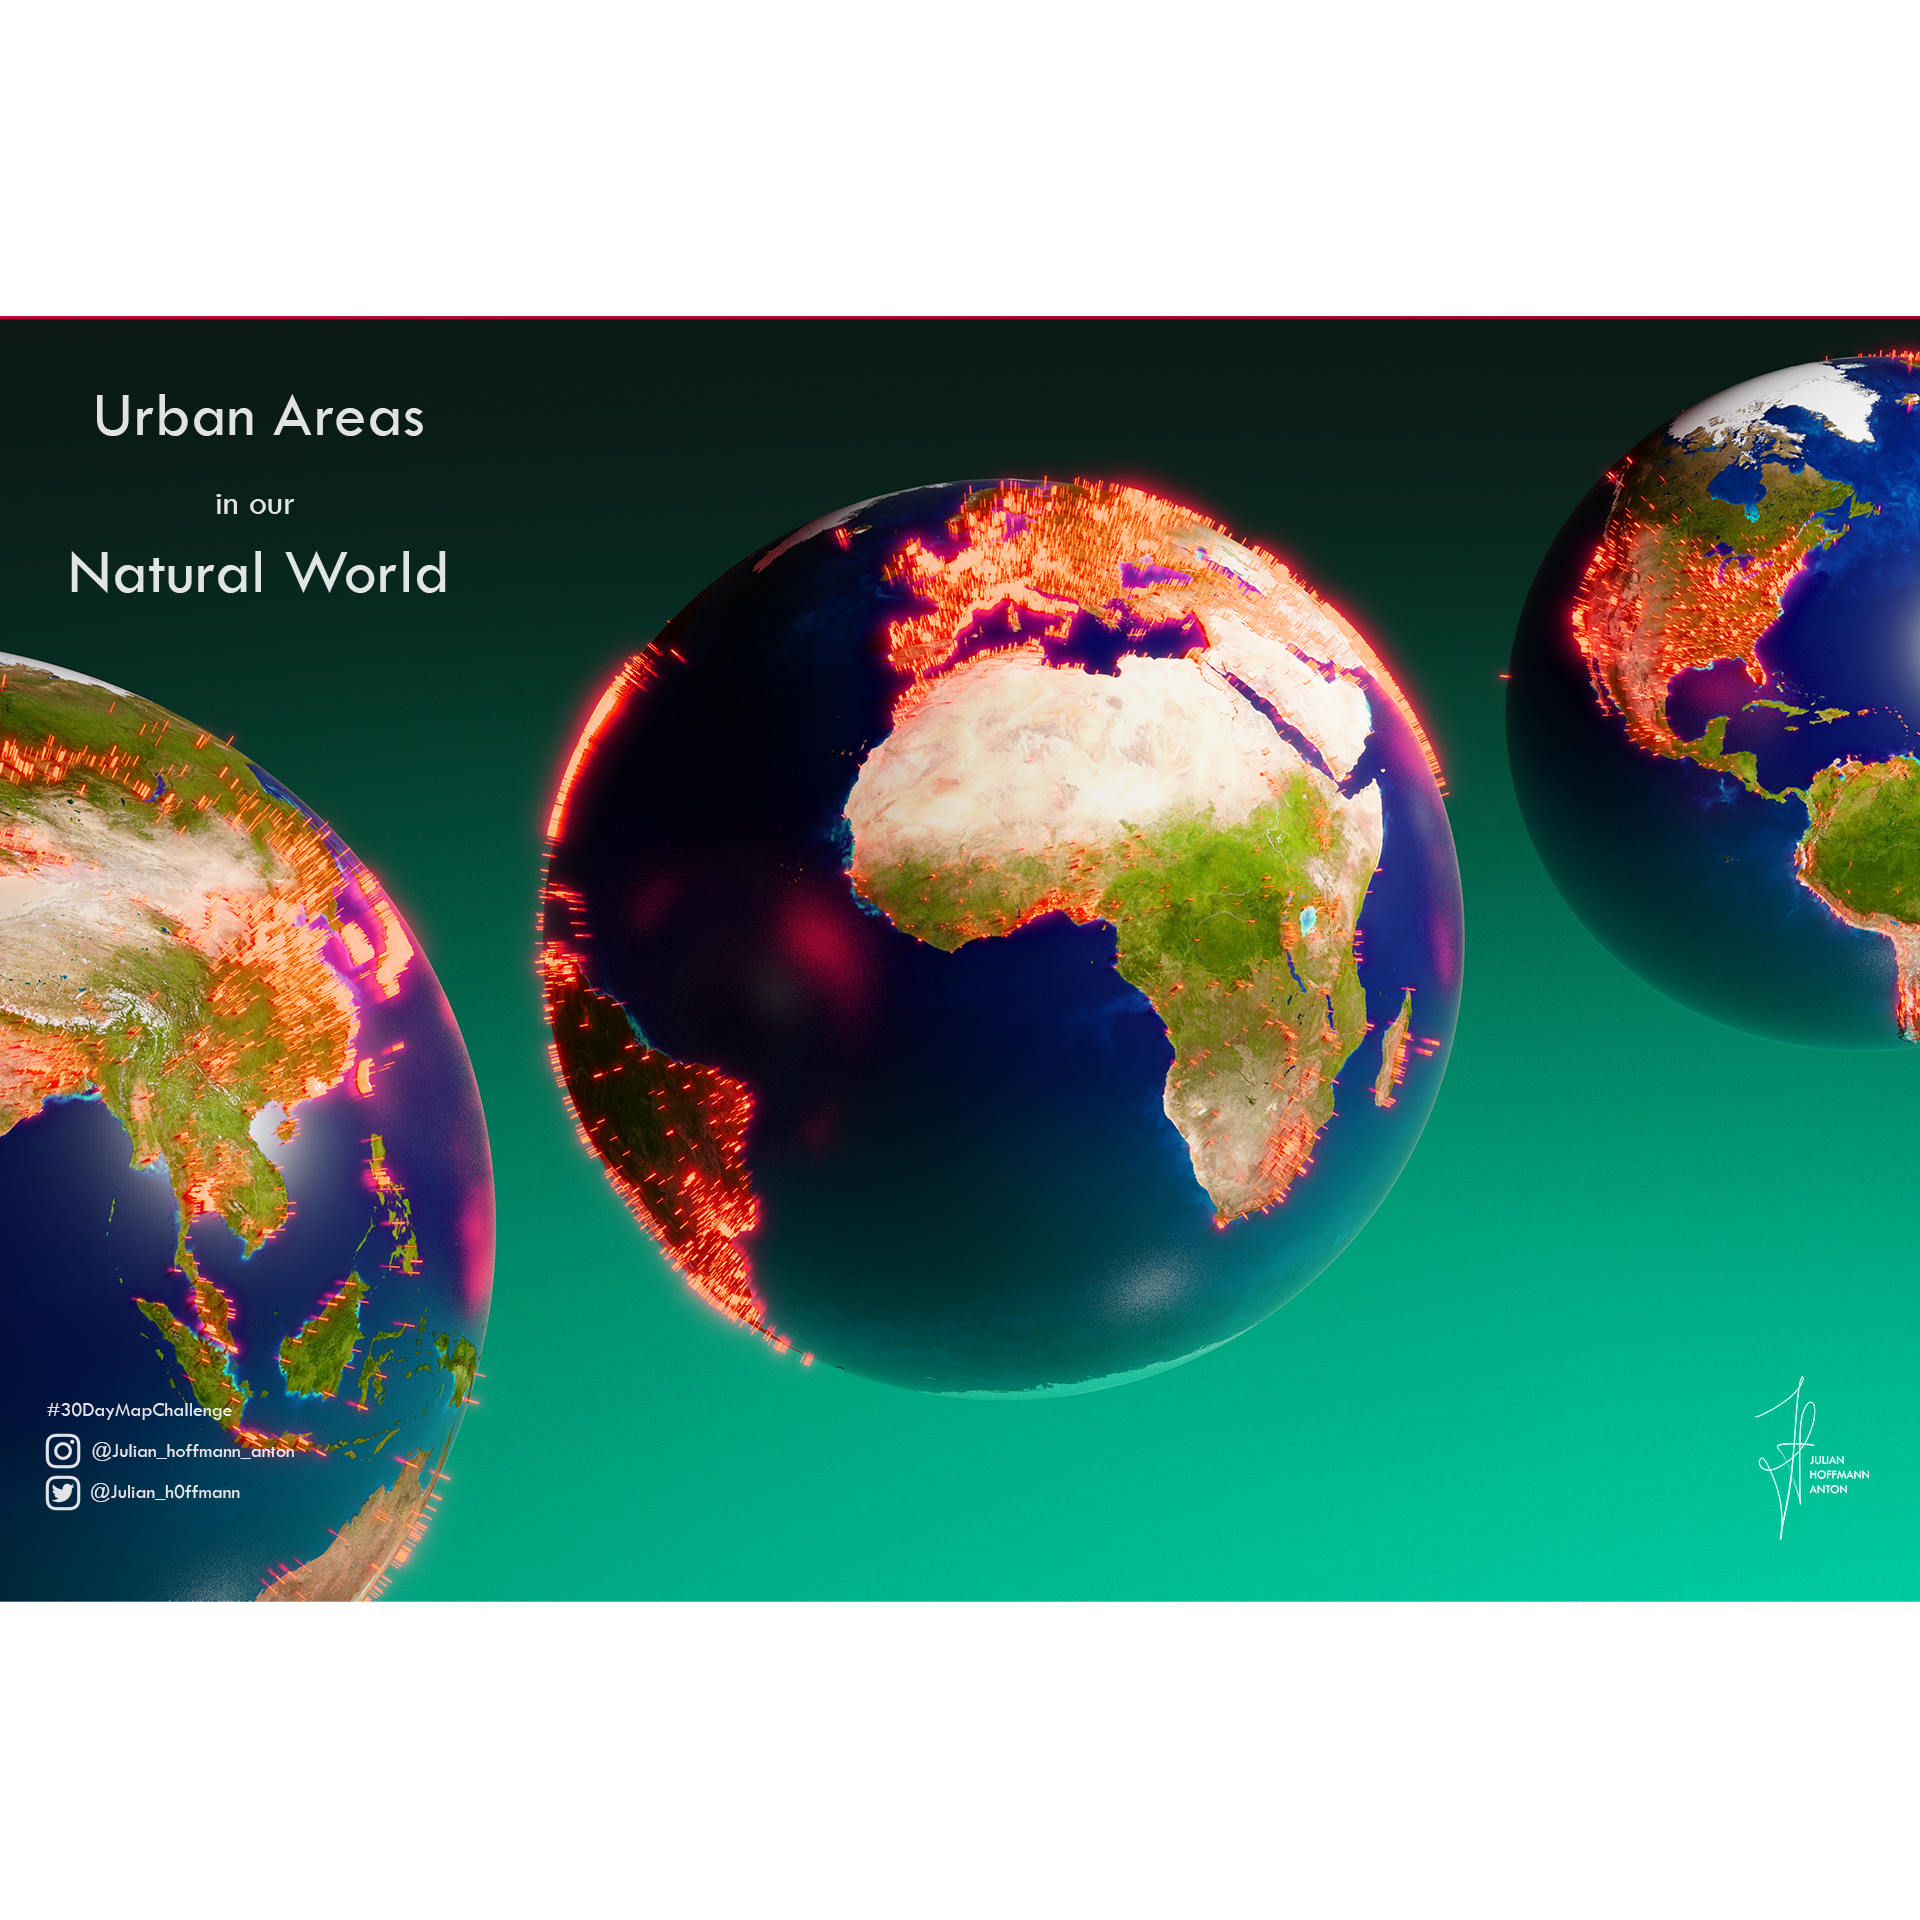
Urban World
Urban World
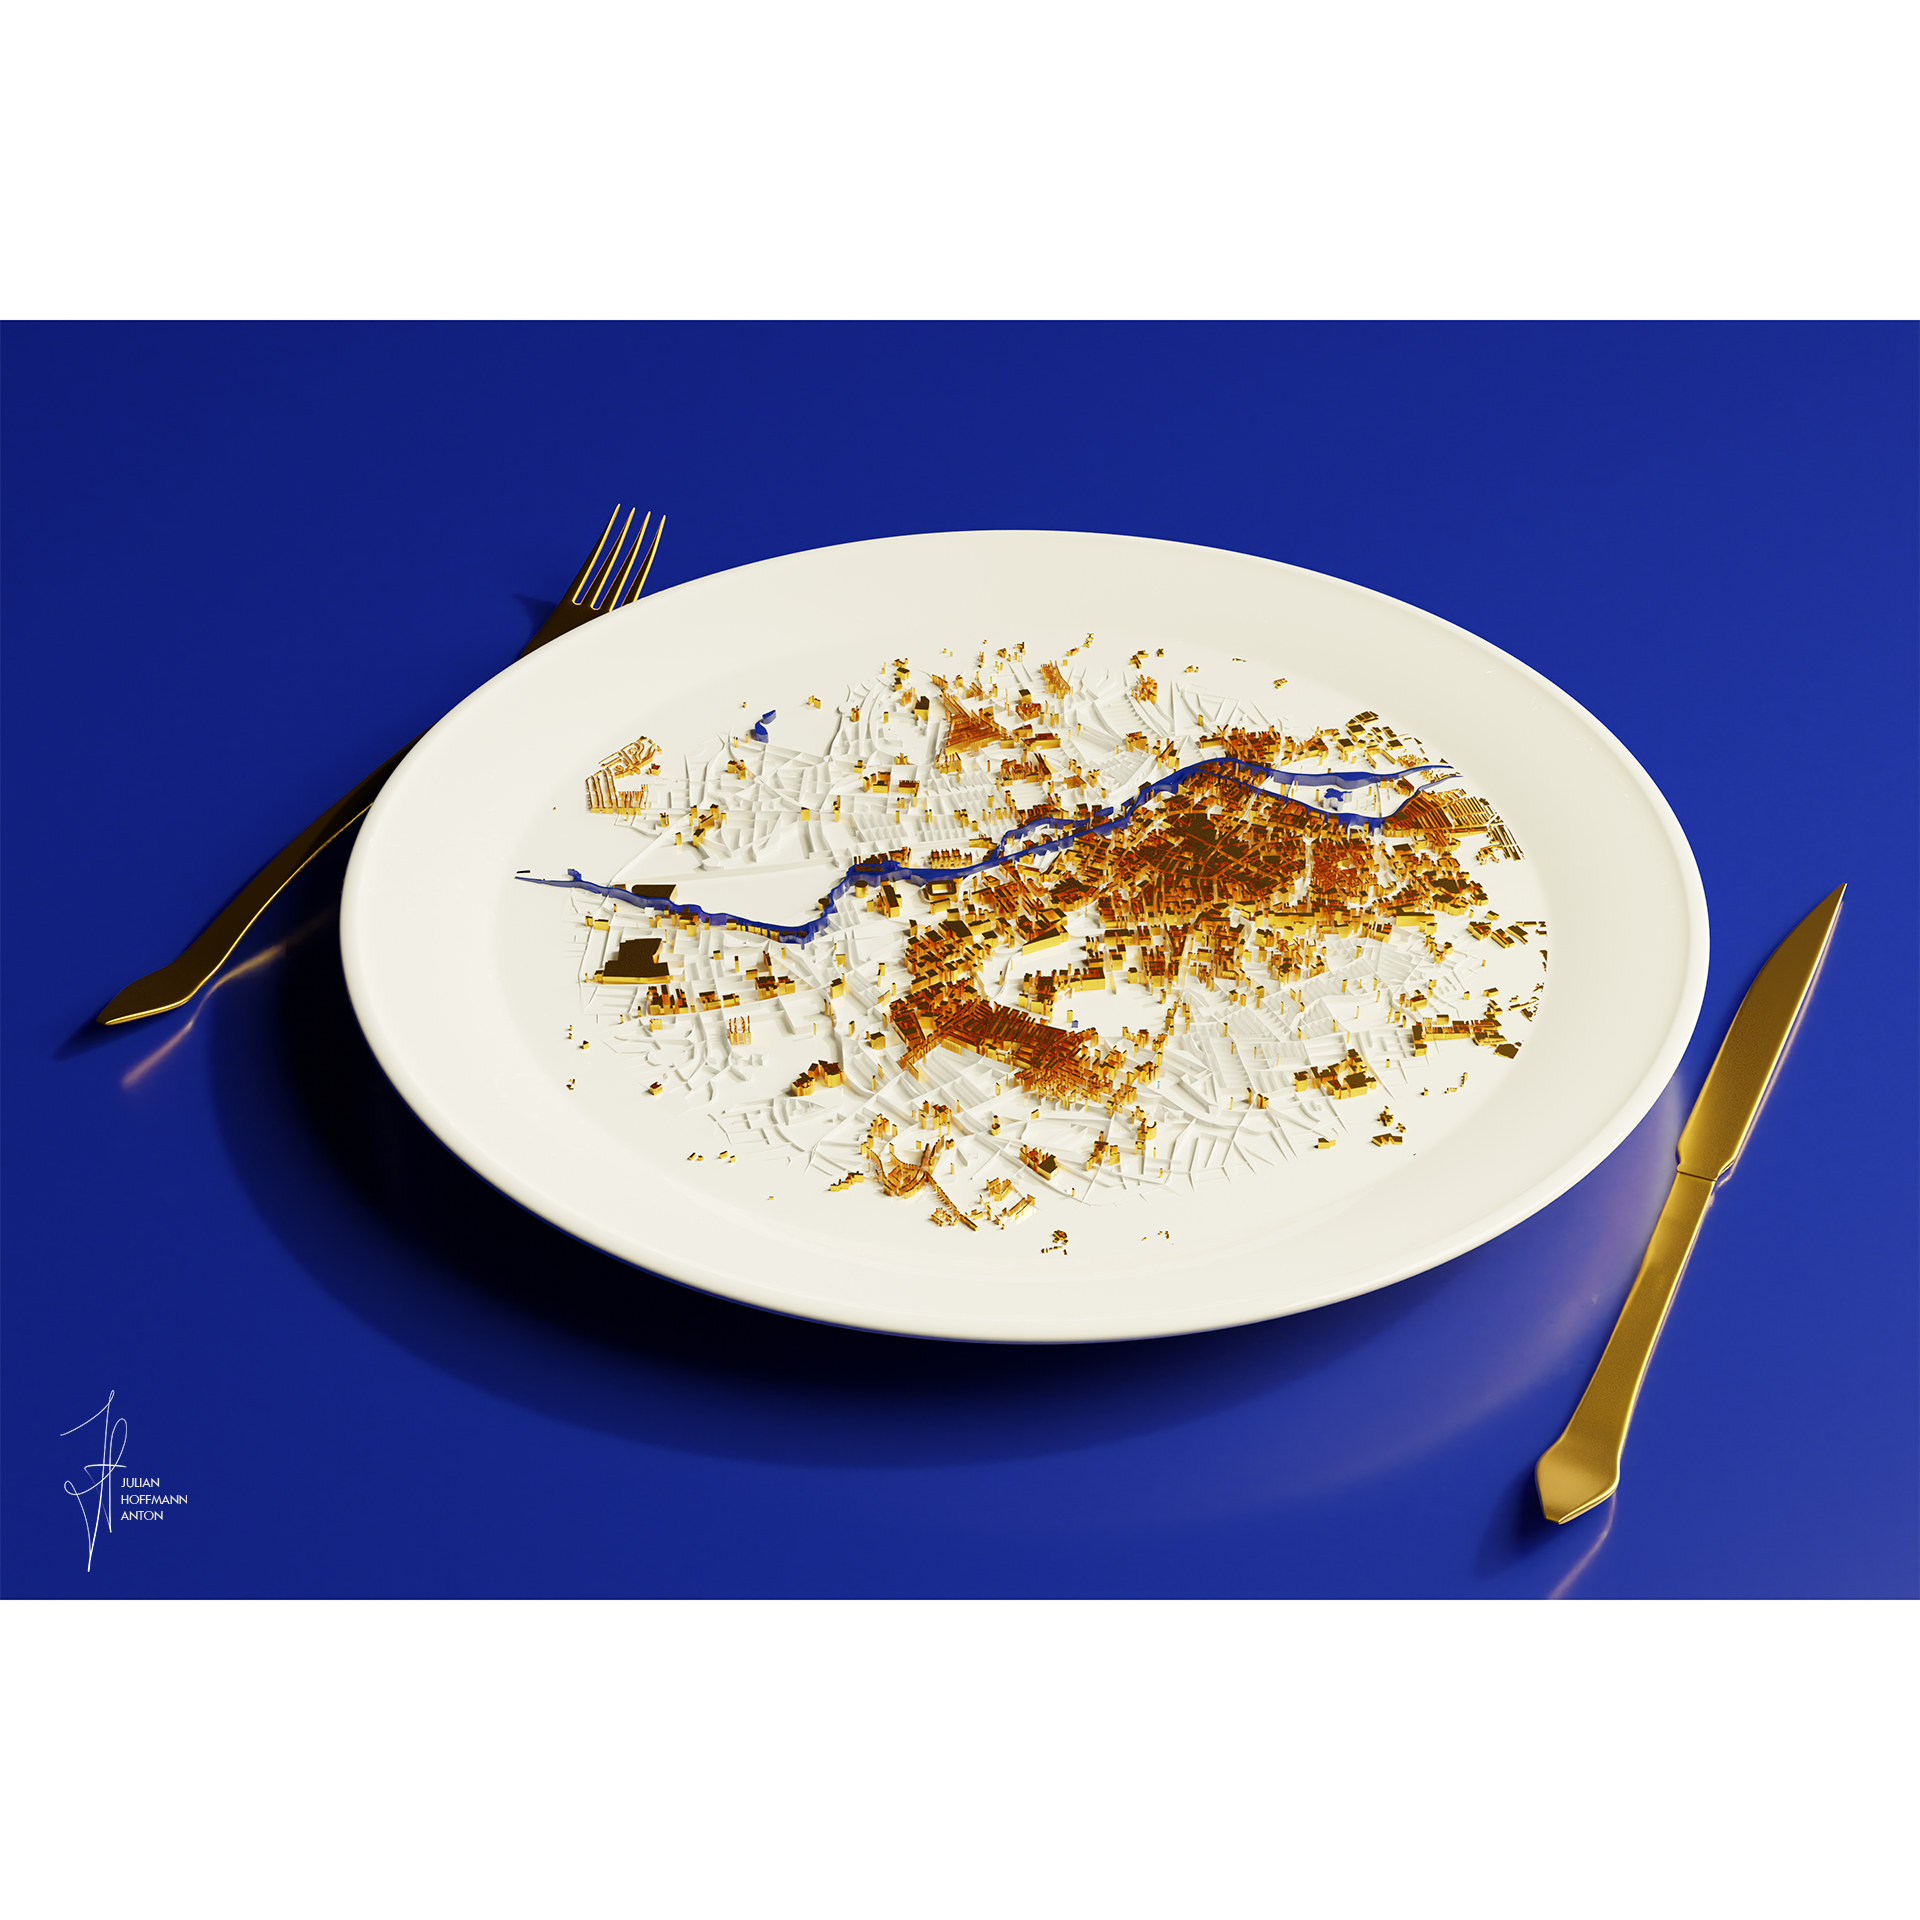
Spatial Dish I.
Spatial Dish I.
map_day_3_polygons_99_cities_vJH_HD_fin_side_CB.png
Promo_fluffy_v1_africa_f260_previewdetail.png
first_london_render38_zoom_A_bis_insta_CB.png
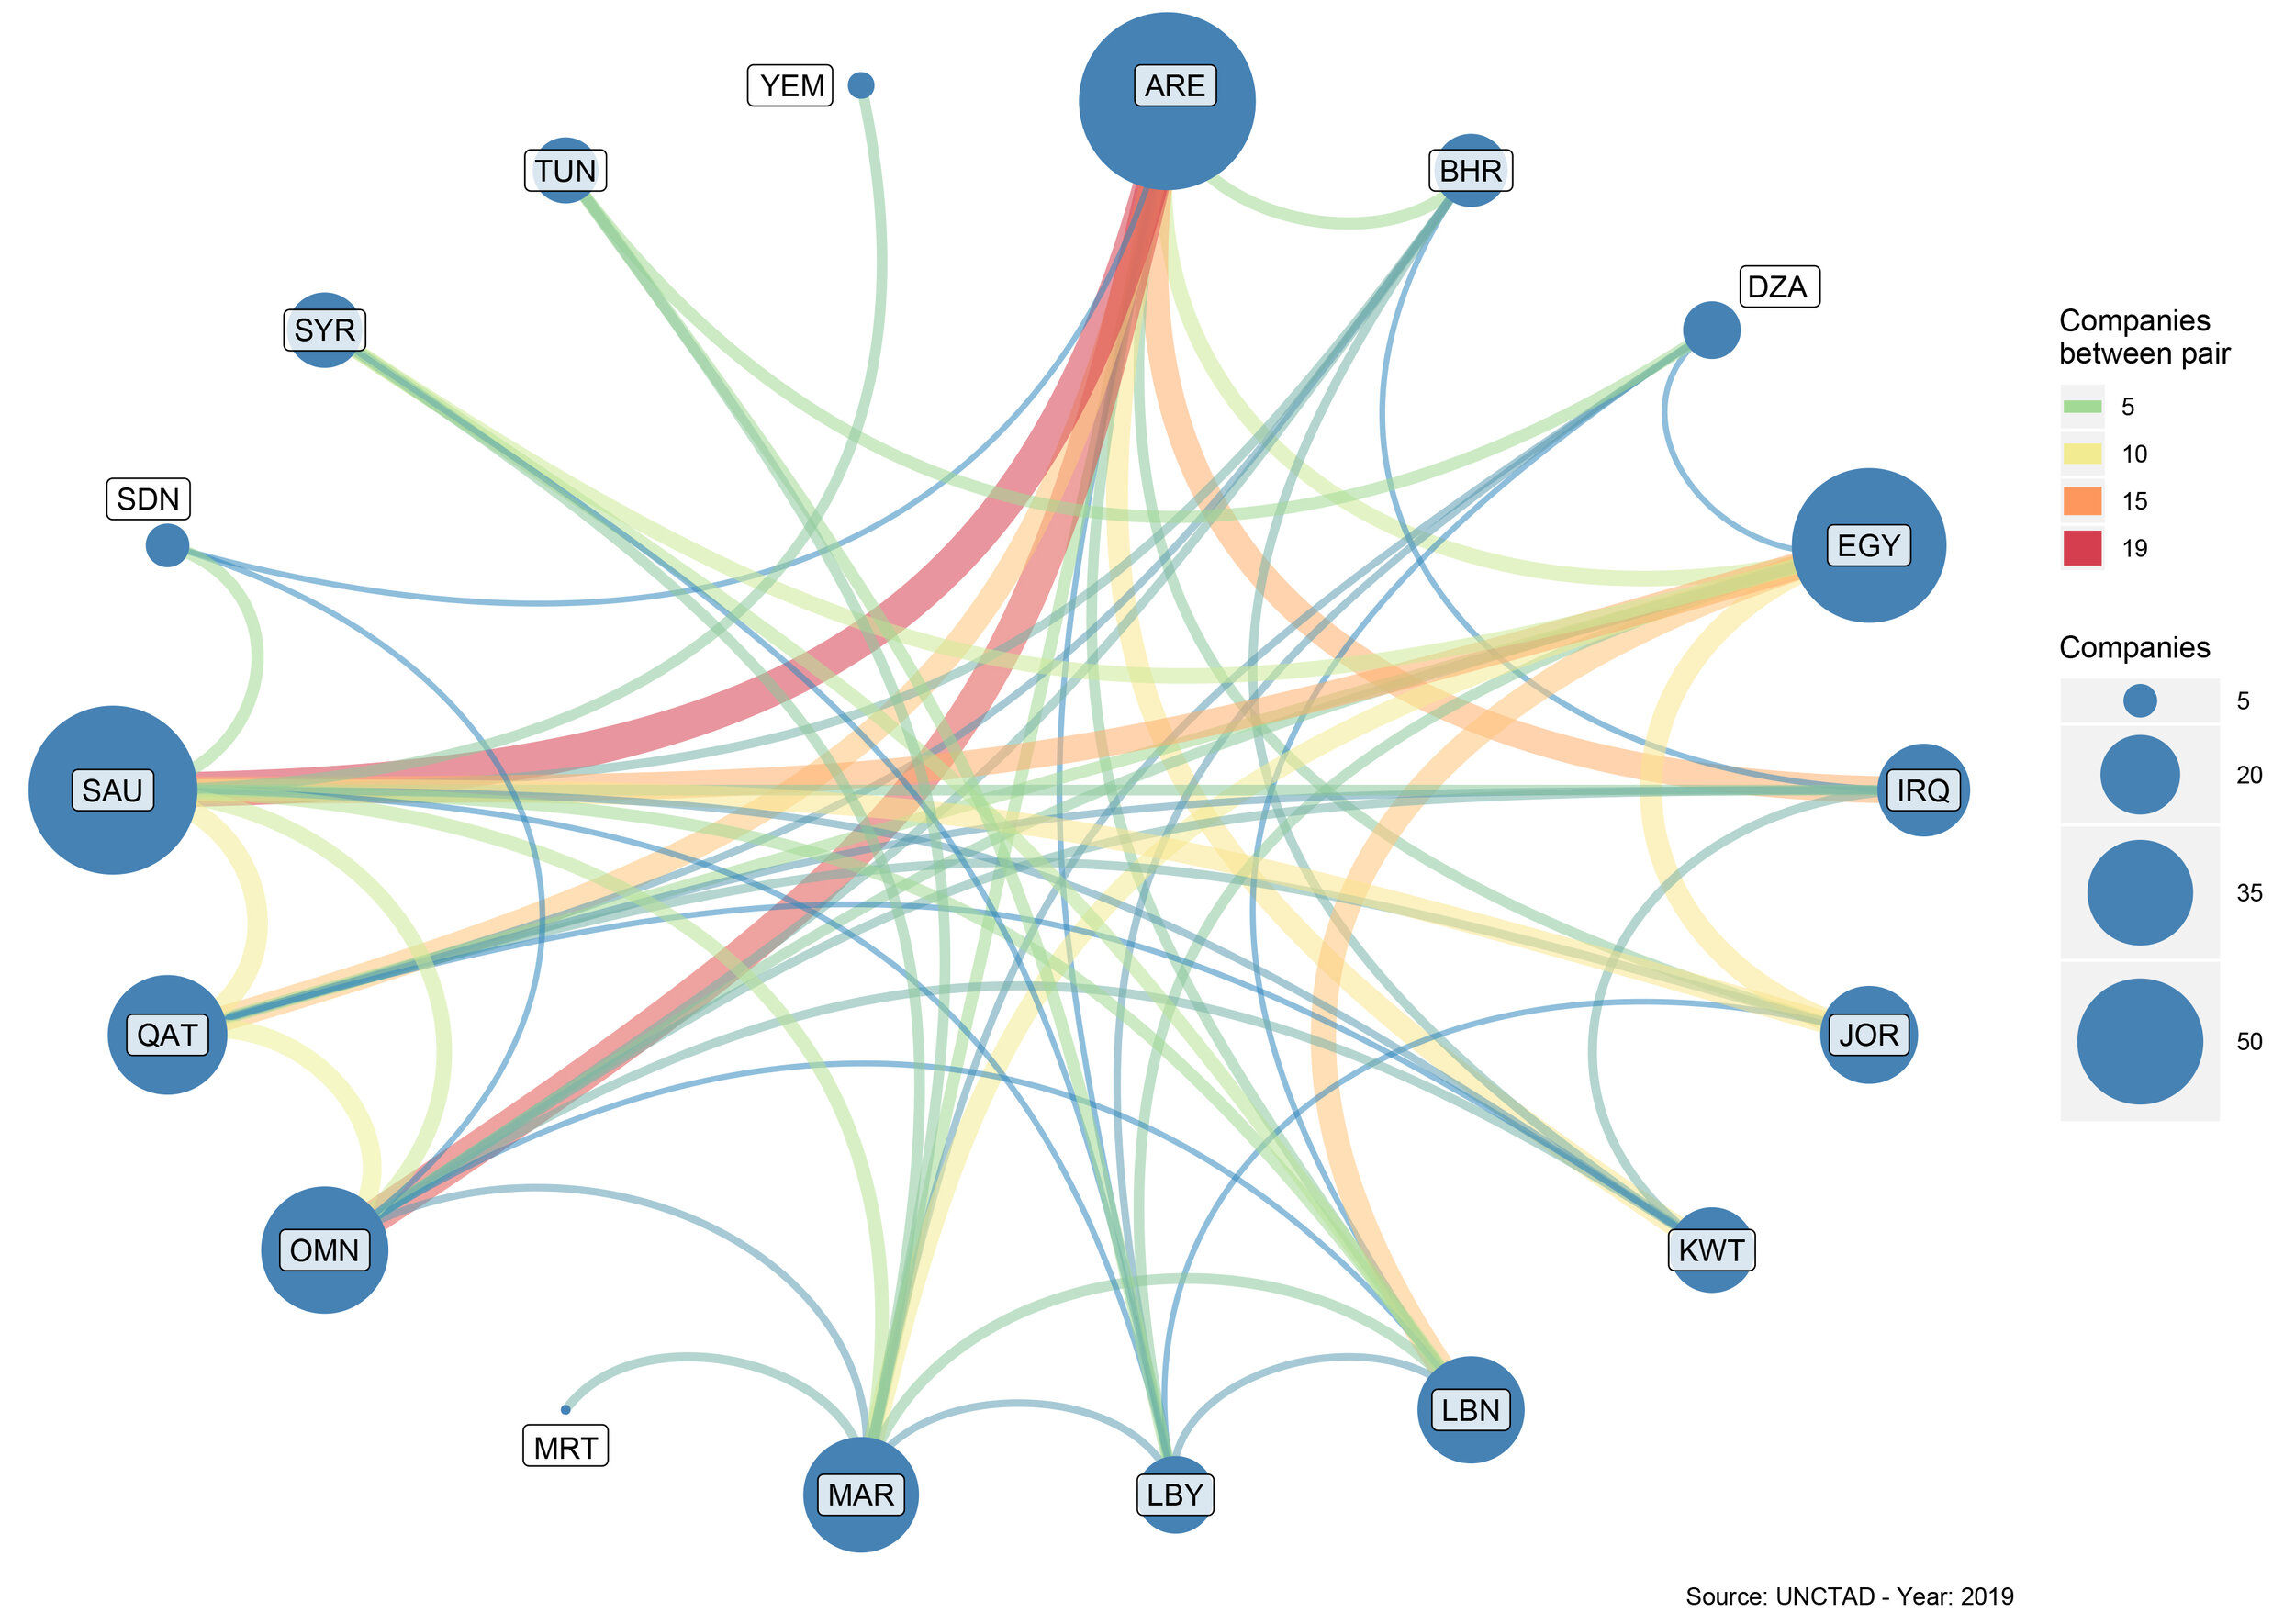
Connected Countries in MENA
London: Spinning my Labytinth I.
Top Import-Origin
Top Import-Origin
map_ukraine_labelsUkraine hd.png
Connected Ports & Oceans
Mont Blanc
Mont Blanc
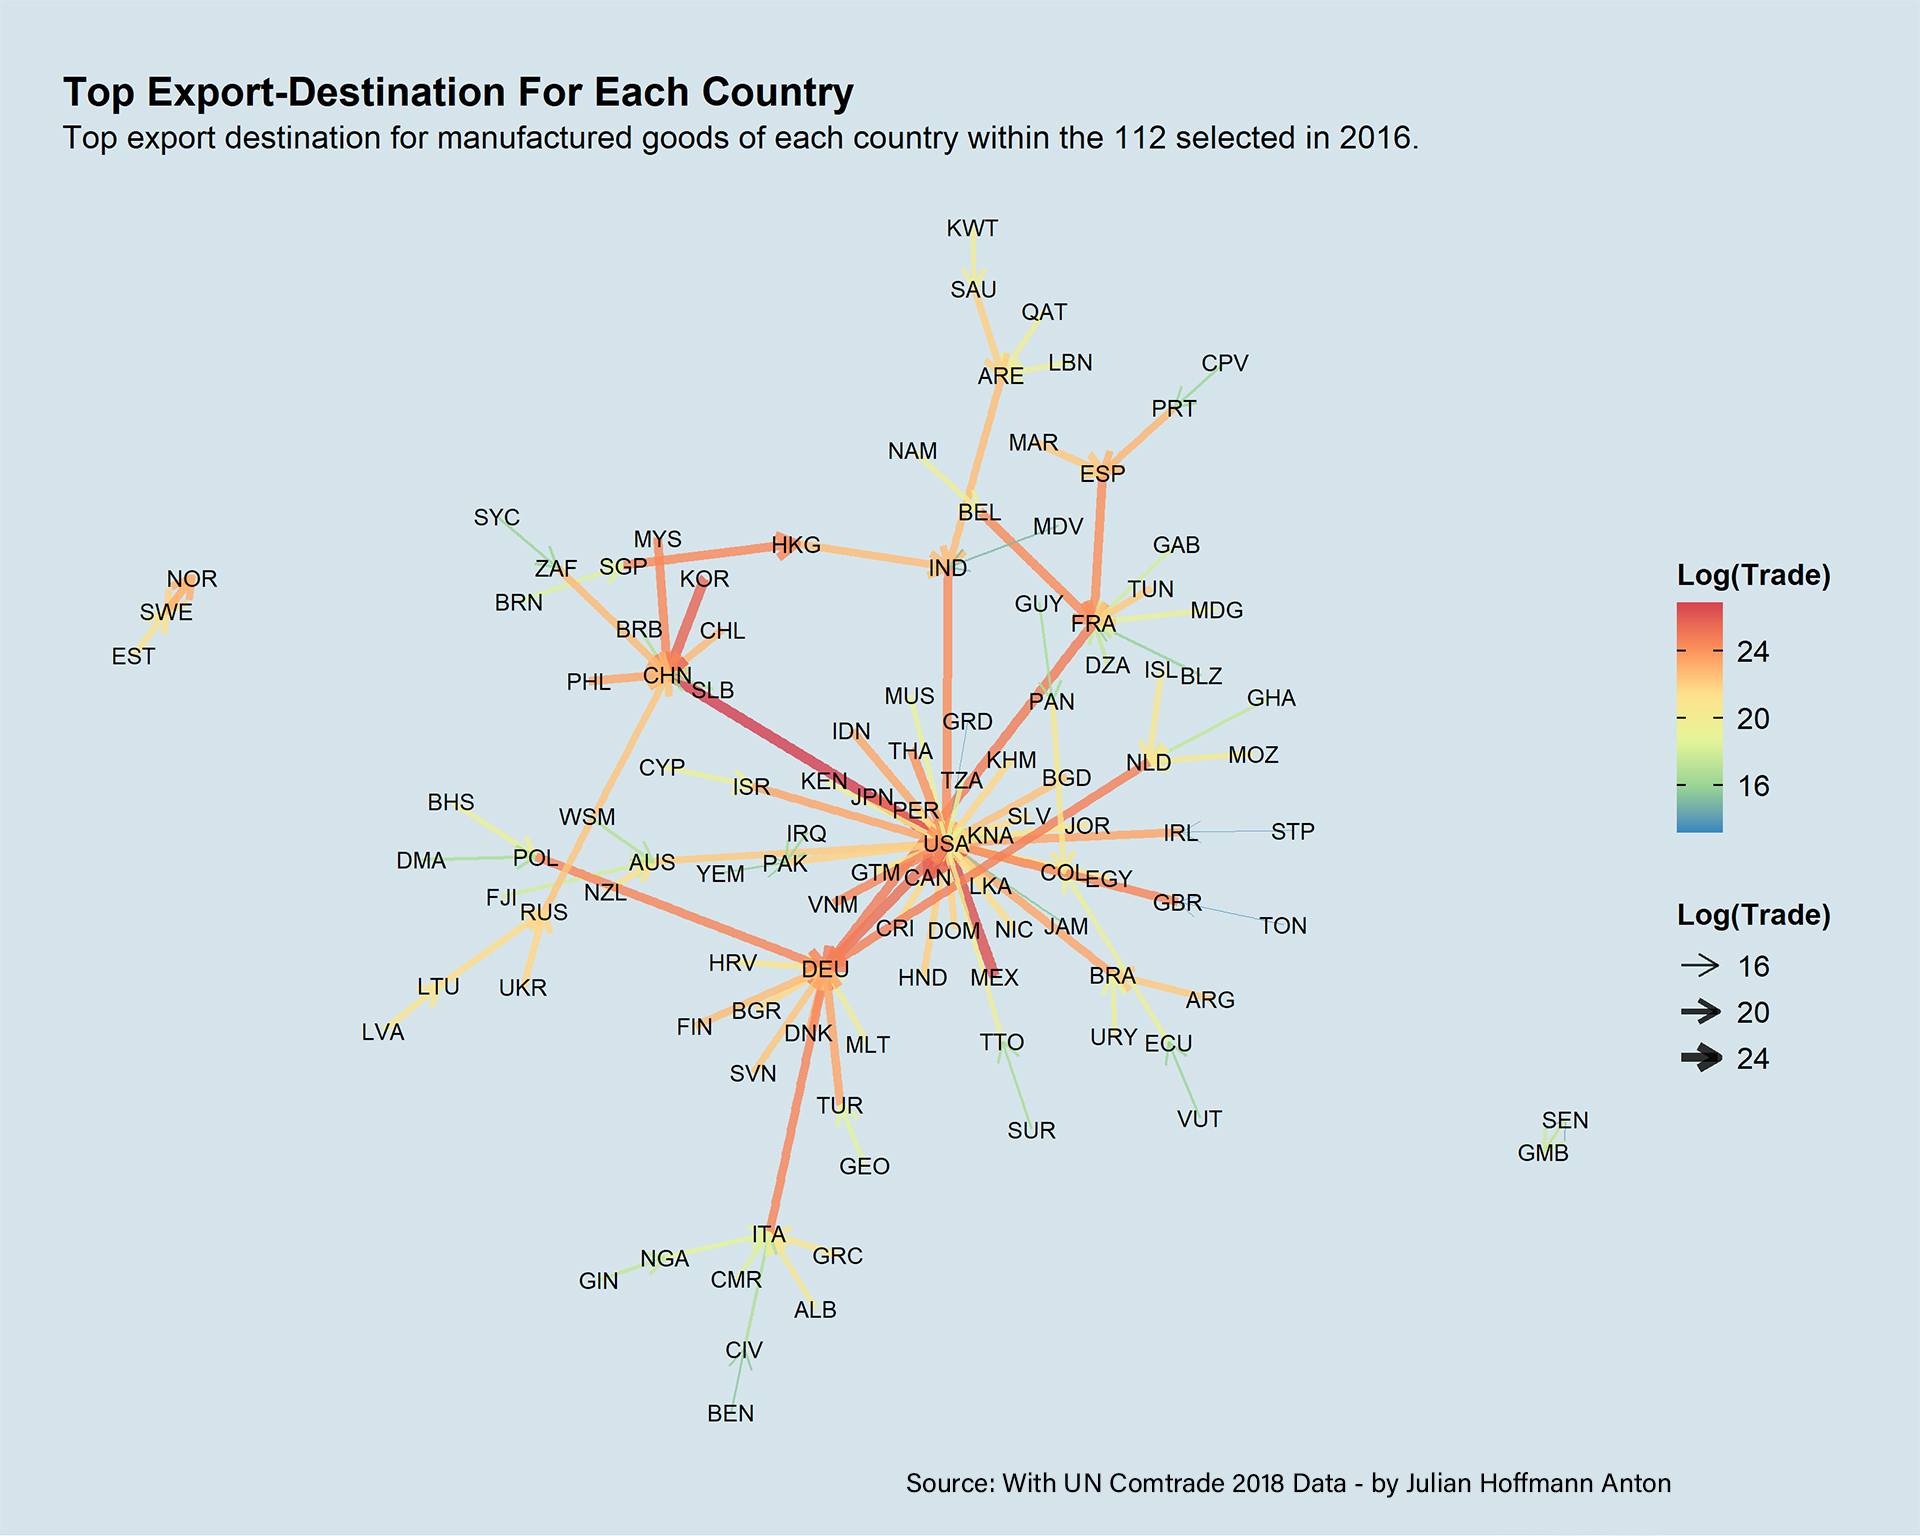
Top Export-Destinations
Top Export-DestinationsTop export-destinations for manufactured goods.
Map: Size (TEU) of the largest container ship deployedFull article: https://unctad.org/news/bigger-ships-and-fewer-companies-two-sides-same-coin
Spatial Memories I.
Spatial Memories I.
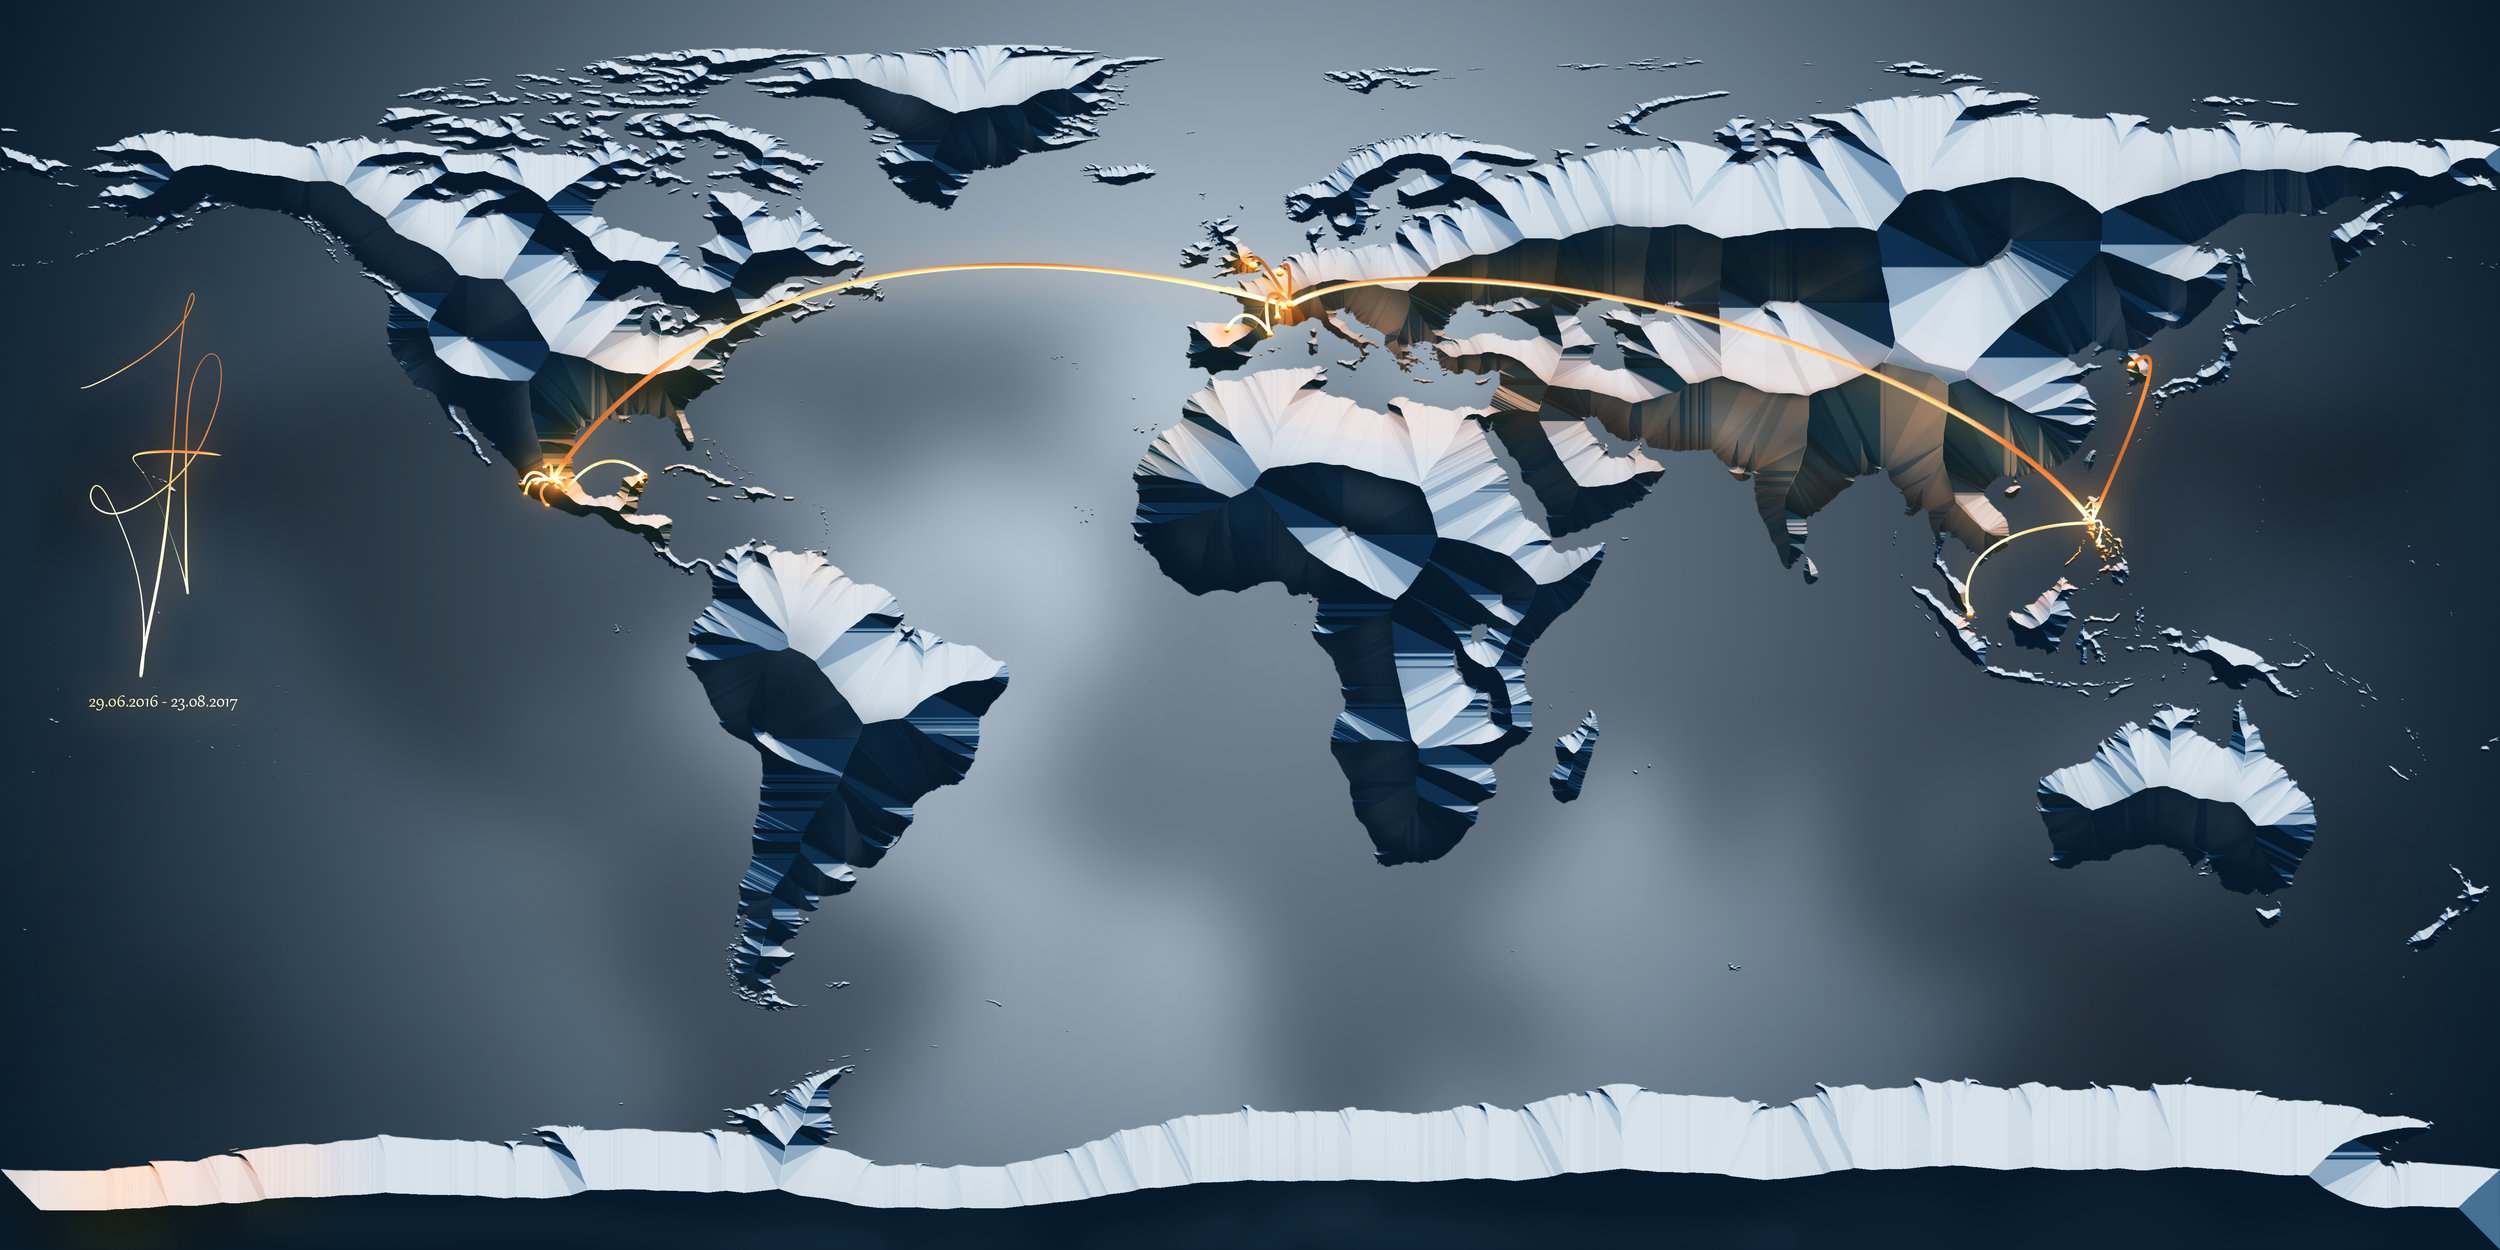
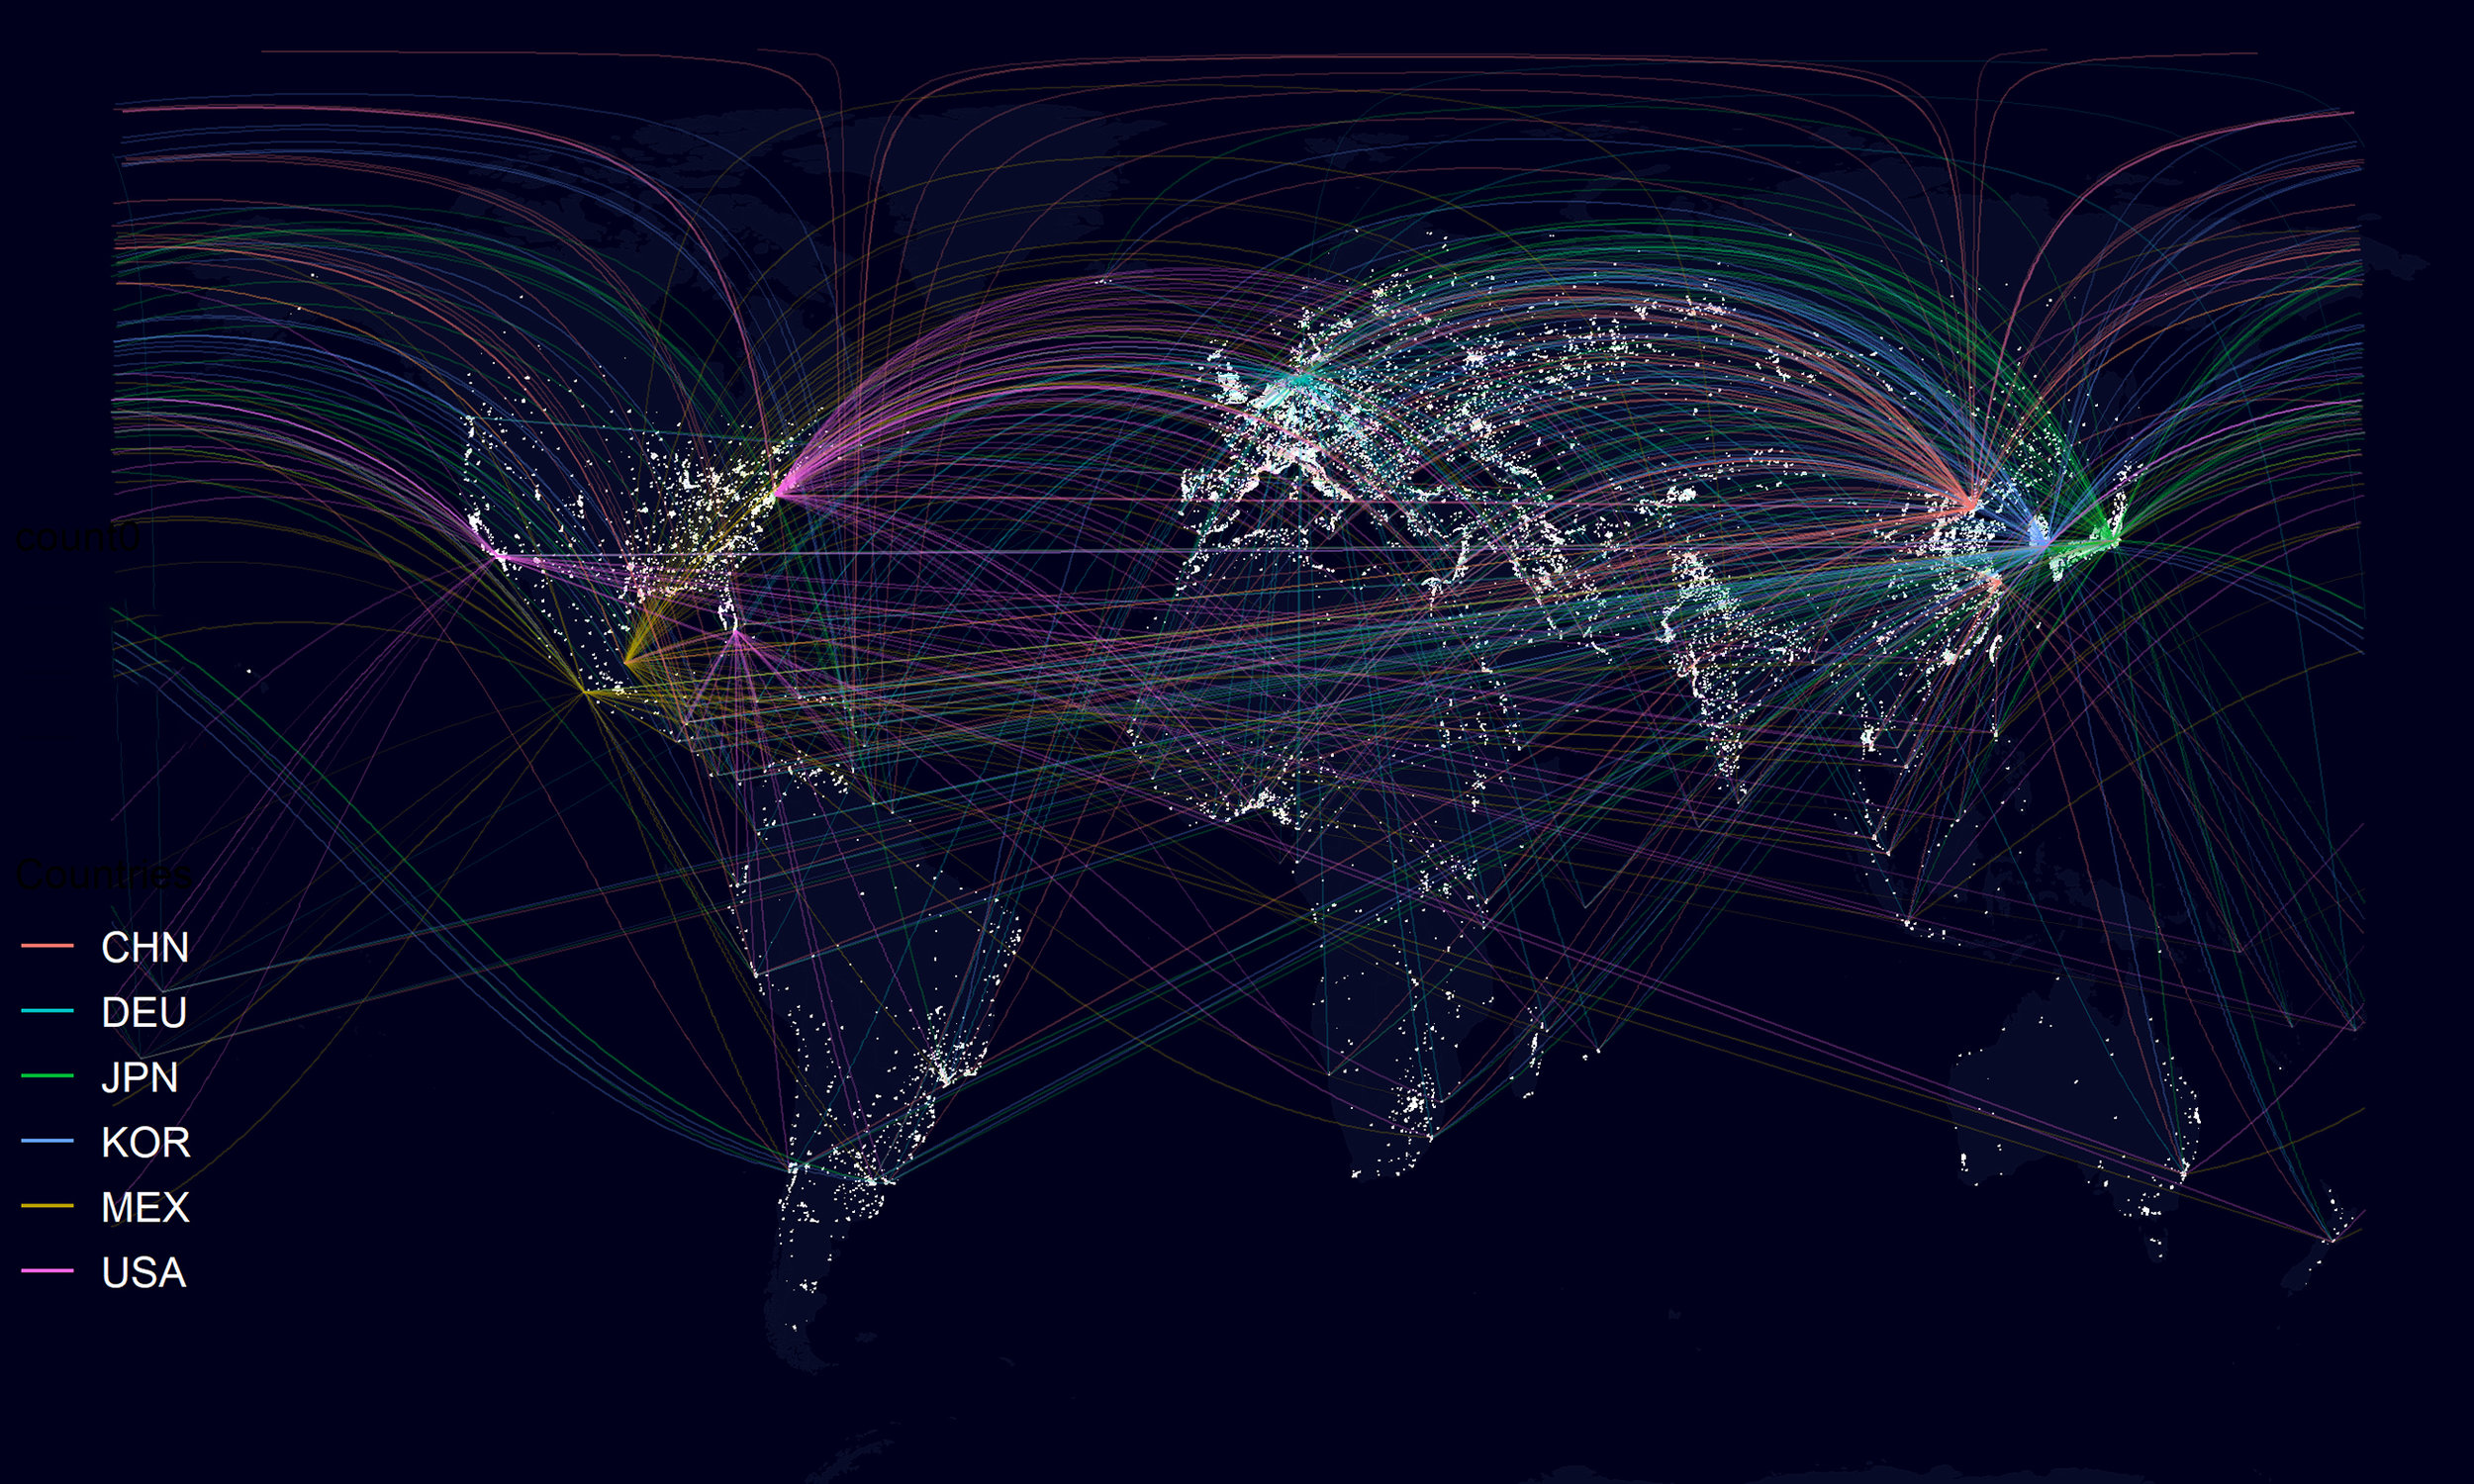
One Year Journey
One Year Journey
Manufactured Goods II
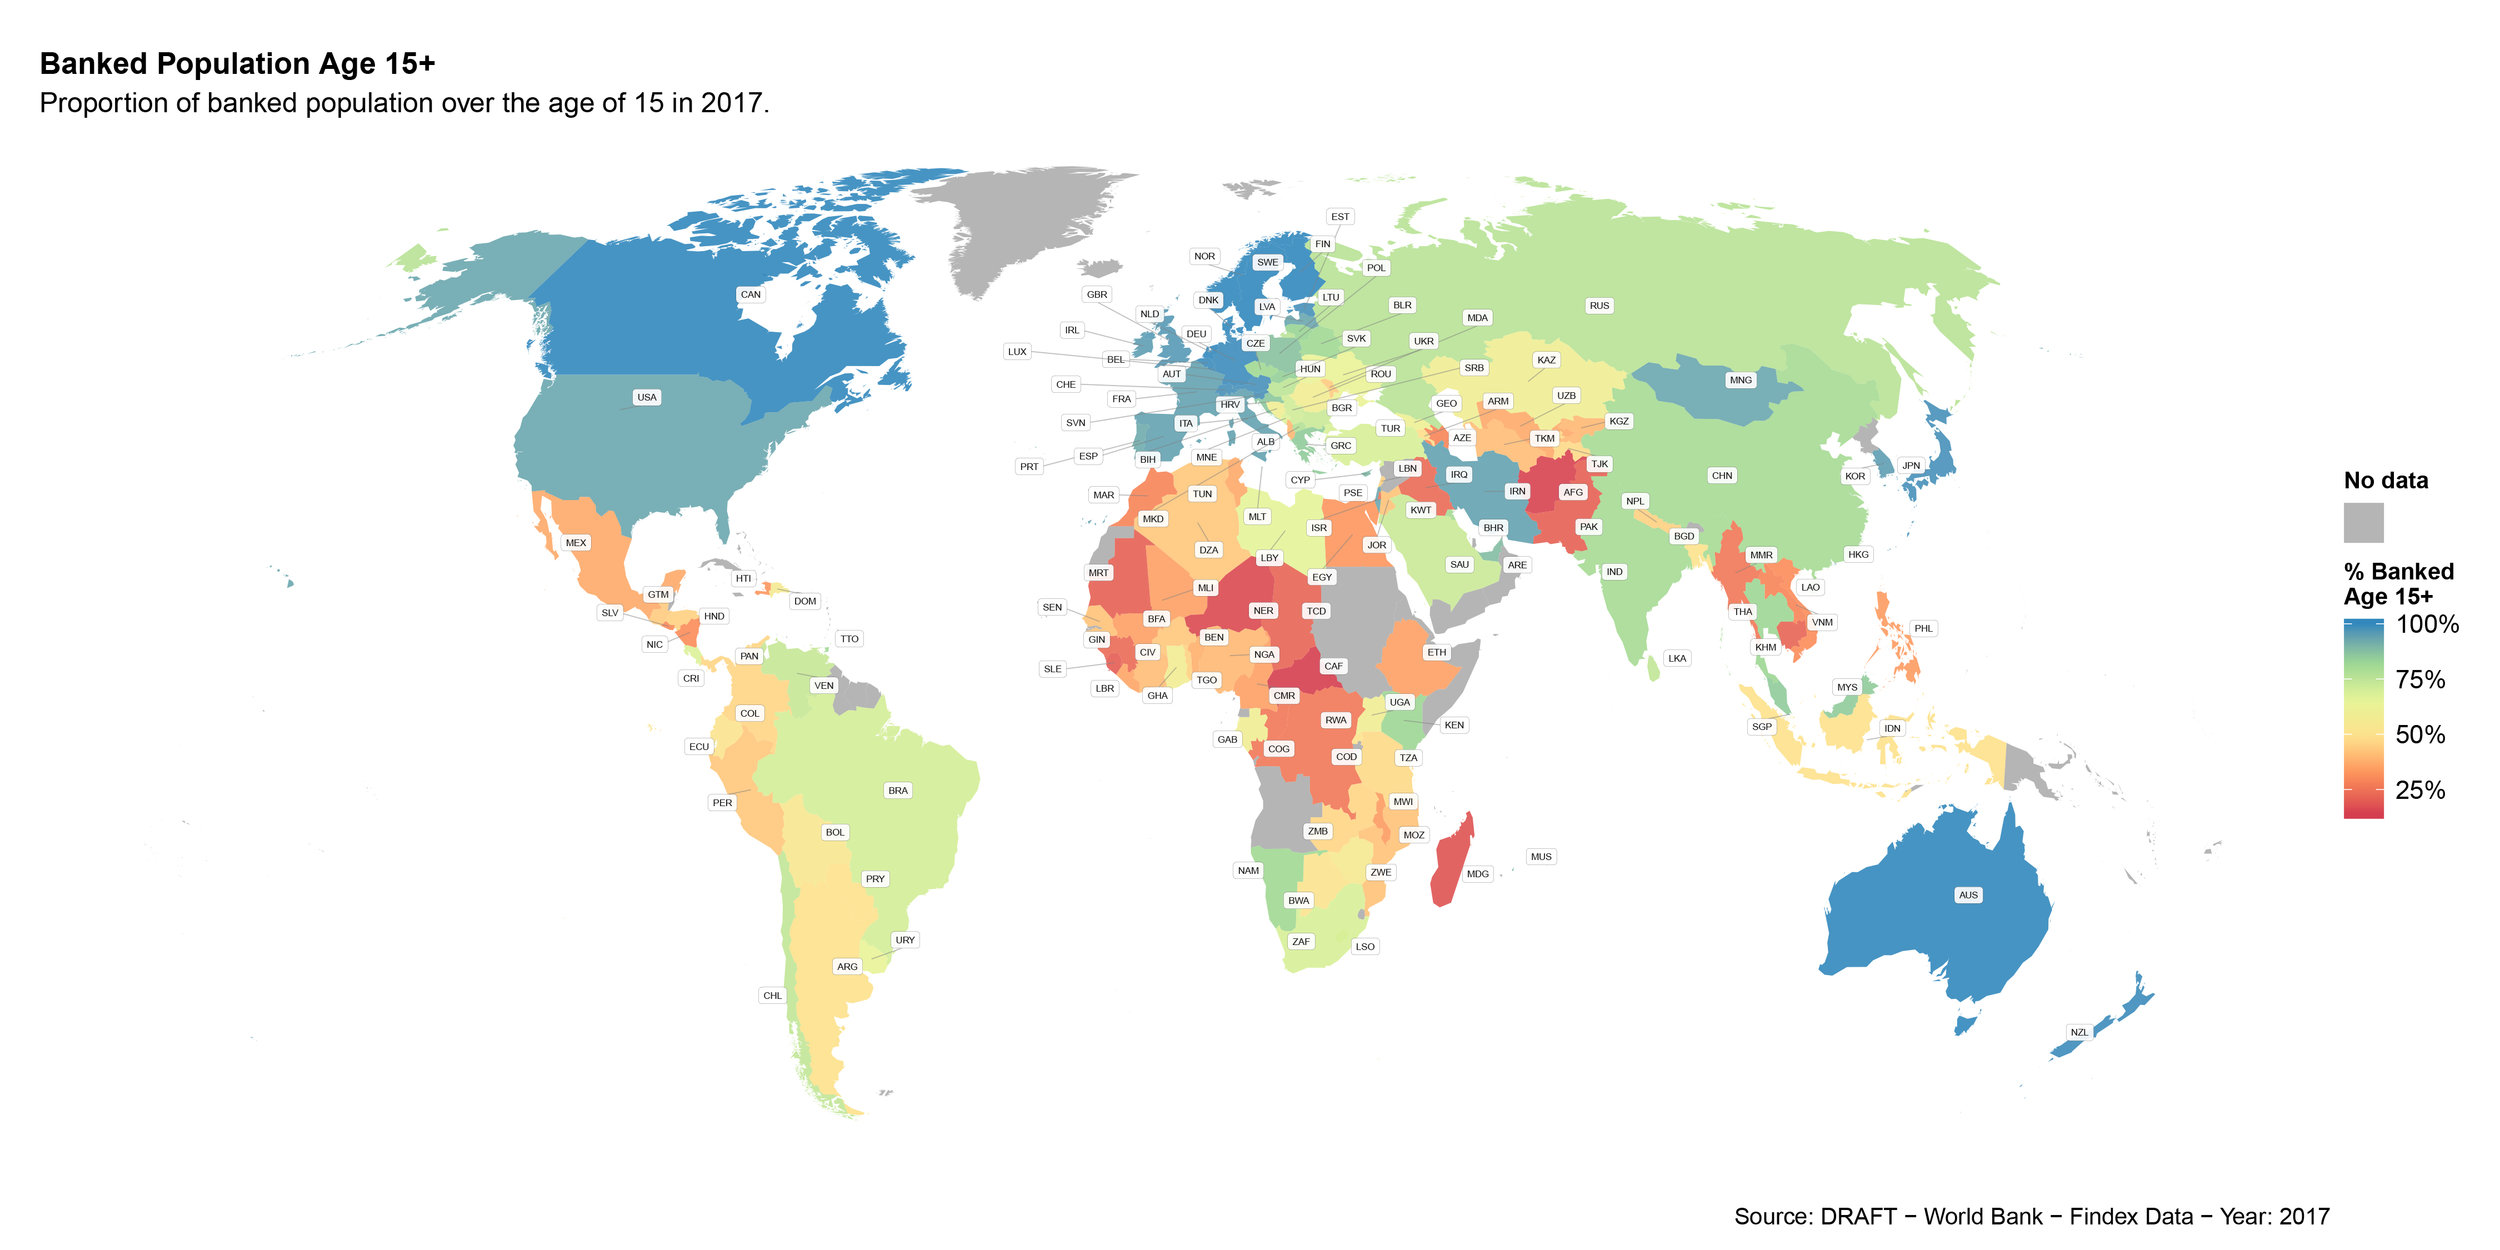
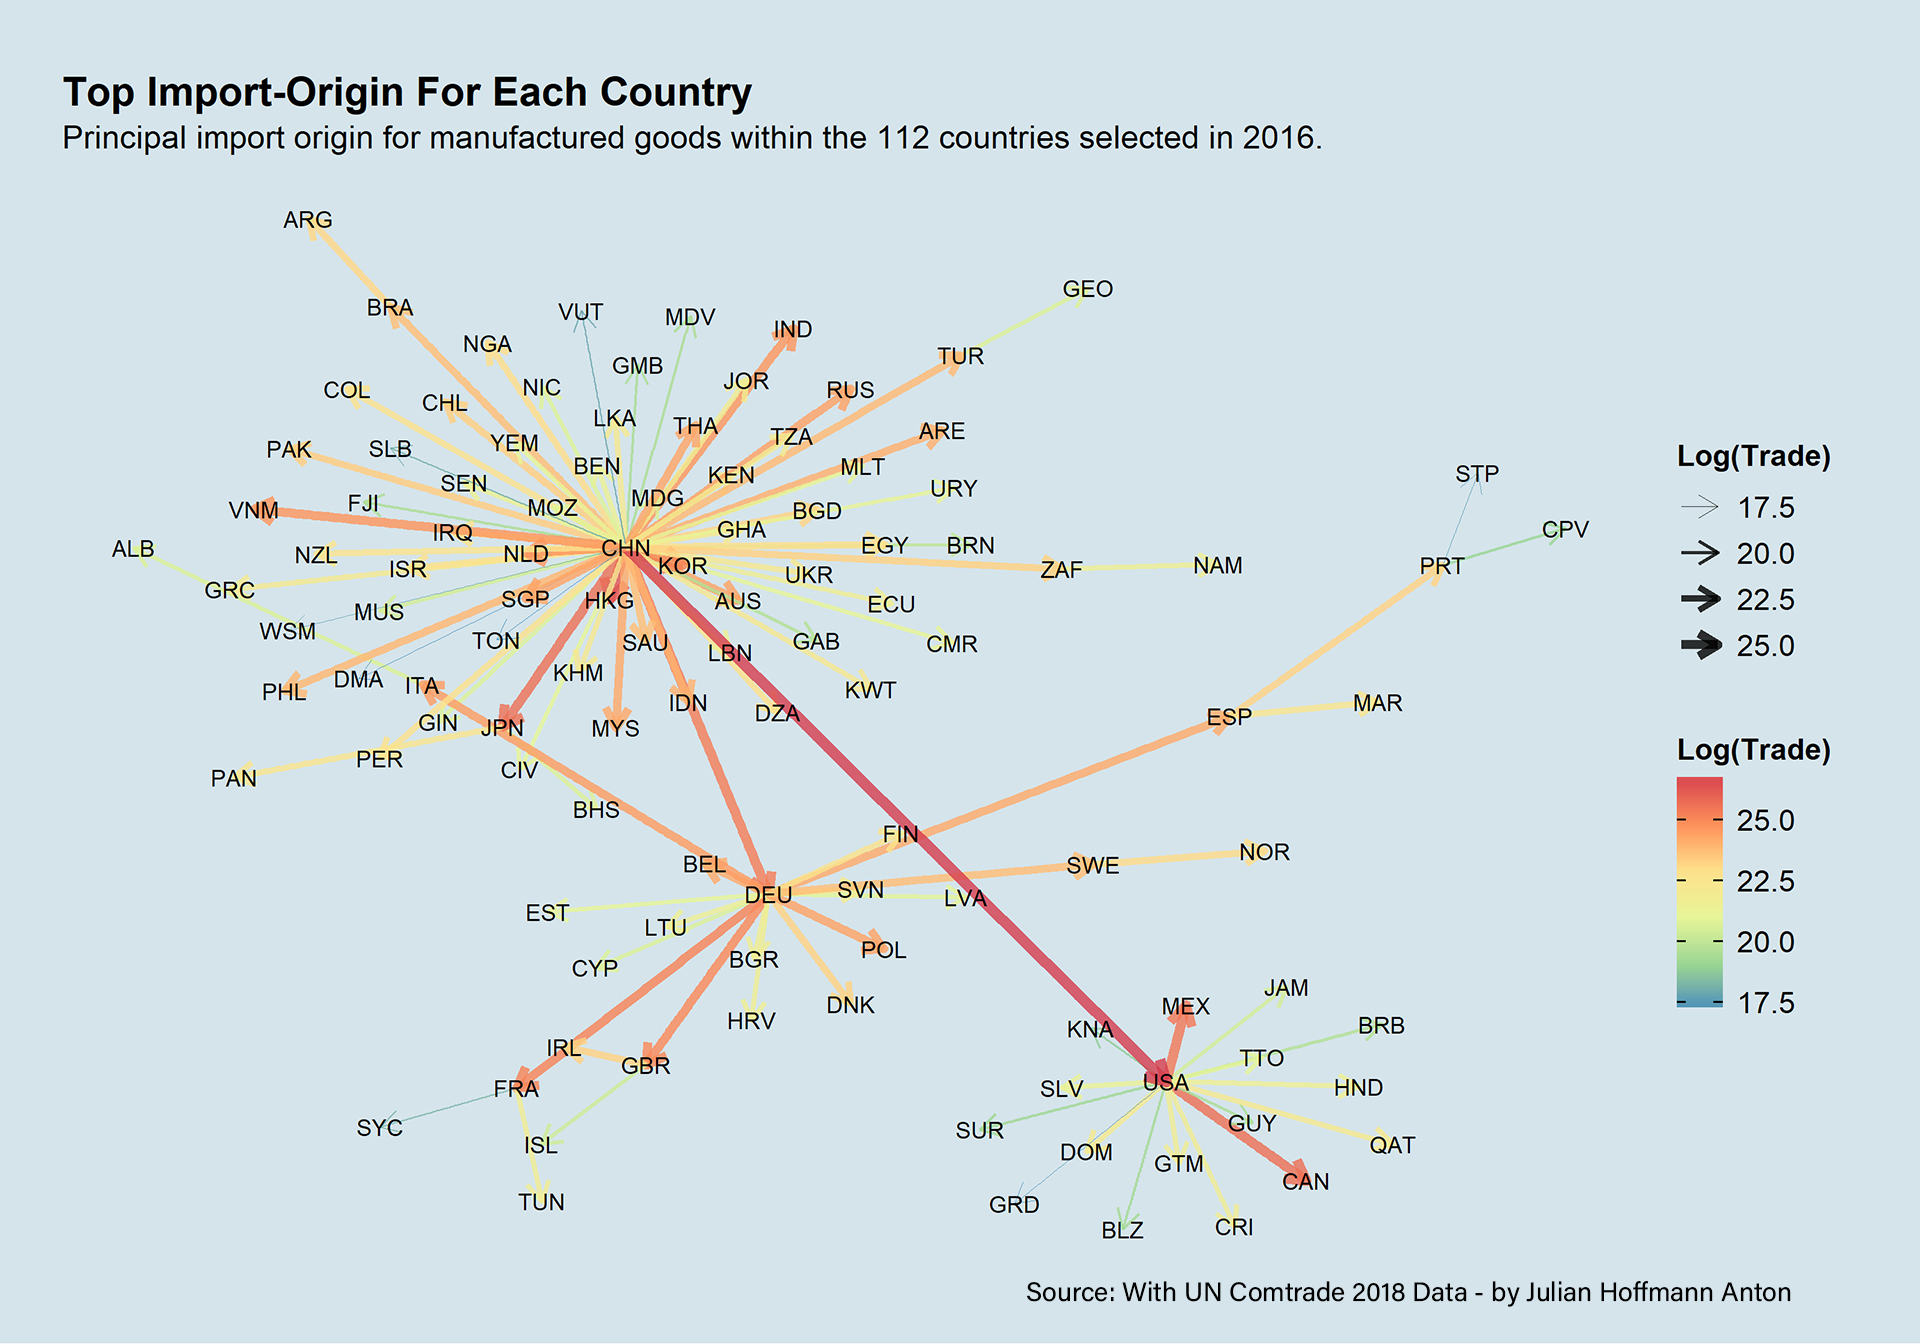
Manufactured Goods IITrade of Manufactured Goods in 2016 visualised. Source of data: UN COMETRADE 2018. Part of my MSc Dissertation
map_draft_world_findex_banked_15plus_lab_v2.jpg
Life is a maze
Life is a maze
Africa Dimensions
Africa Dimensions
map_day_14_new_york_vJHjhCB.png
Cartogram Ship Arrivals and Days
Cartogram Ship Arrivals and DaysData MarineTraffic and UNCTAD
Bivariate Maps
Bivariate Maps
maritime_network_JH_v2_20_07_07_22_02.jpg
Manufactured Goods I
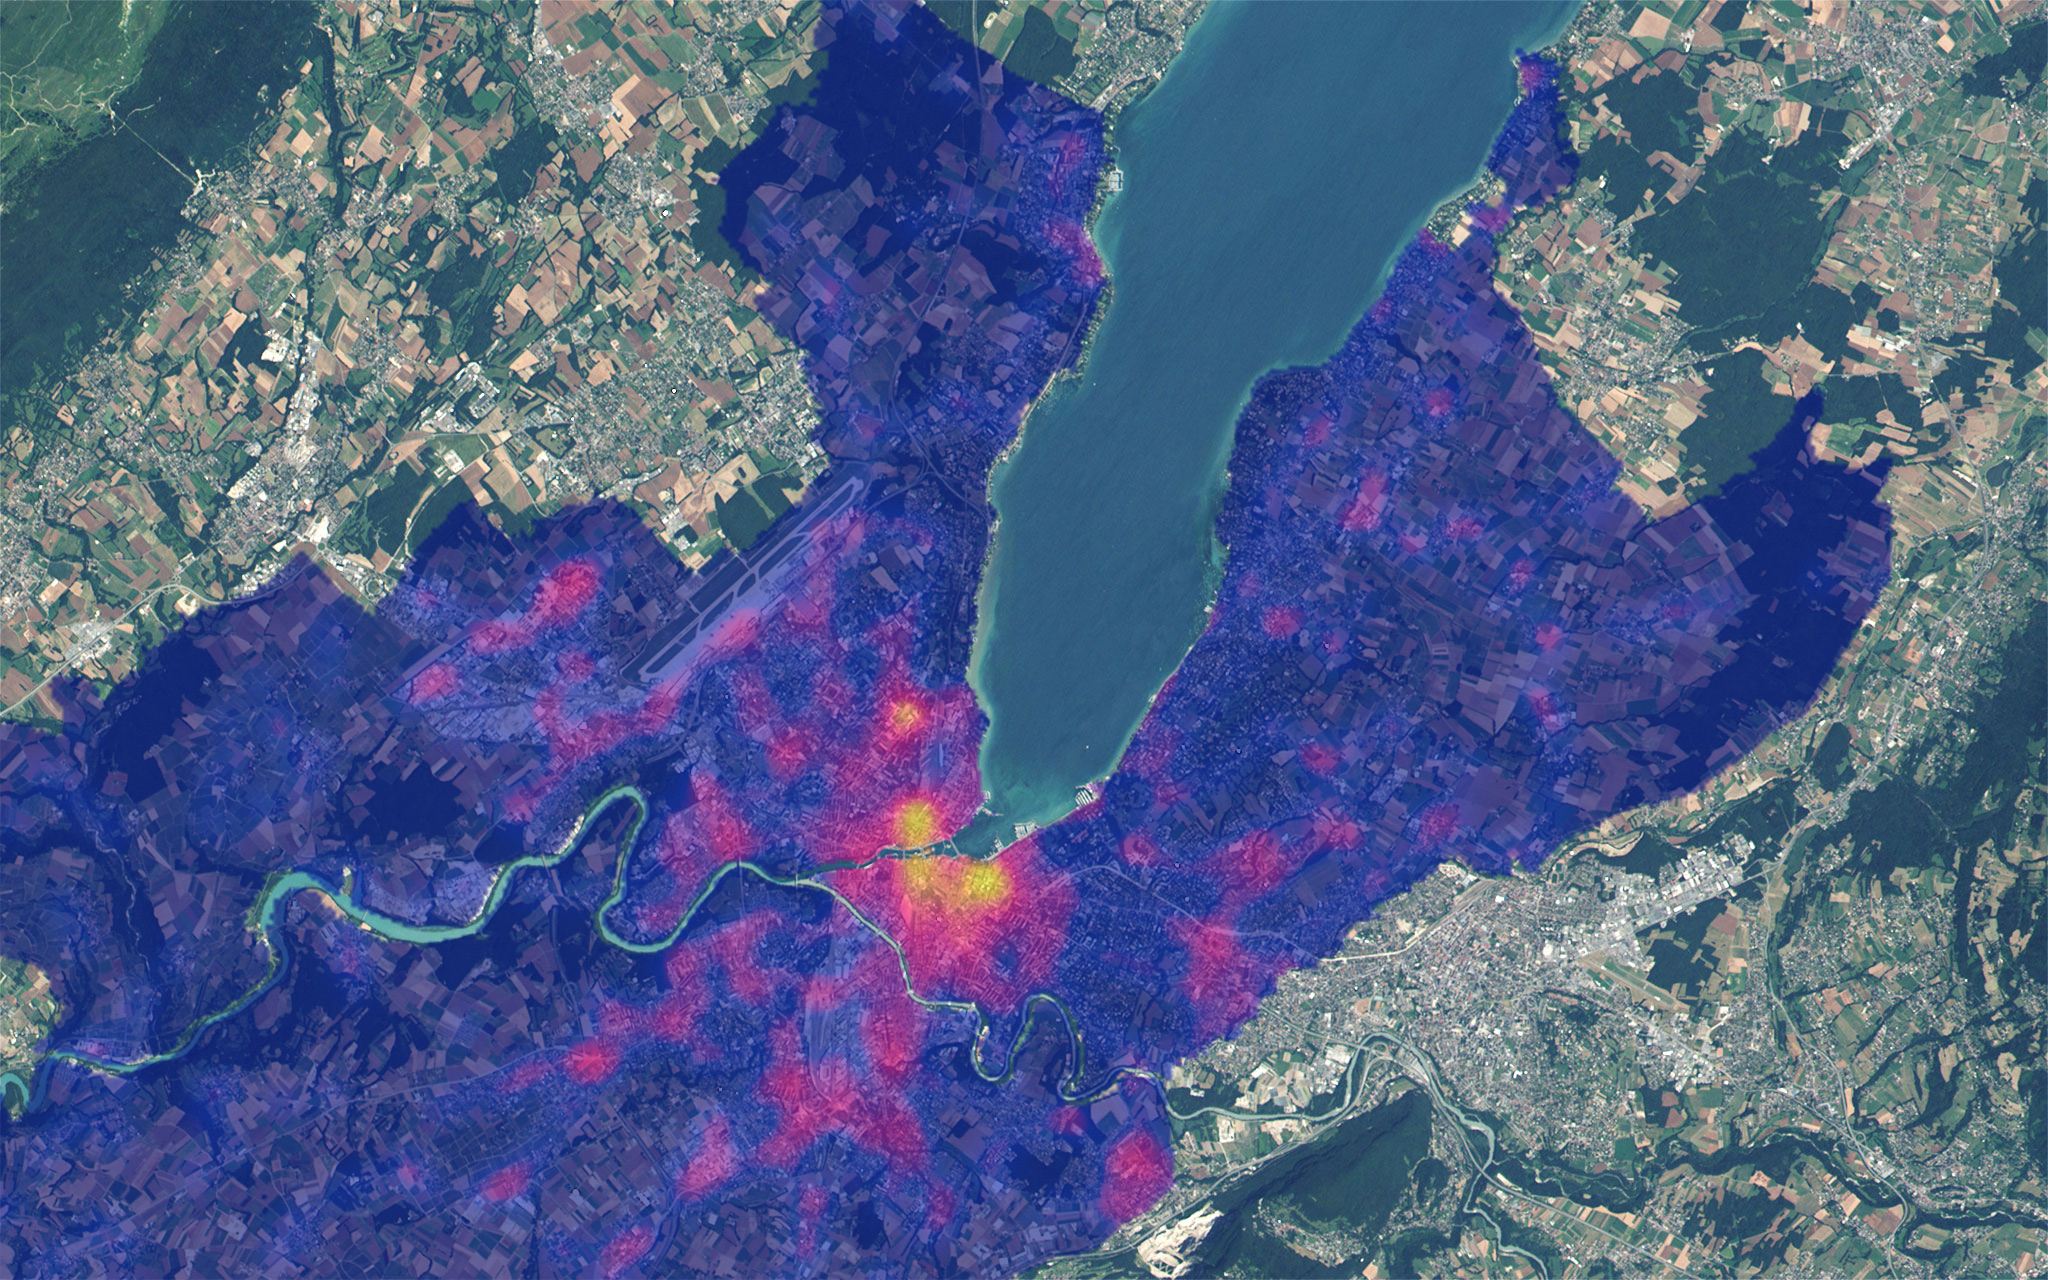
Public Transport Stop Density
pj_16_london_the_place_to_be_vFinal9Insta_blue.png
Mont Blanc - Top View
World map features A and B
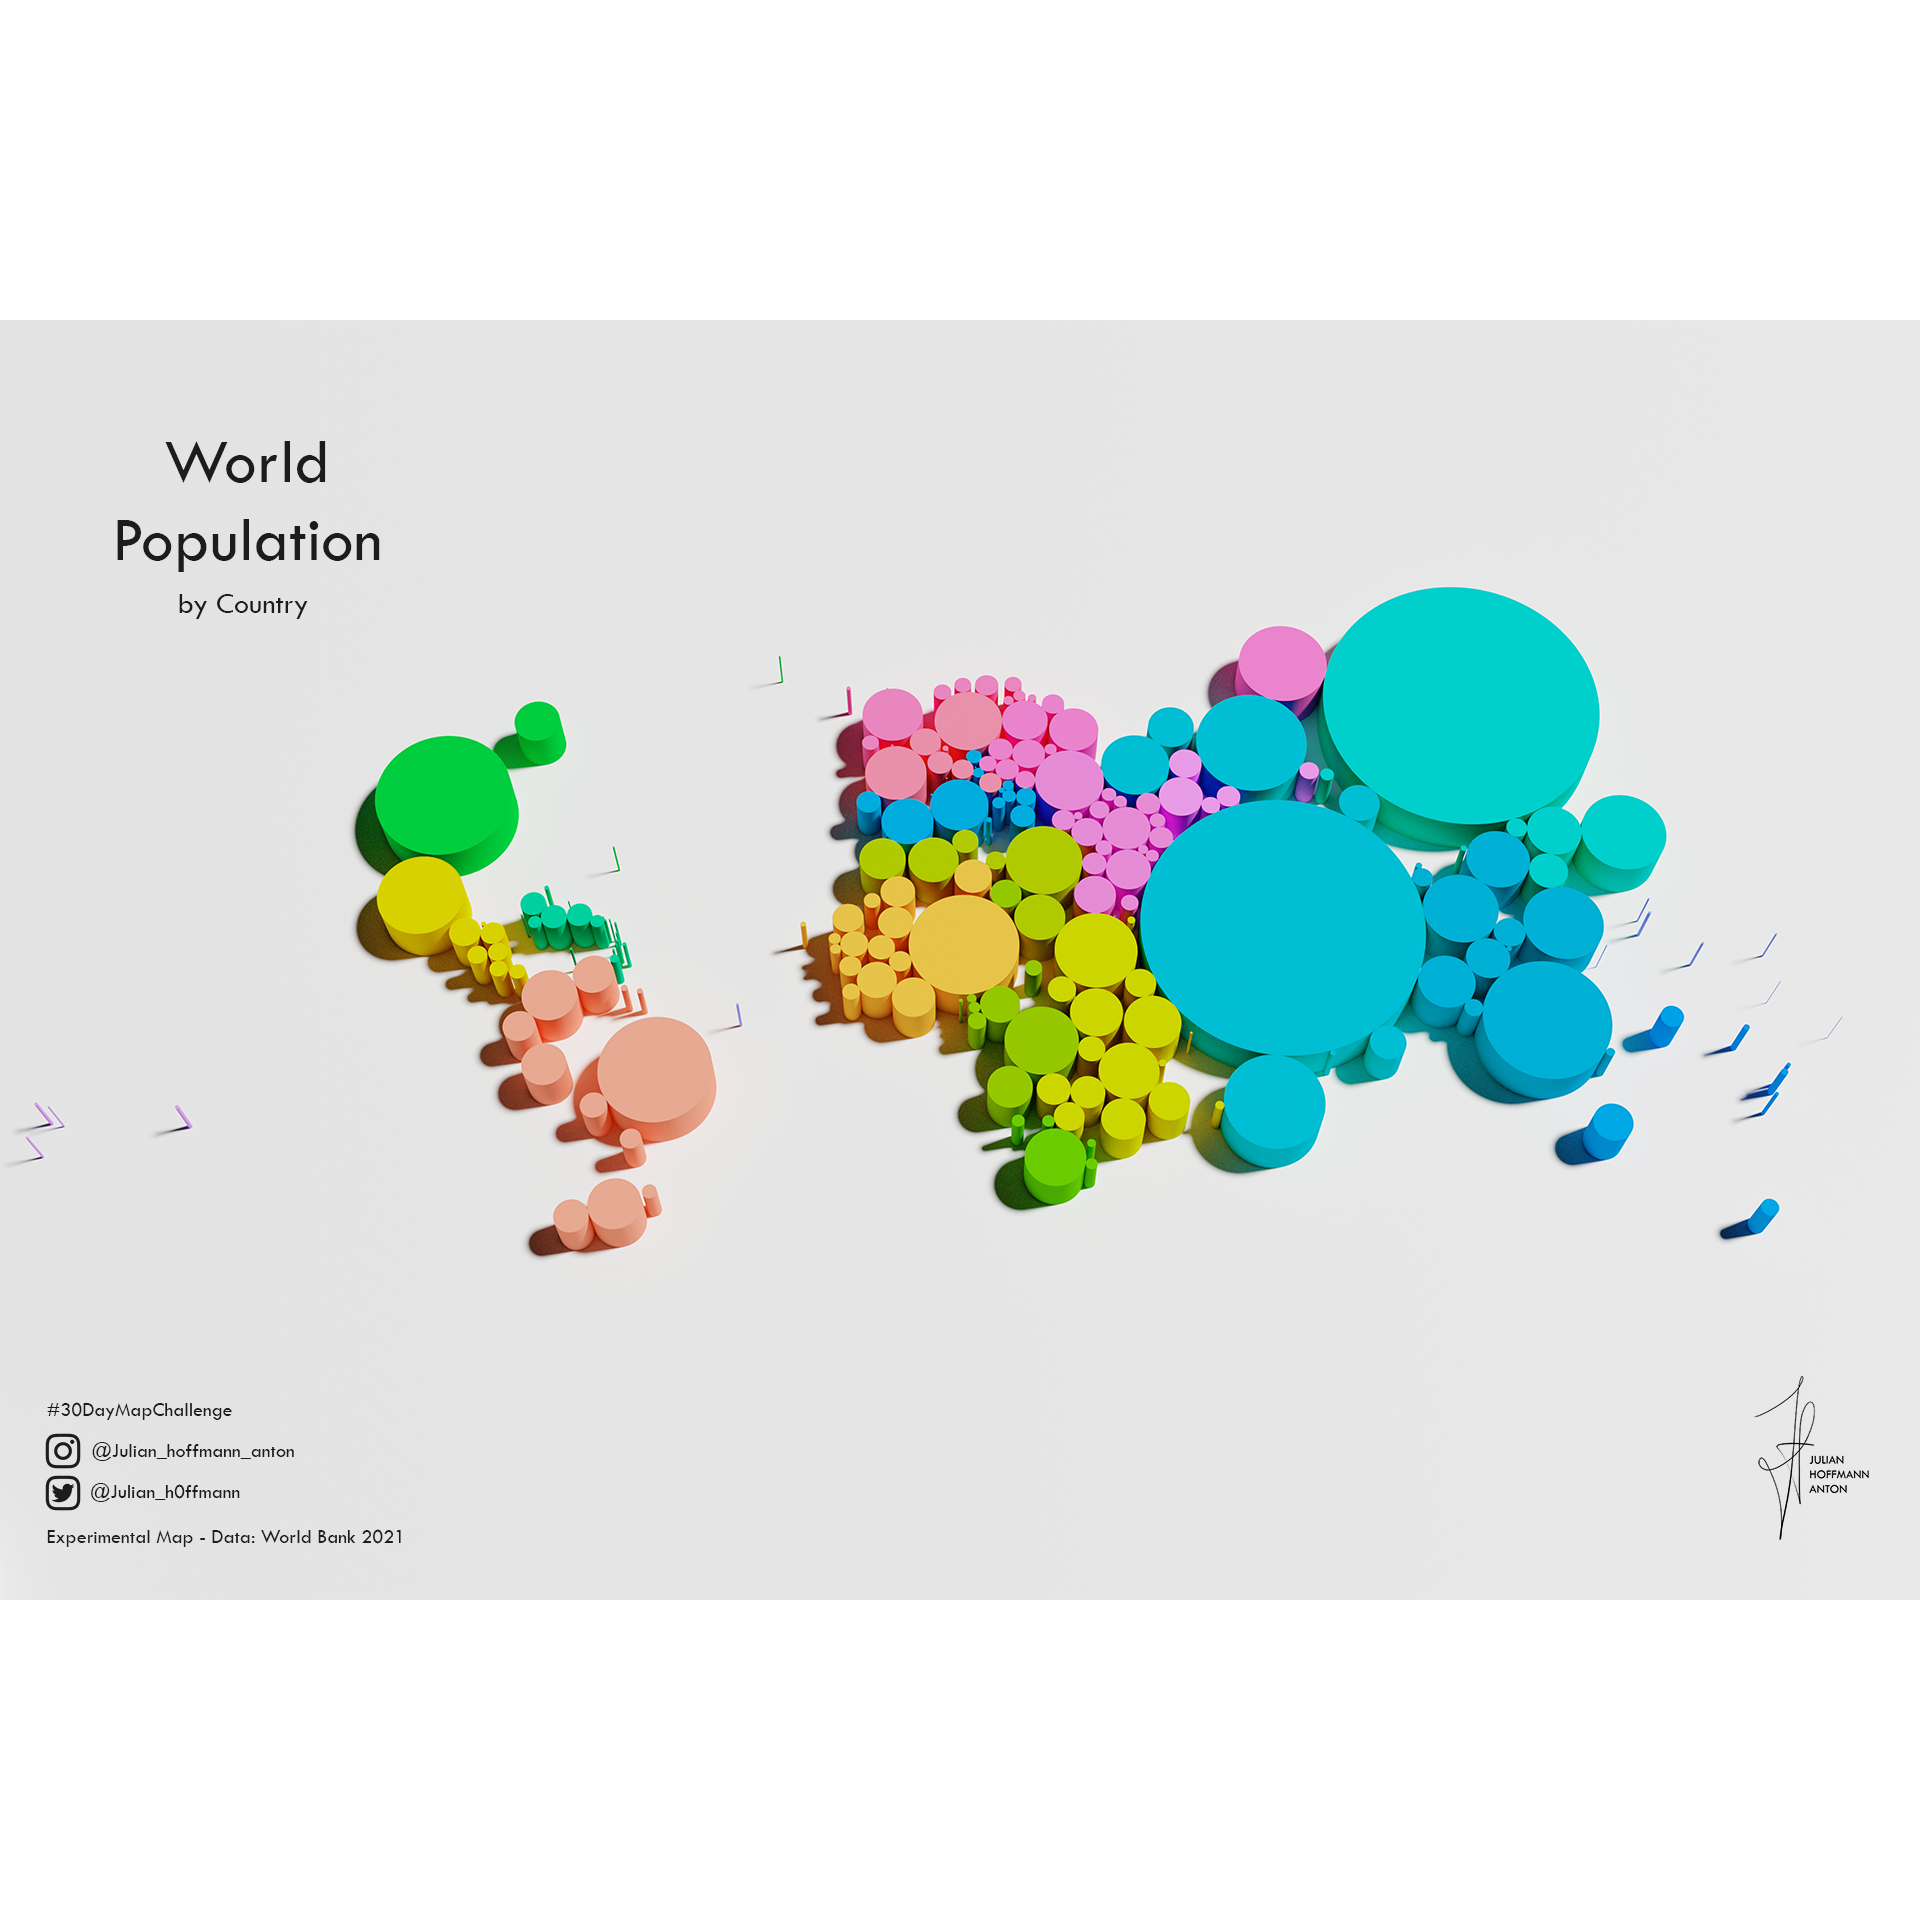
World Population
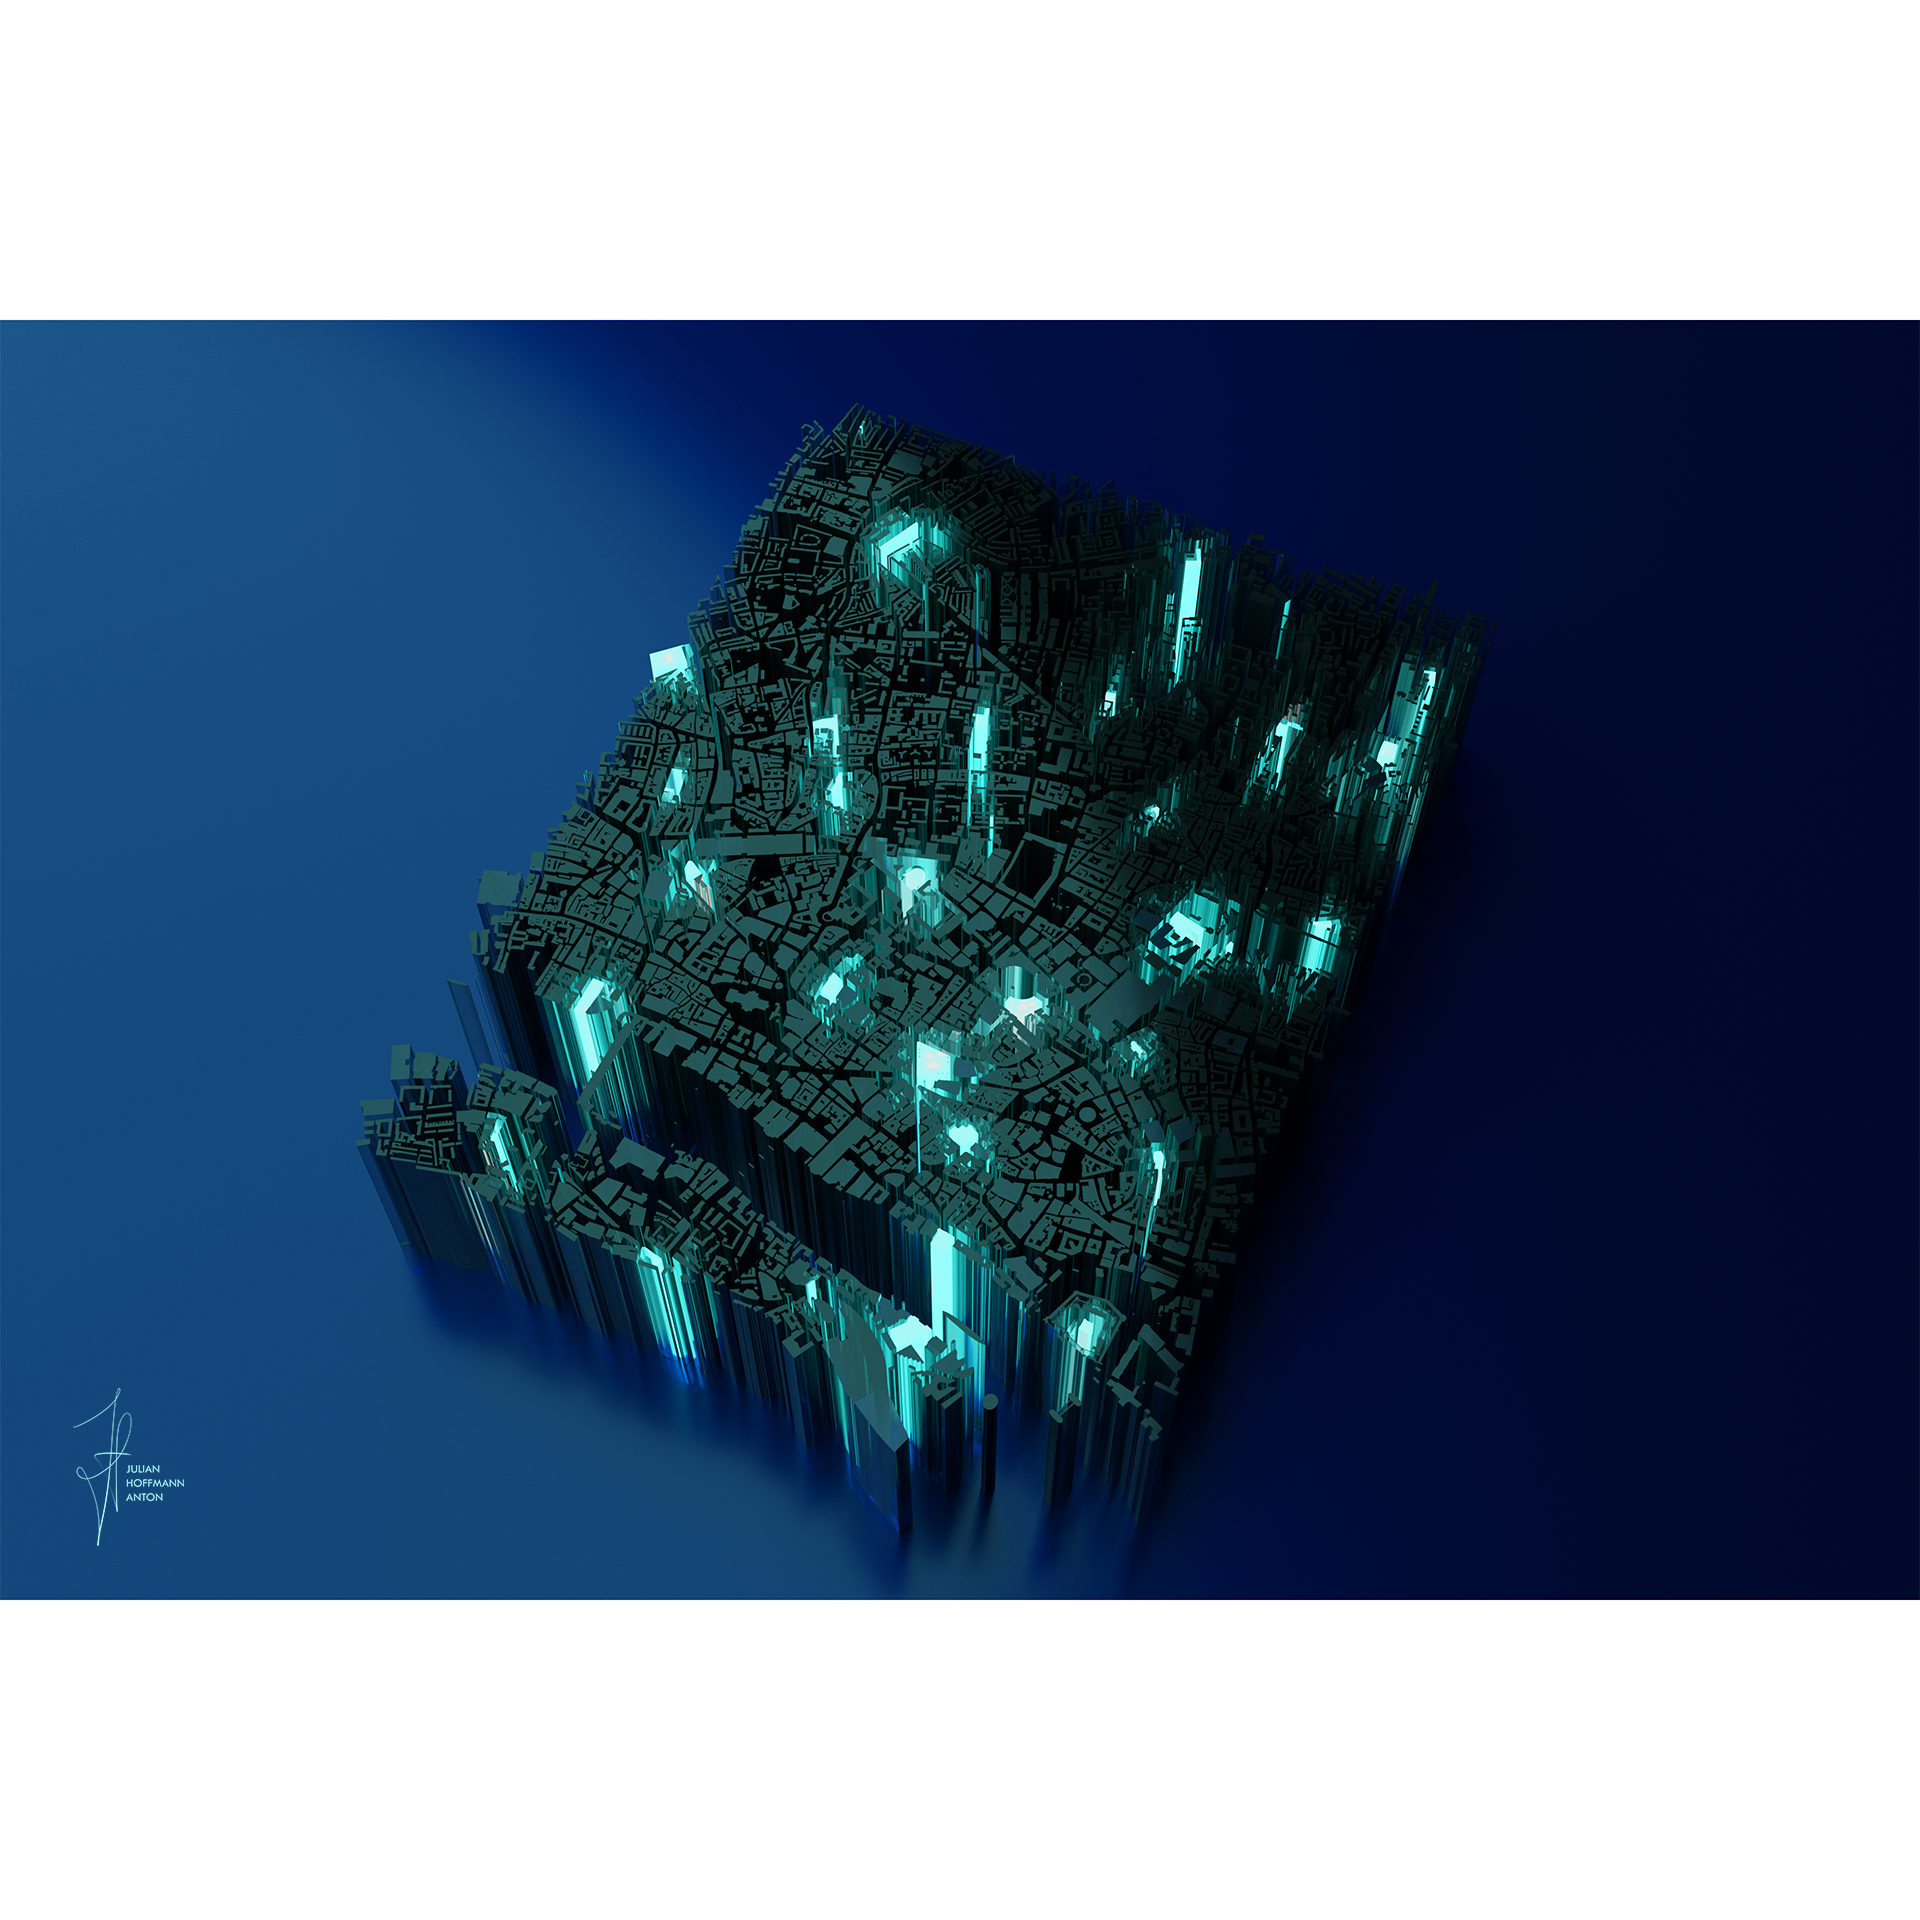
World Population
proj_17_urbox_v3bInsta_blueCB.png
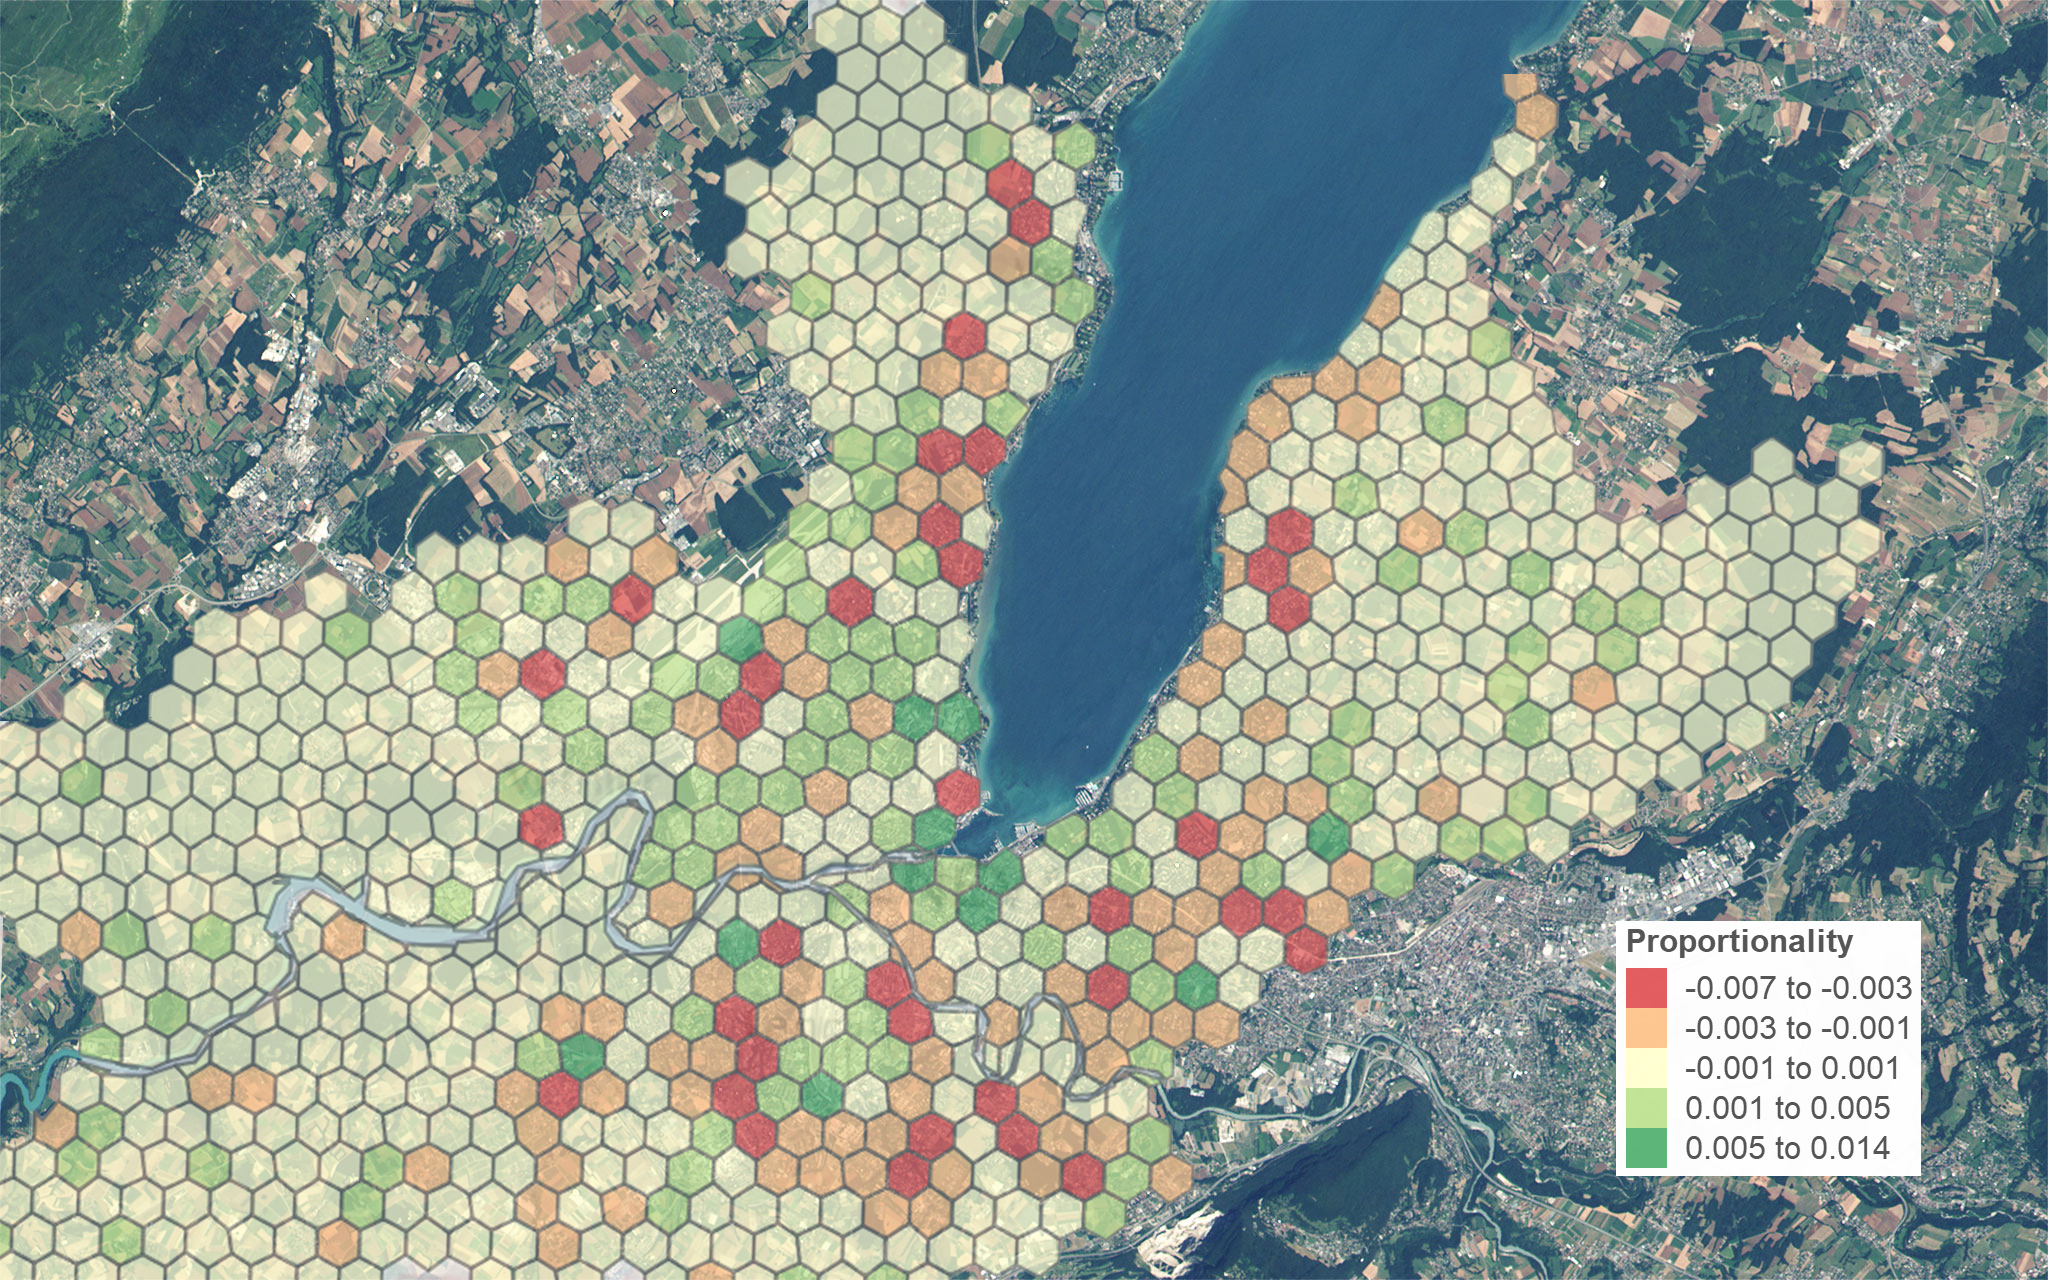
Transport Weak Spot Estimator
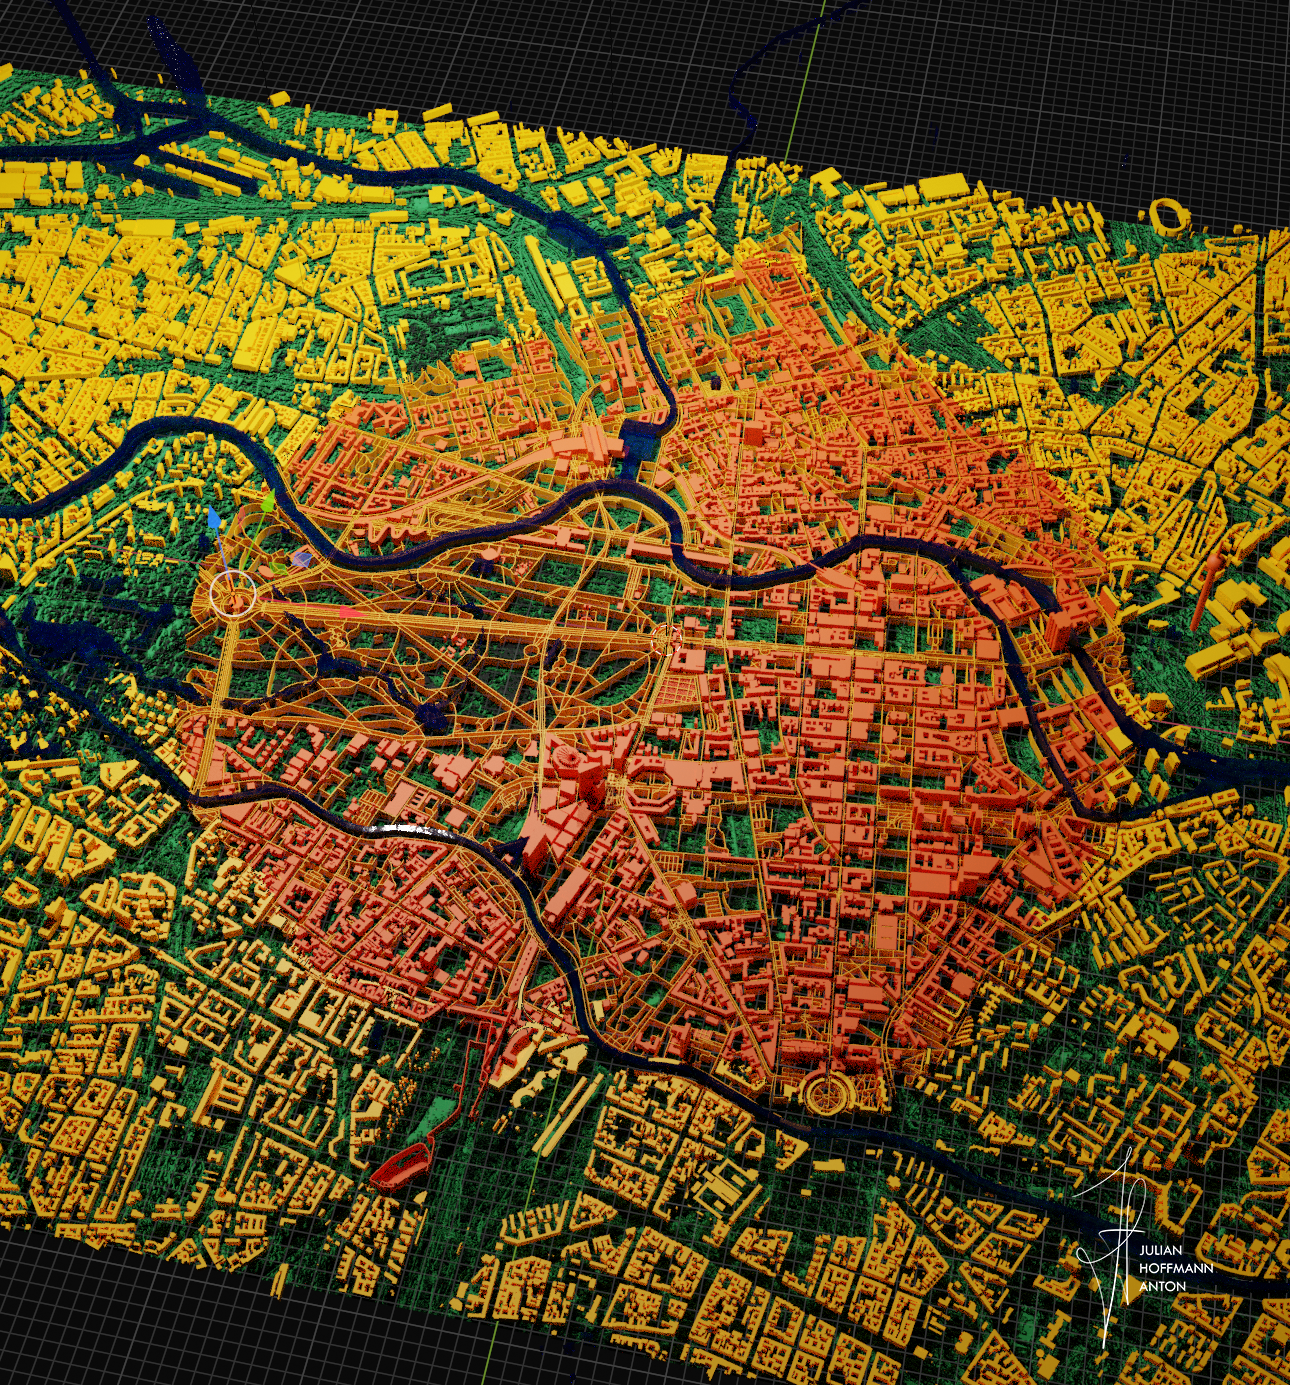
day_6_map_greener_Berliner_vJH_HD_twitter2.png
first_london_render38_zoom_C_bis_insta_CB.png
map_day_18_WATER_vJH_islands__HD_blue.png
map_day_cover_cityv3.png
map_day_22_boundaries_vJH_HD_top_black.png
map_day_2_lines_vJH_HD_side_black.png
interactive_index_bg_v4 _screenshot.png
day_6_map_greener_Berliner_vJH_HD_behind the scenesbehindthe.png
map_day_9_monochrome_vJH__HD_vzoom.png
world_population_v2_JH_behind.png
info
prev / next