Mind-bending 3D Maps | Showreel
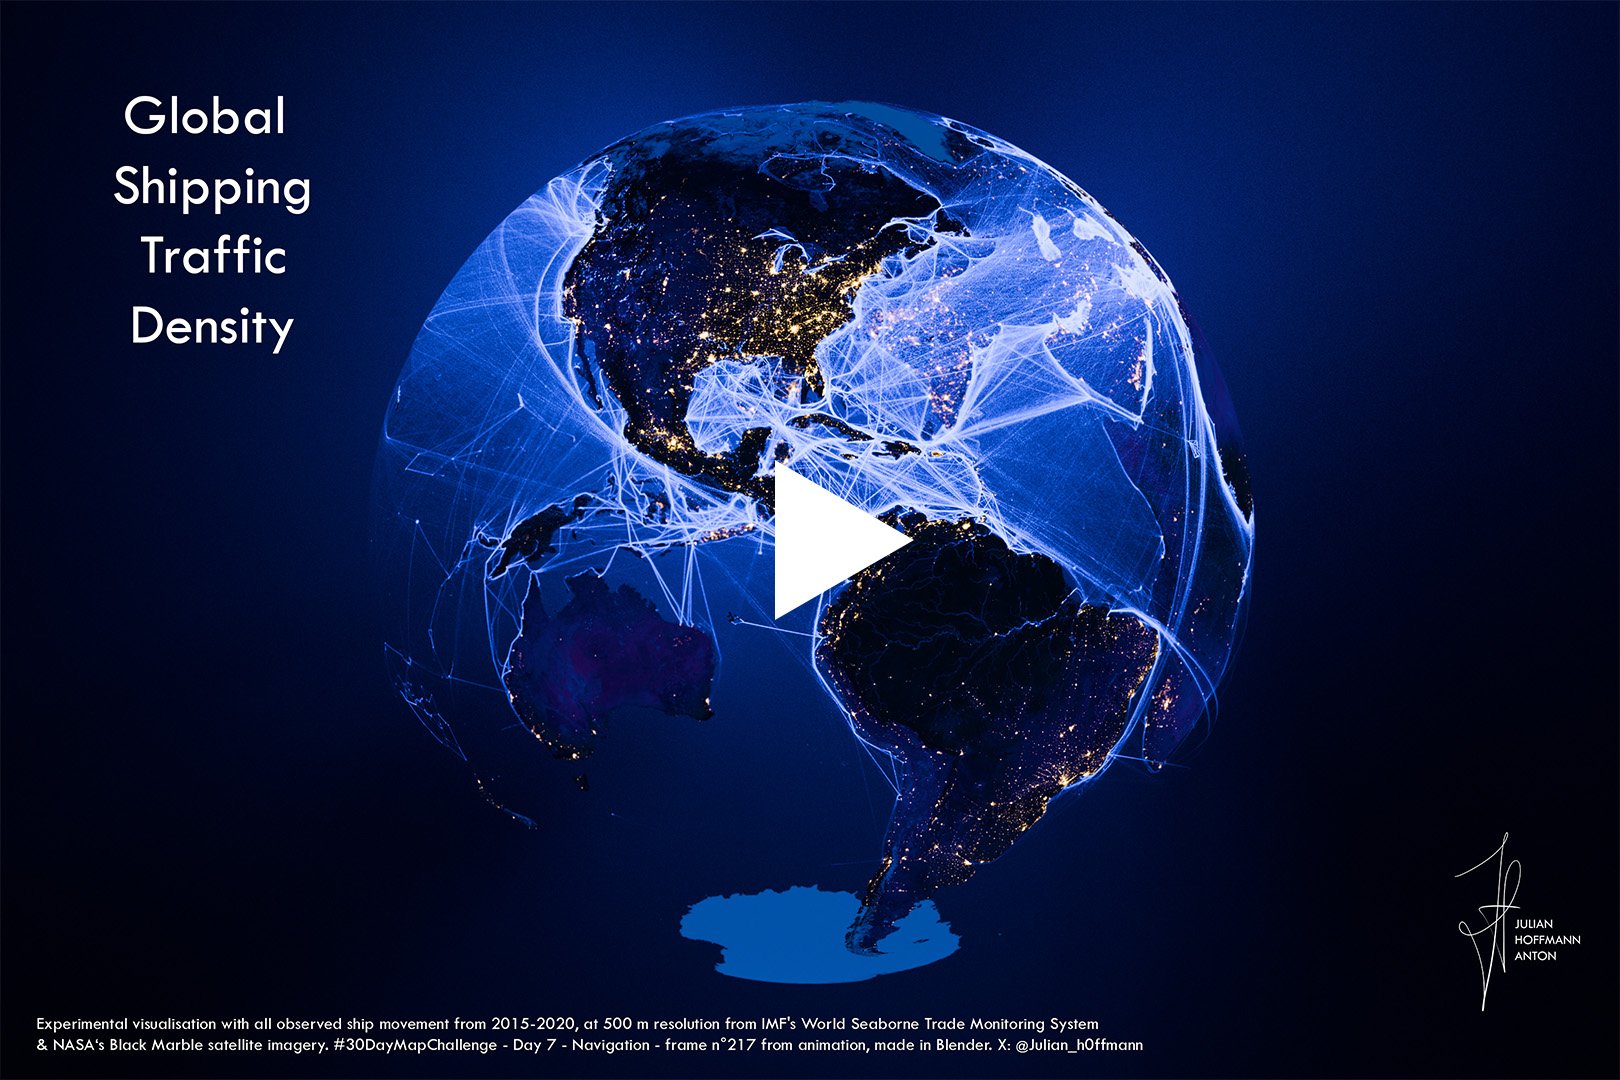
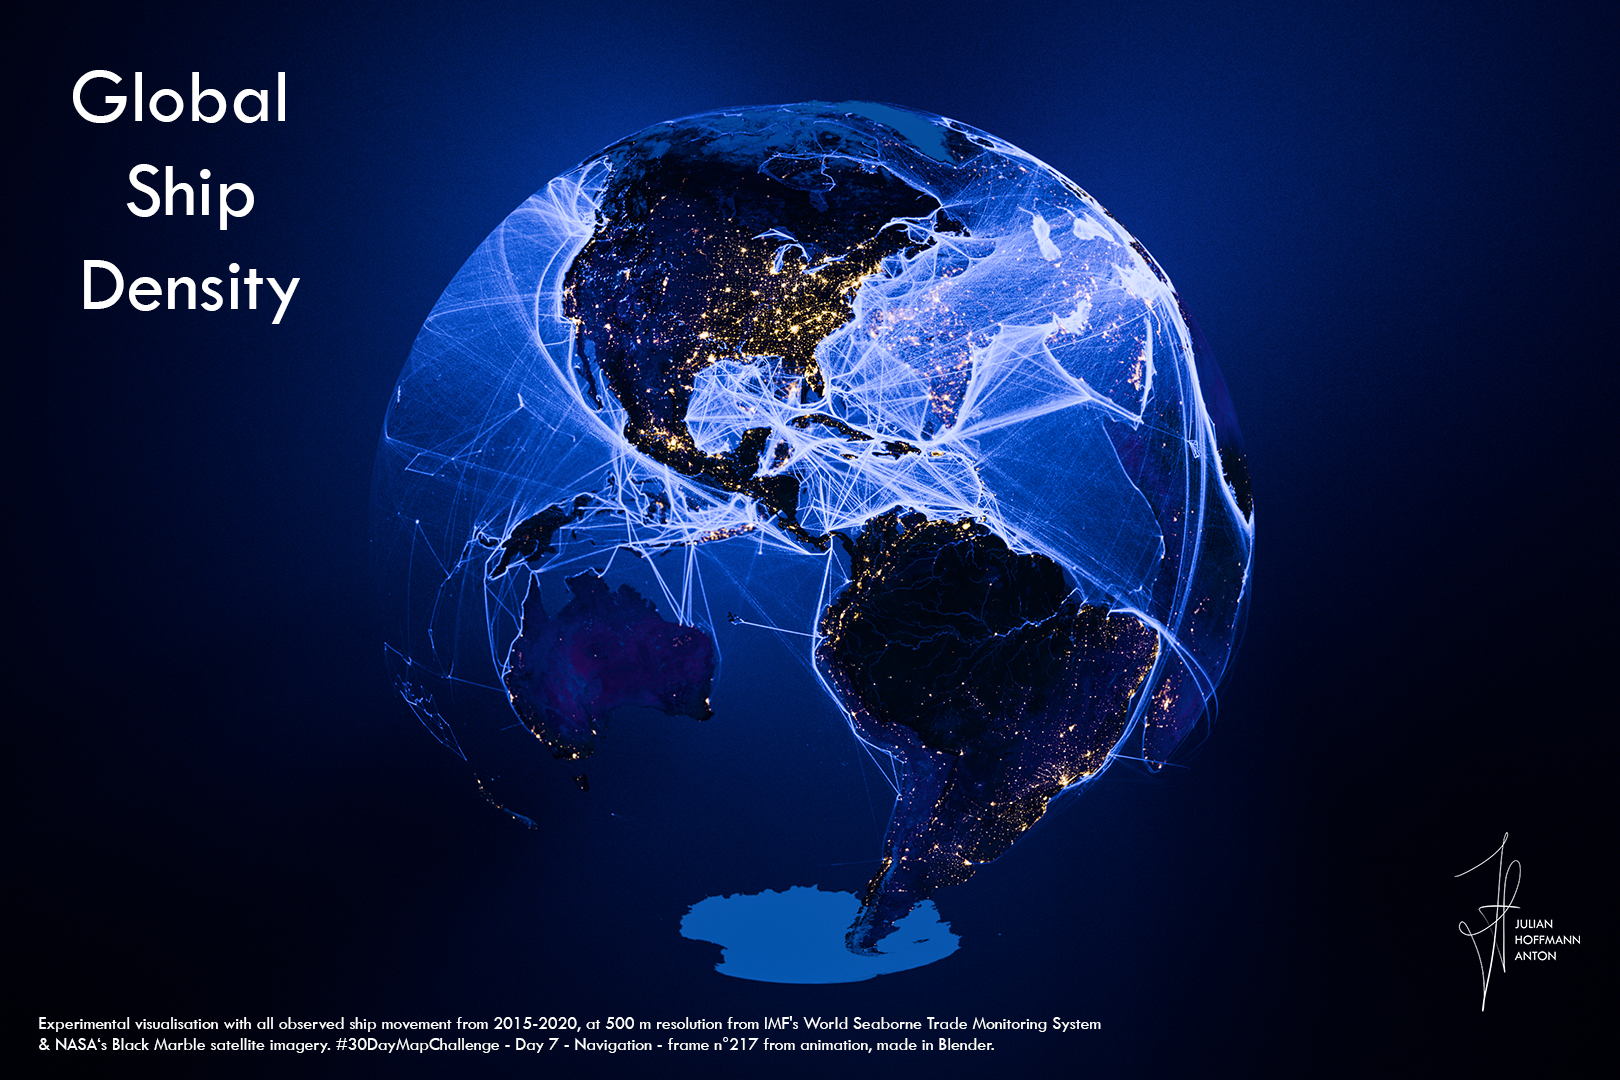
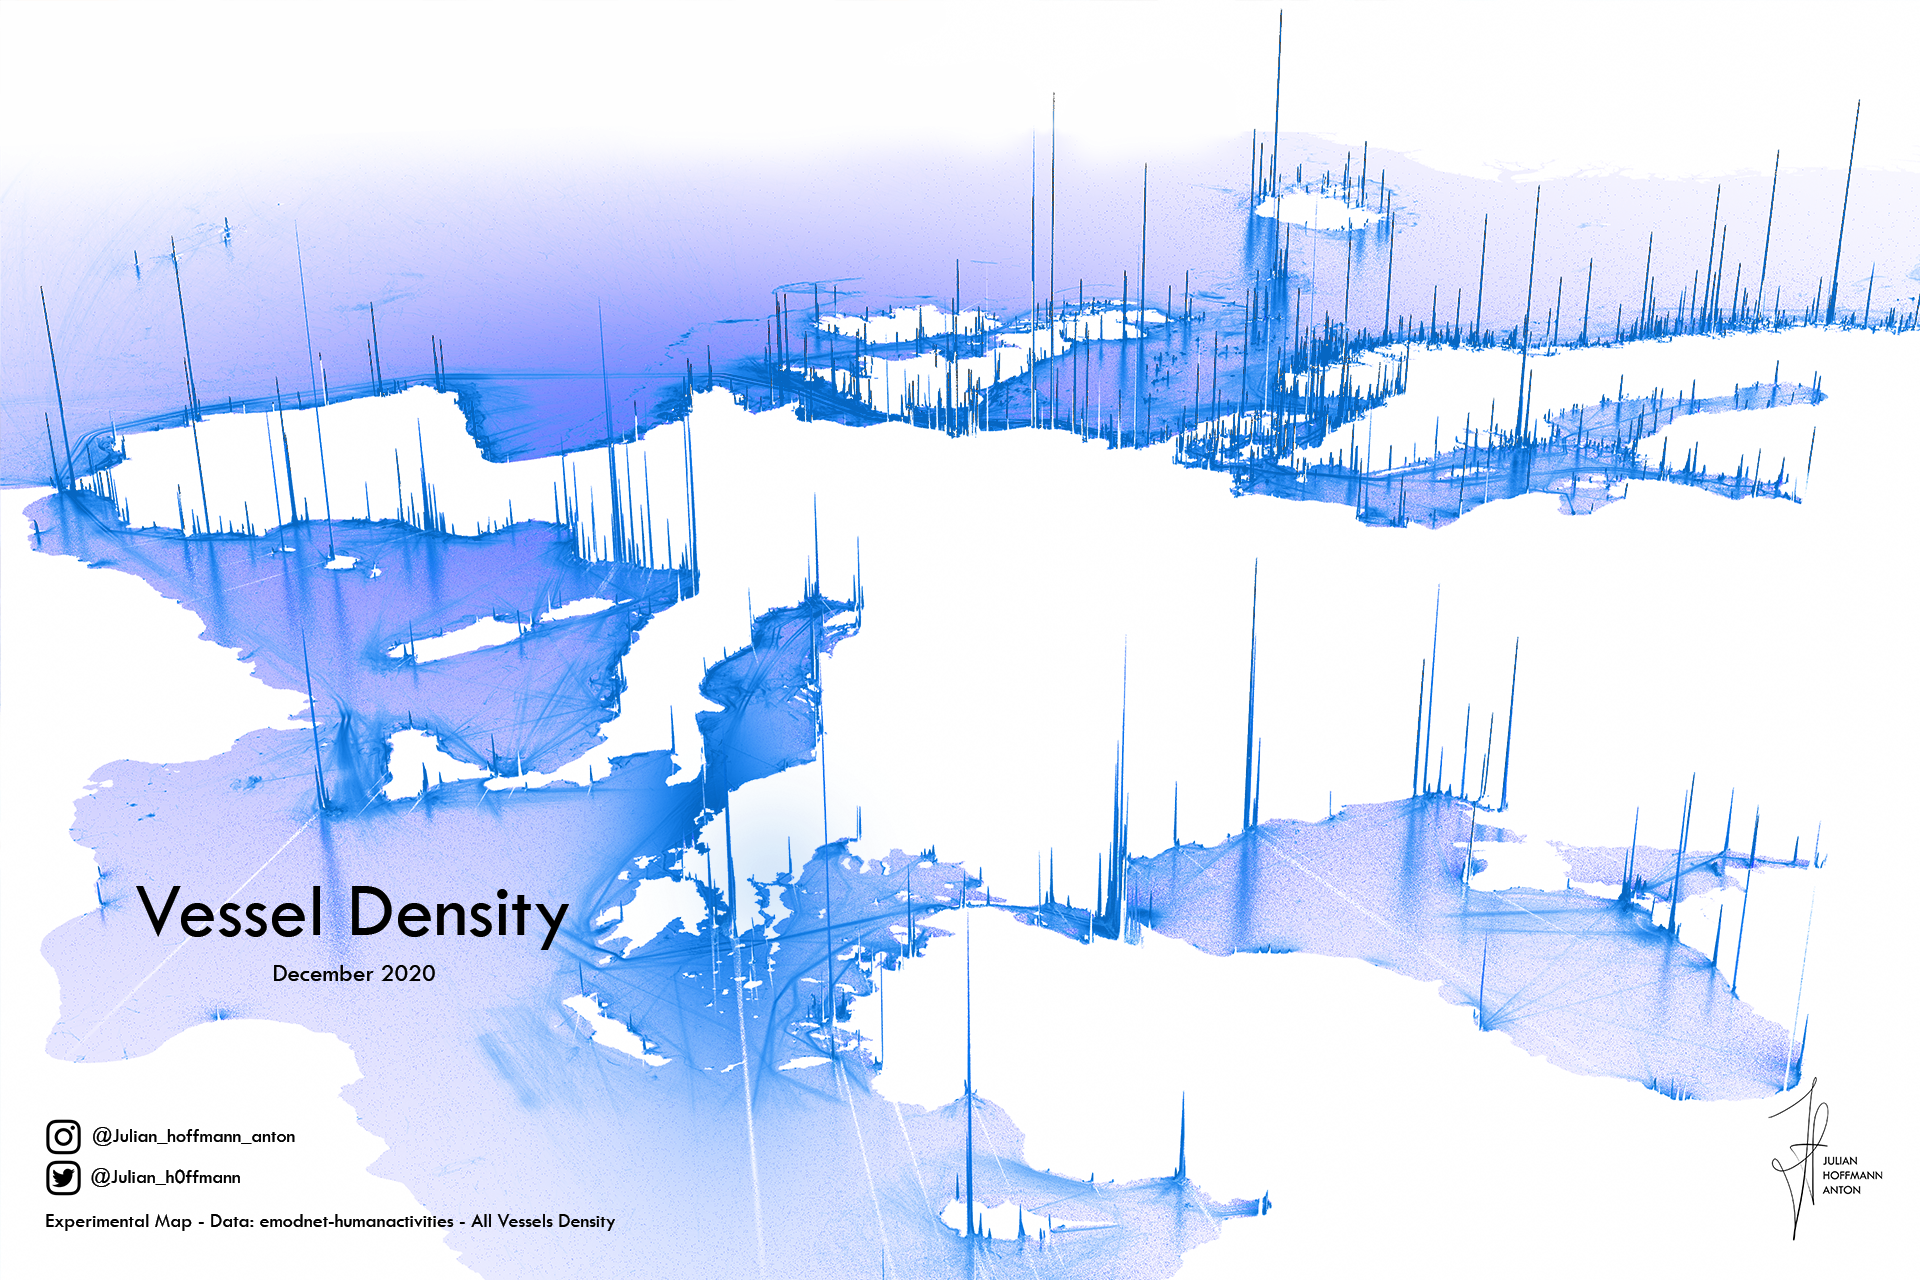
A Clear View of Global Shipping Traffic
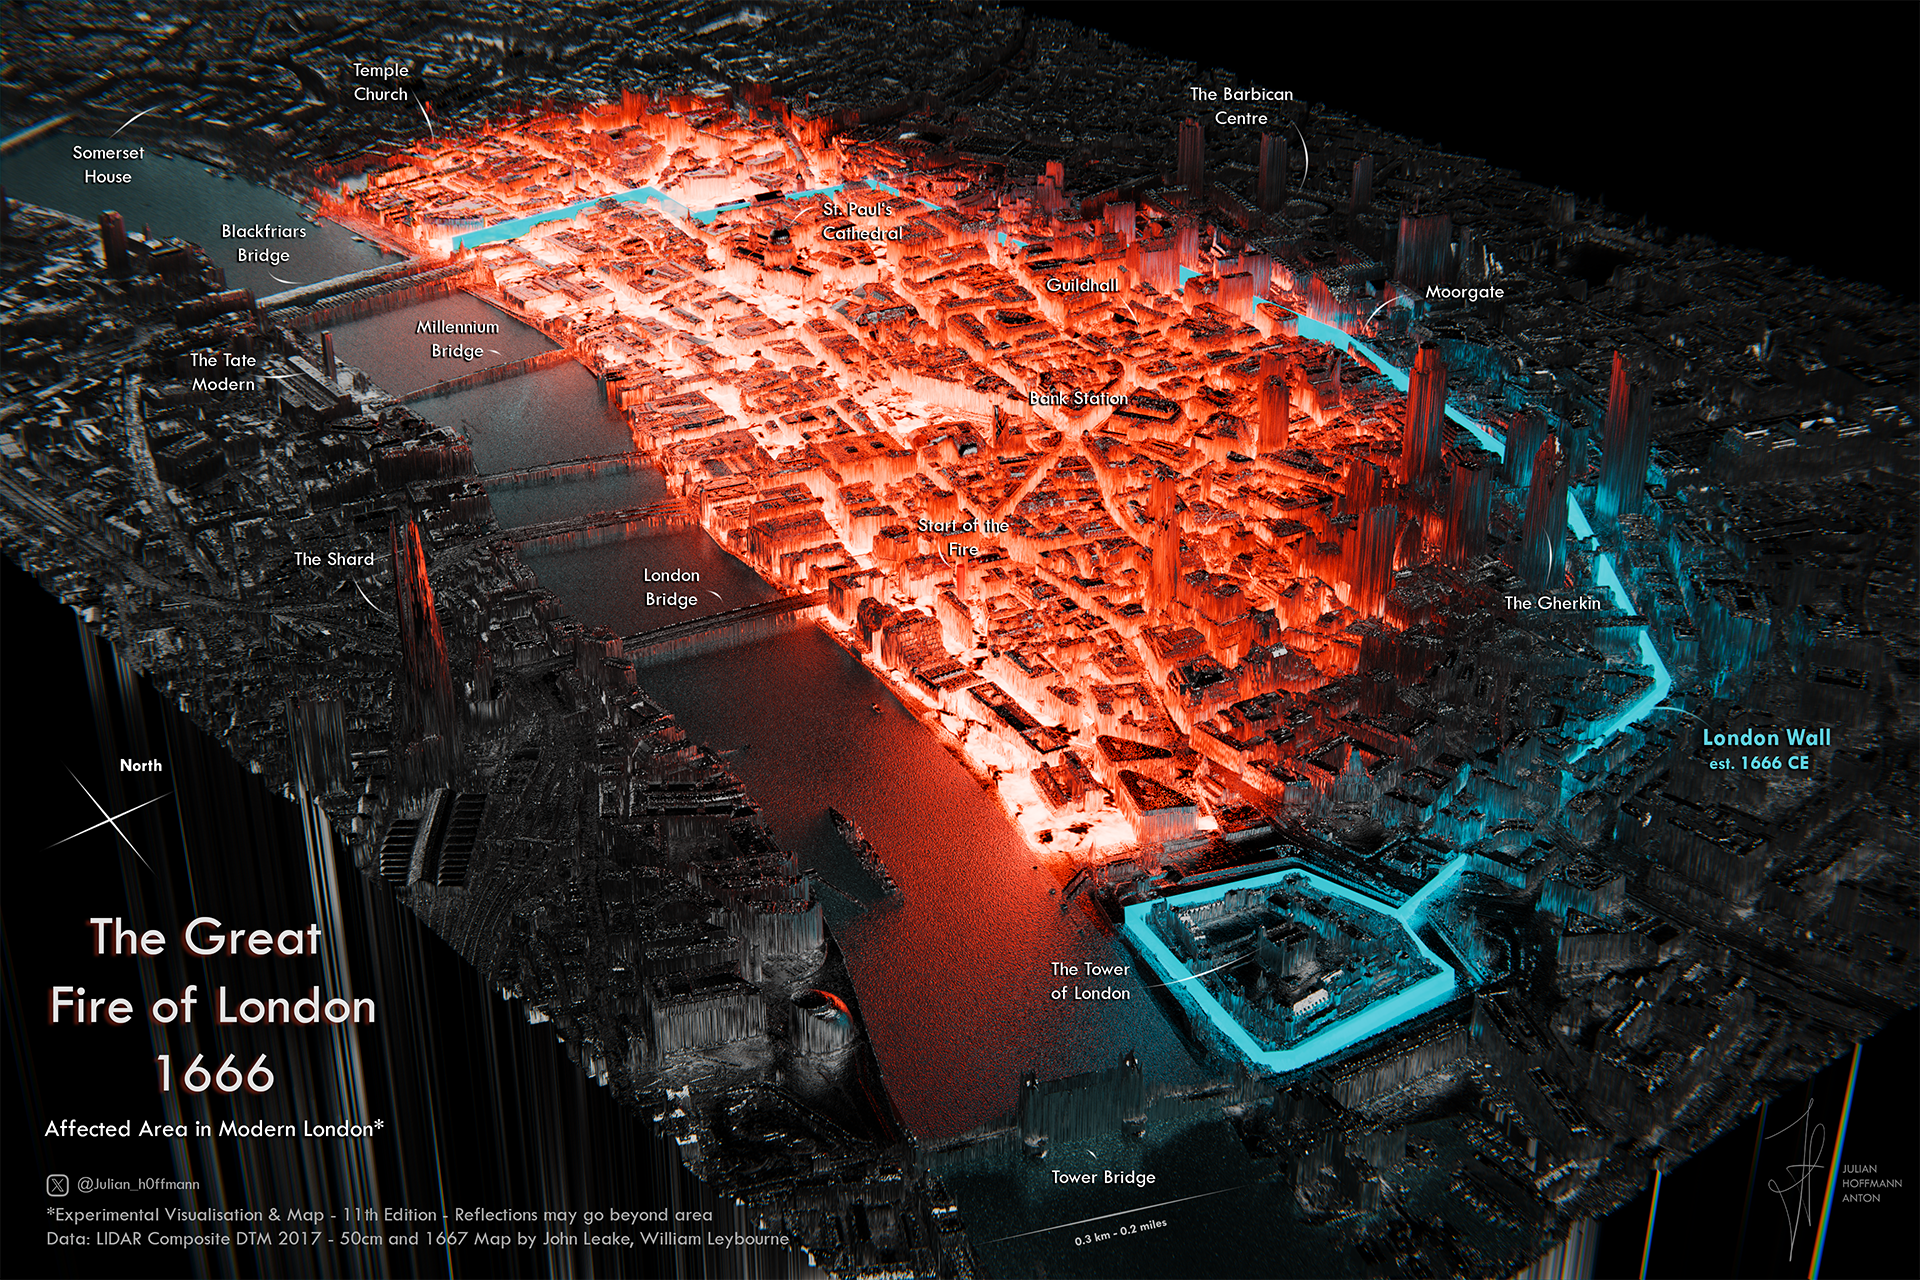
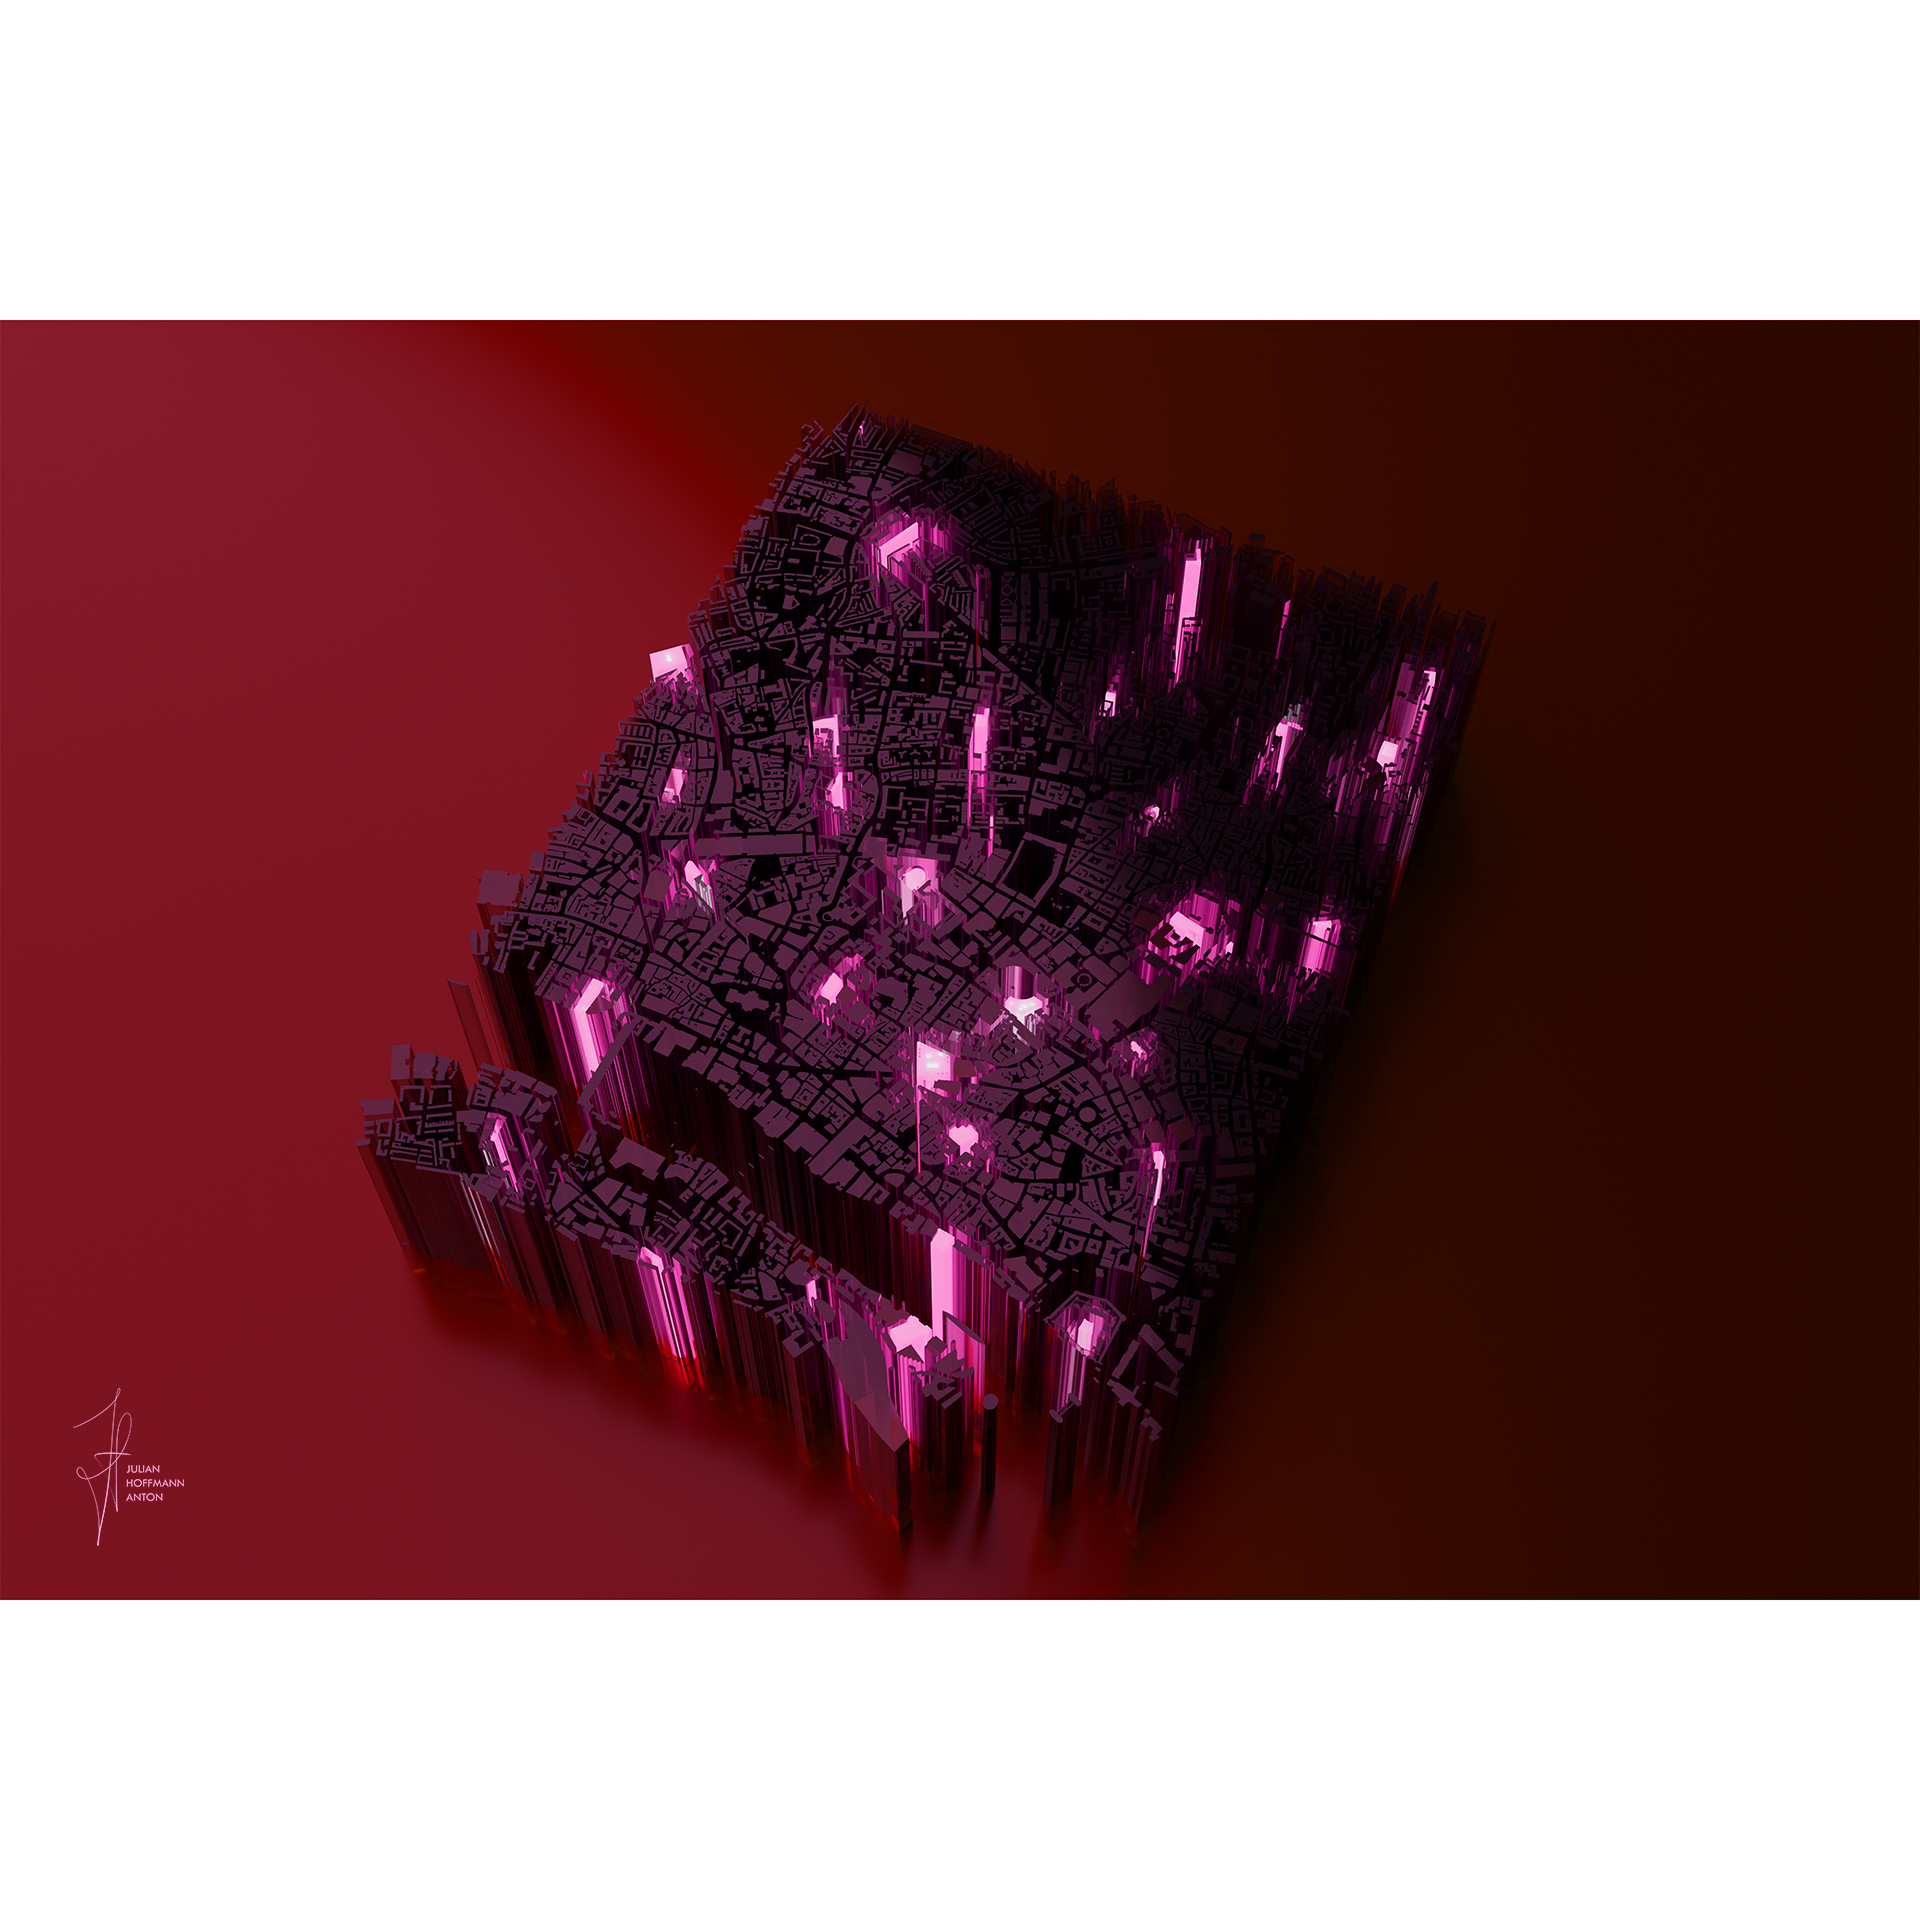
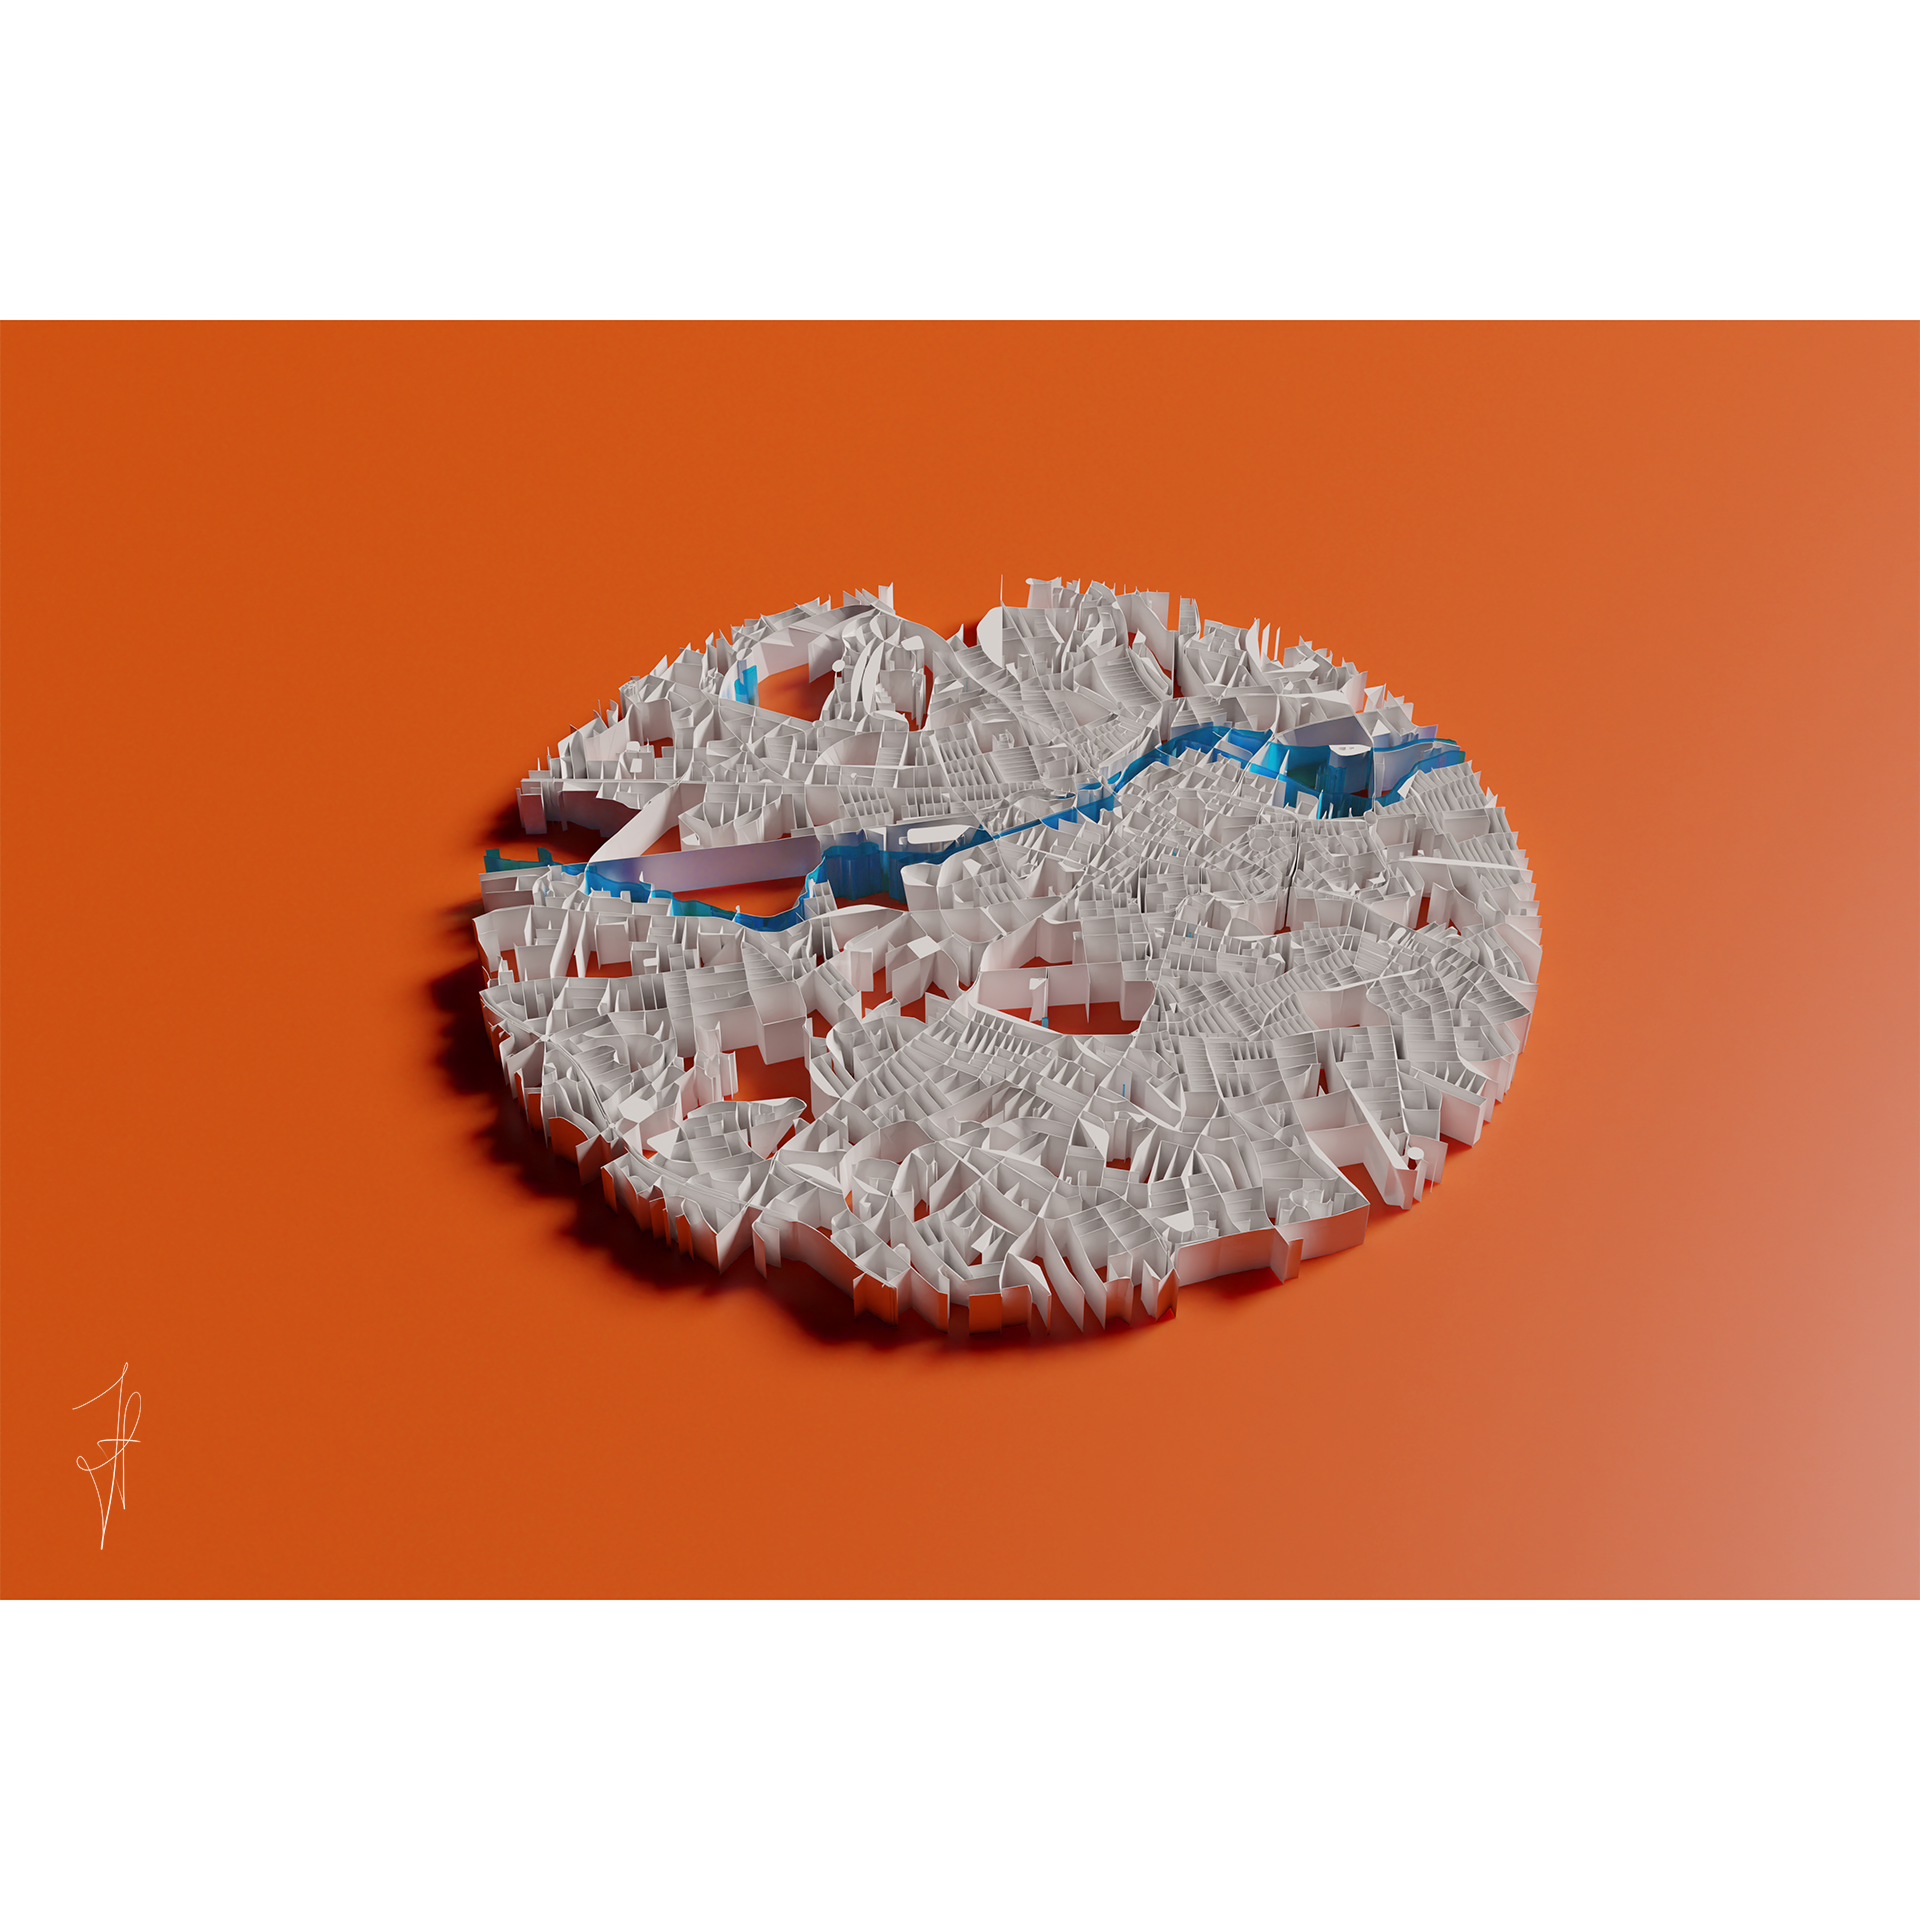
The Great Fire of London (1666)
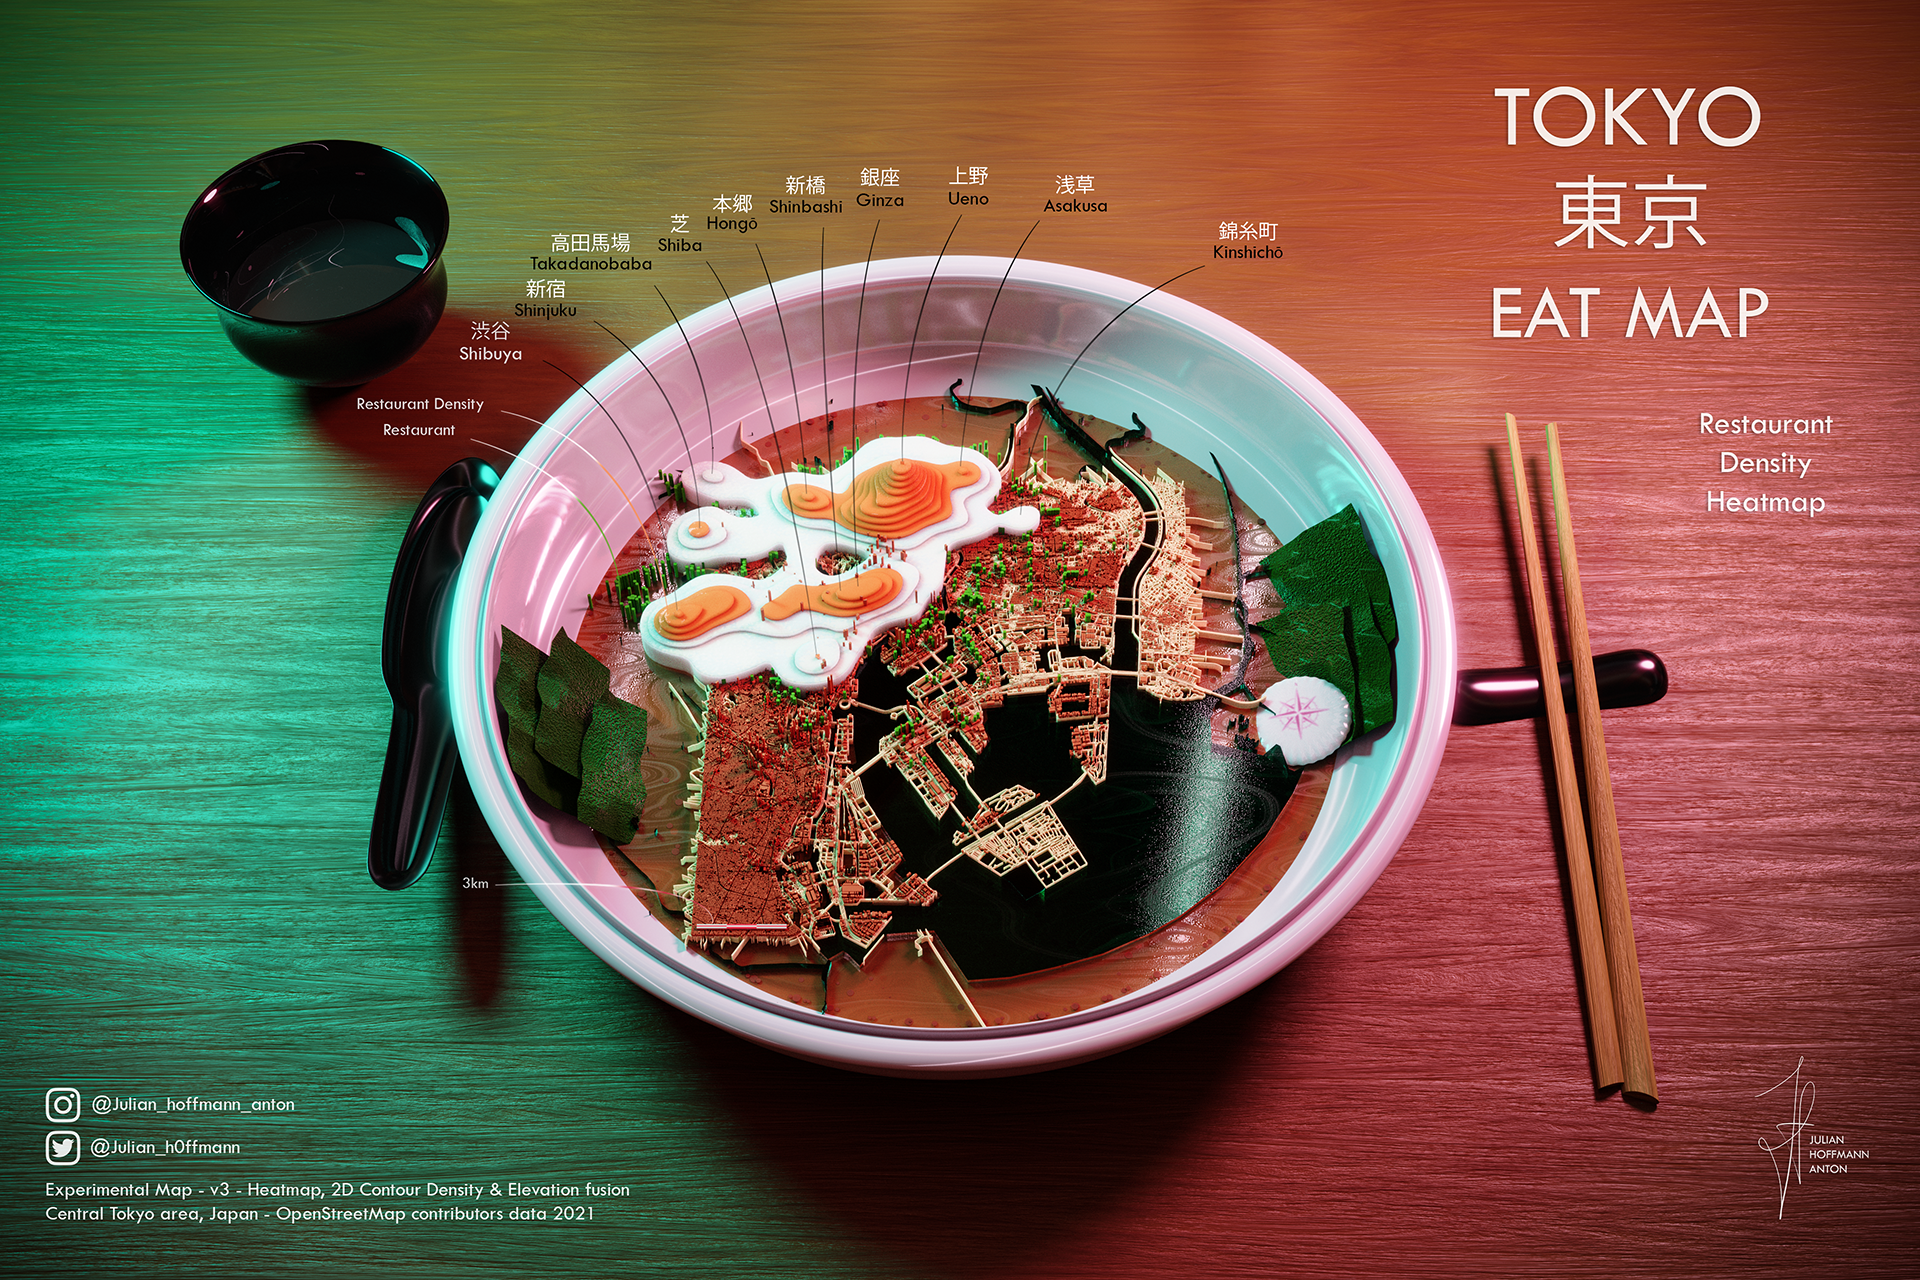
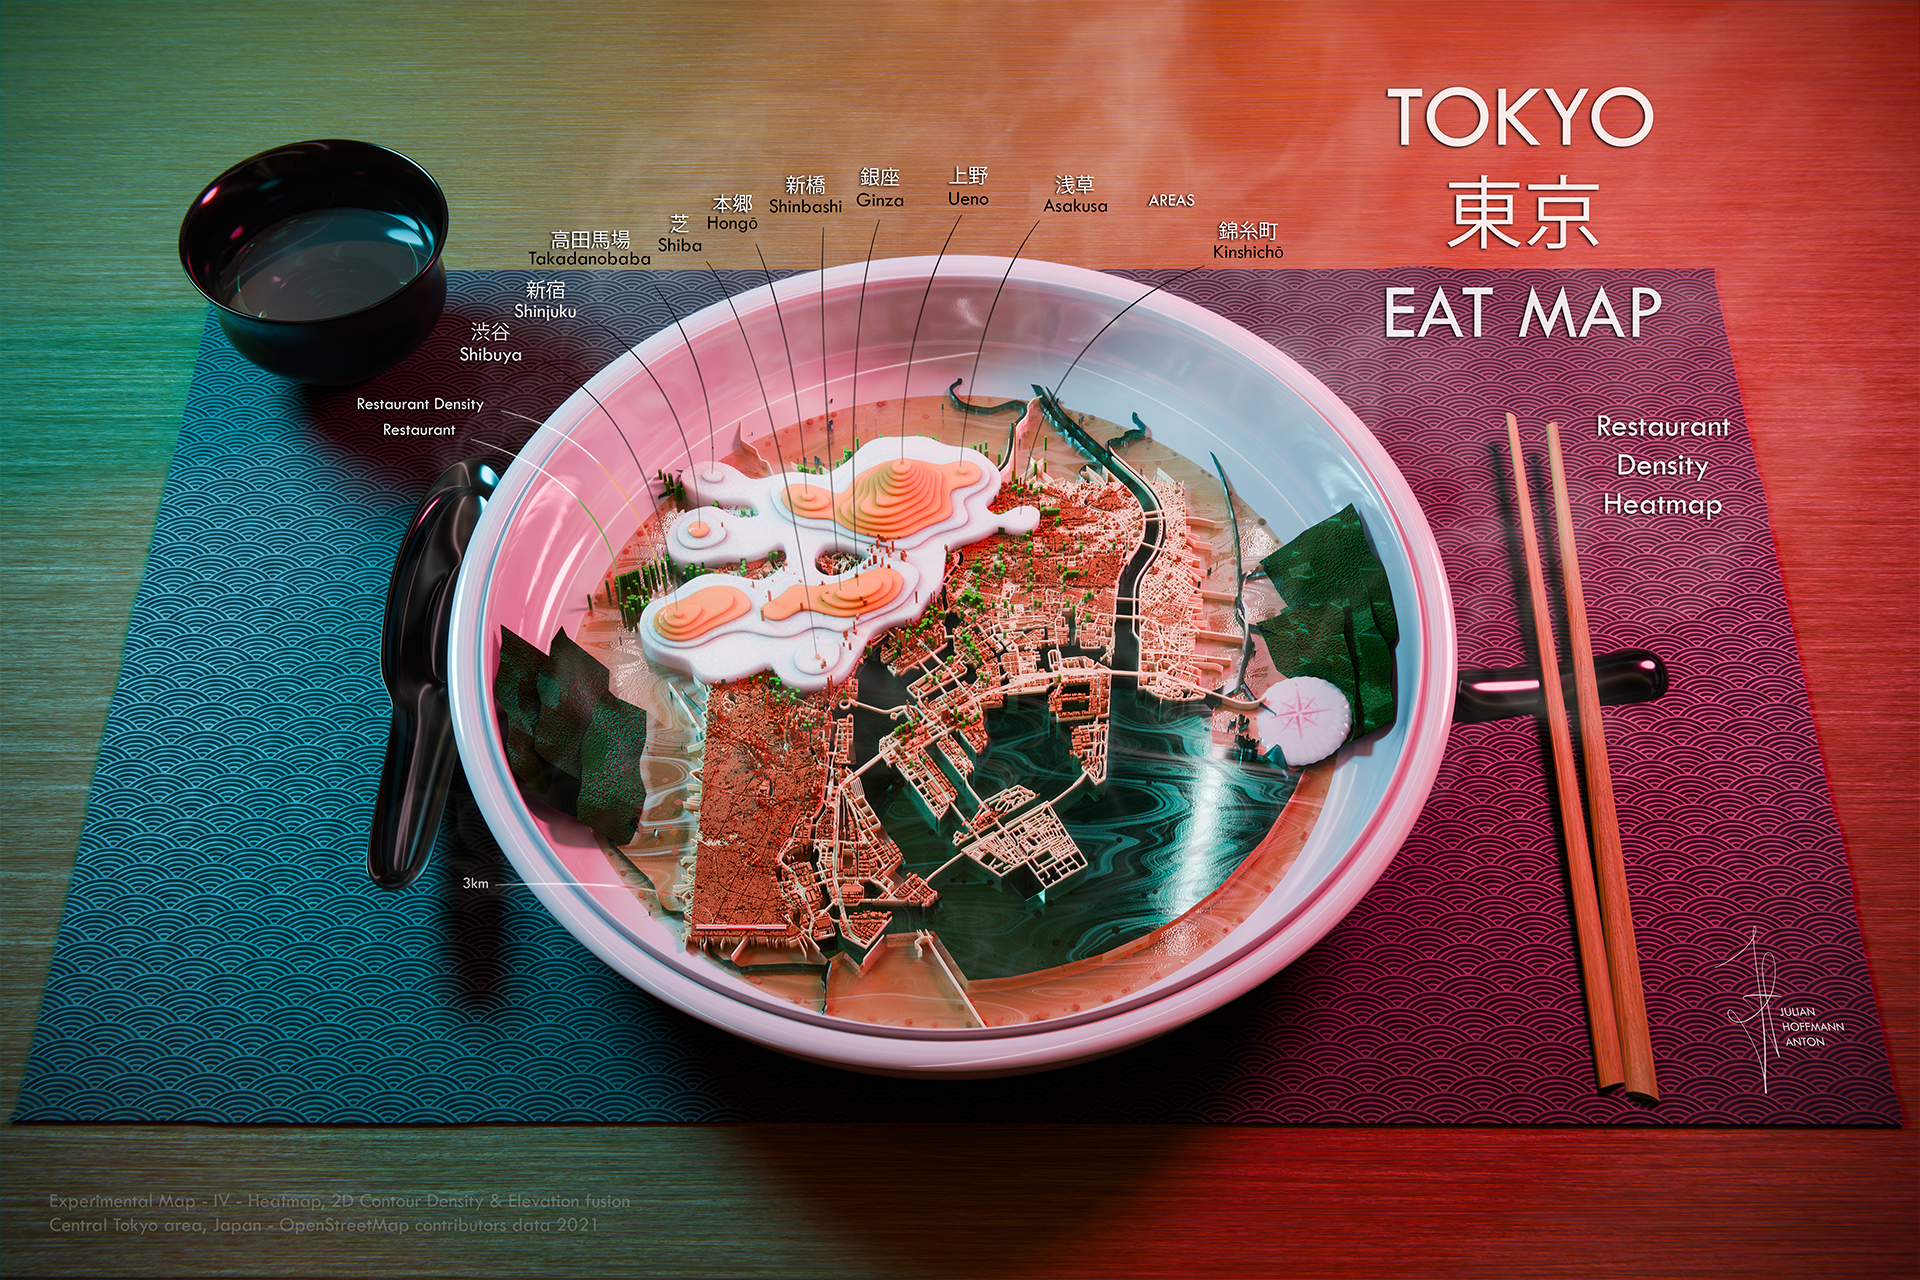
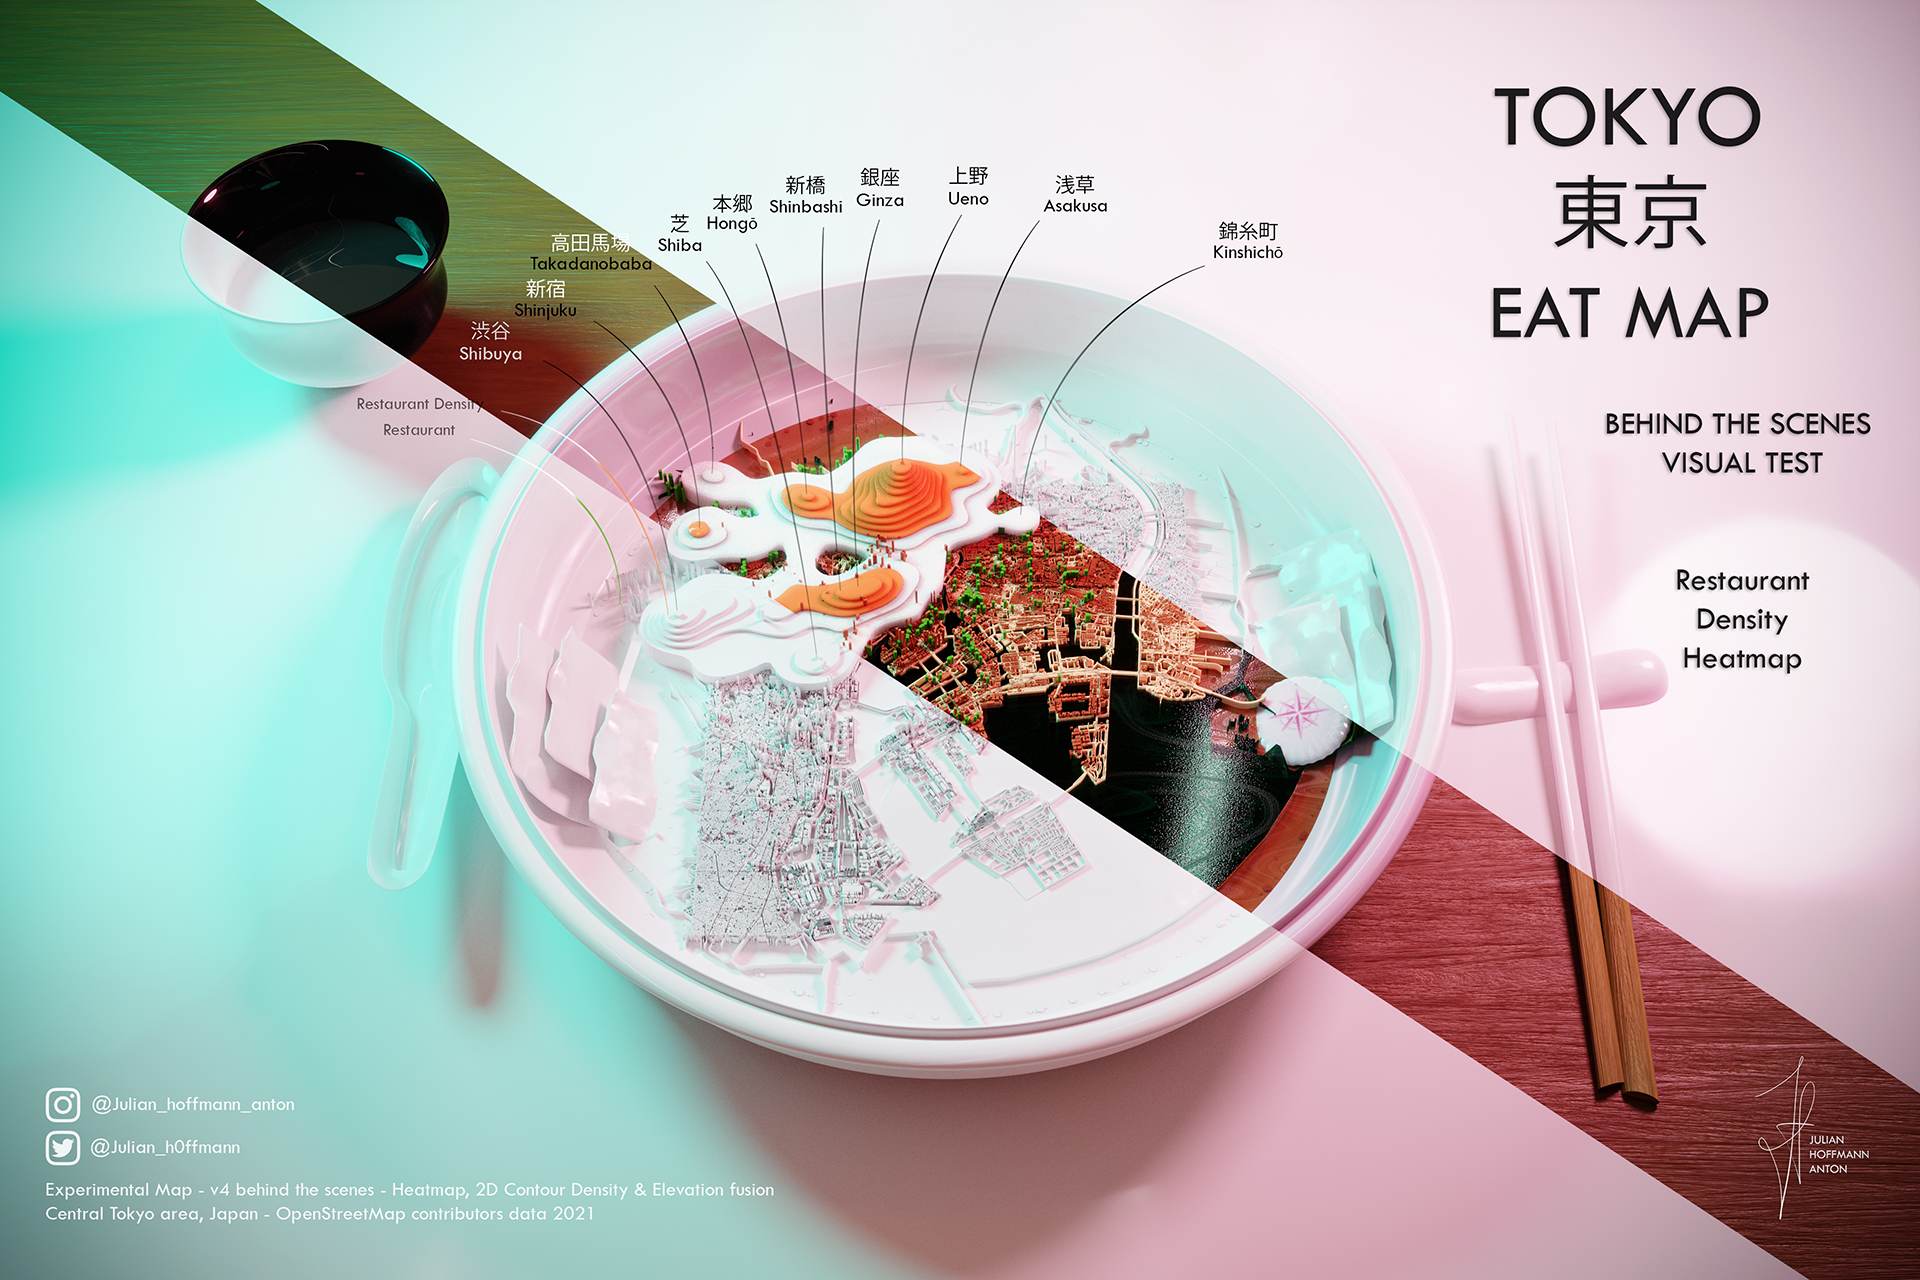
Tokyo Eat Map
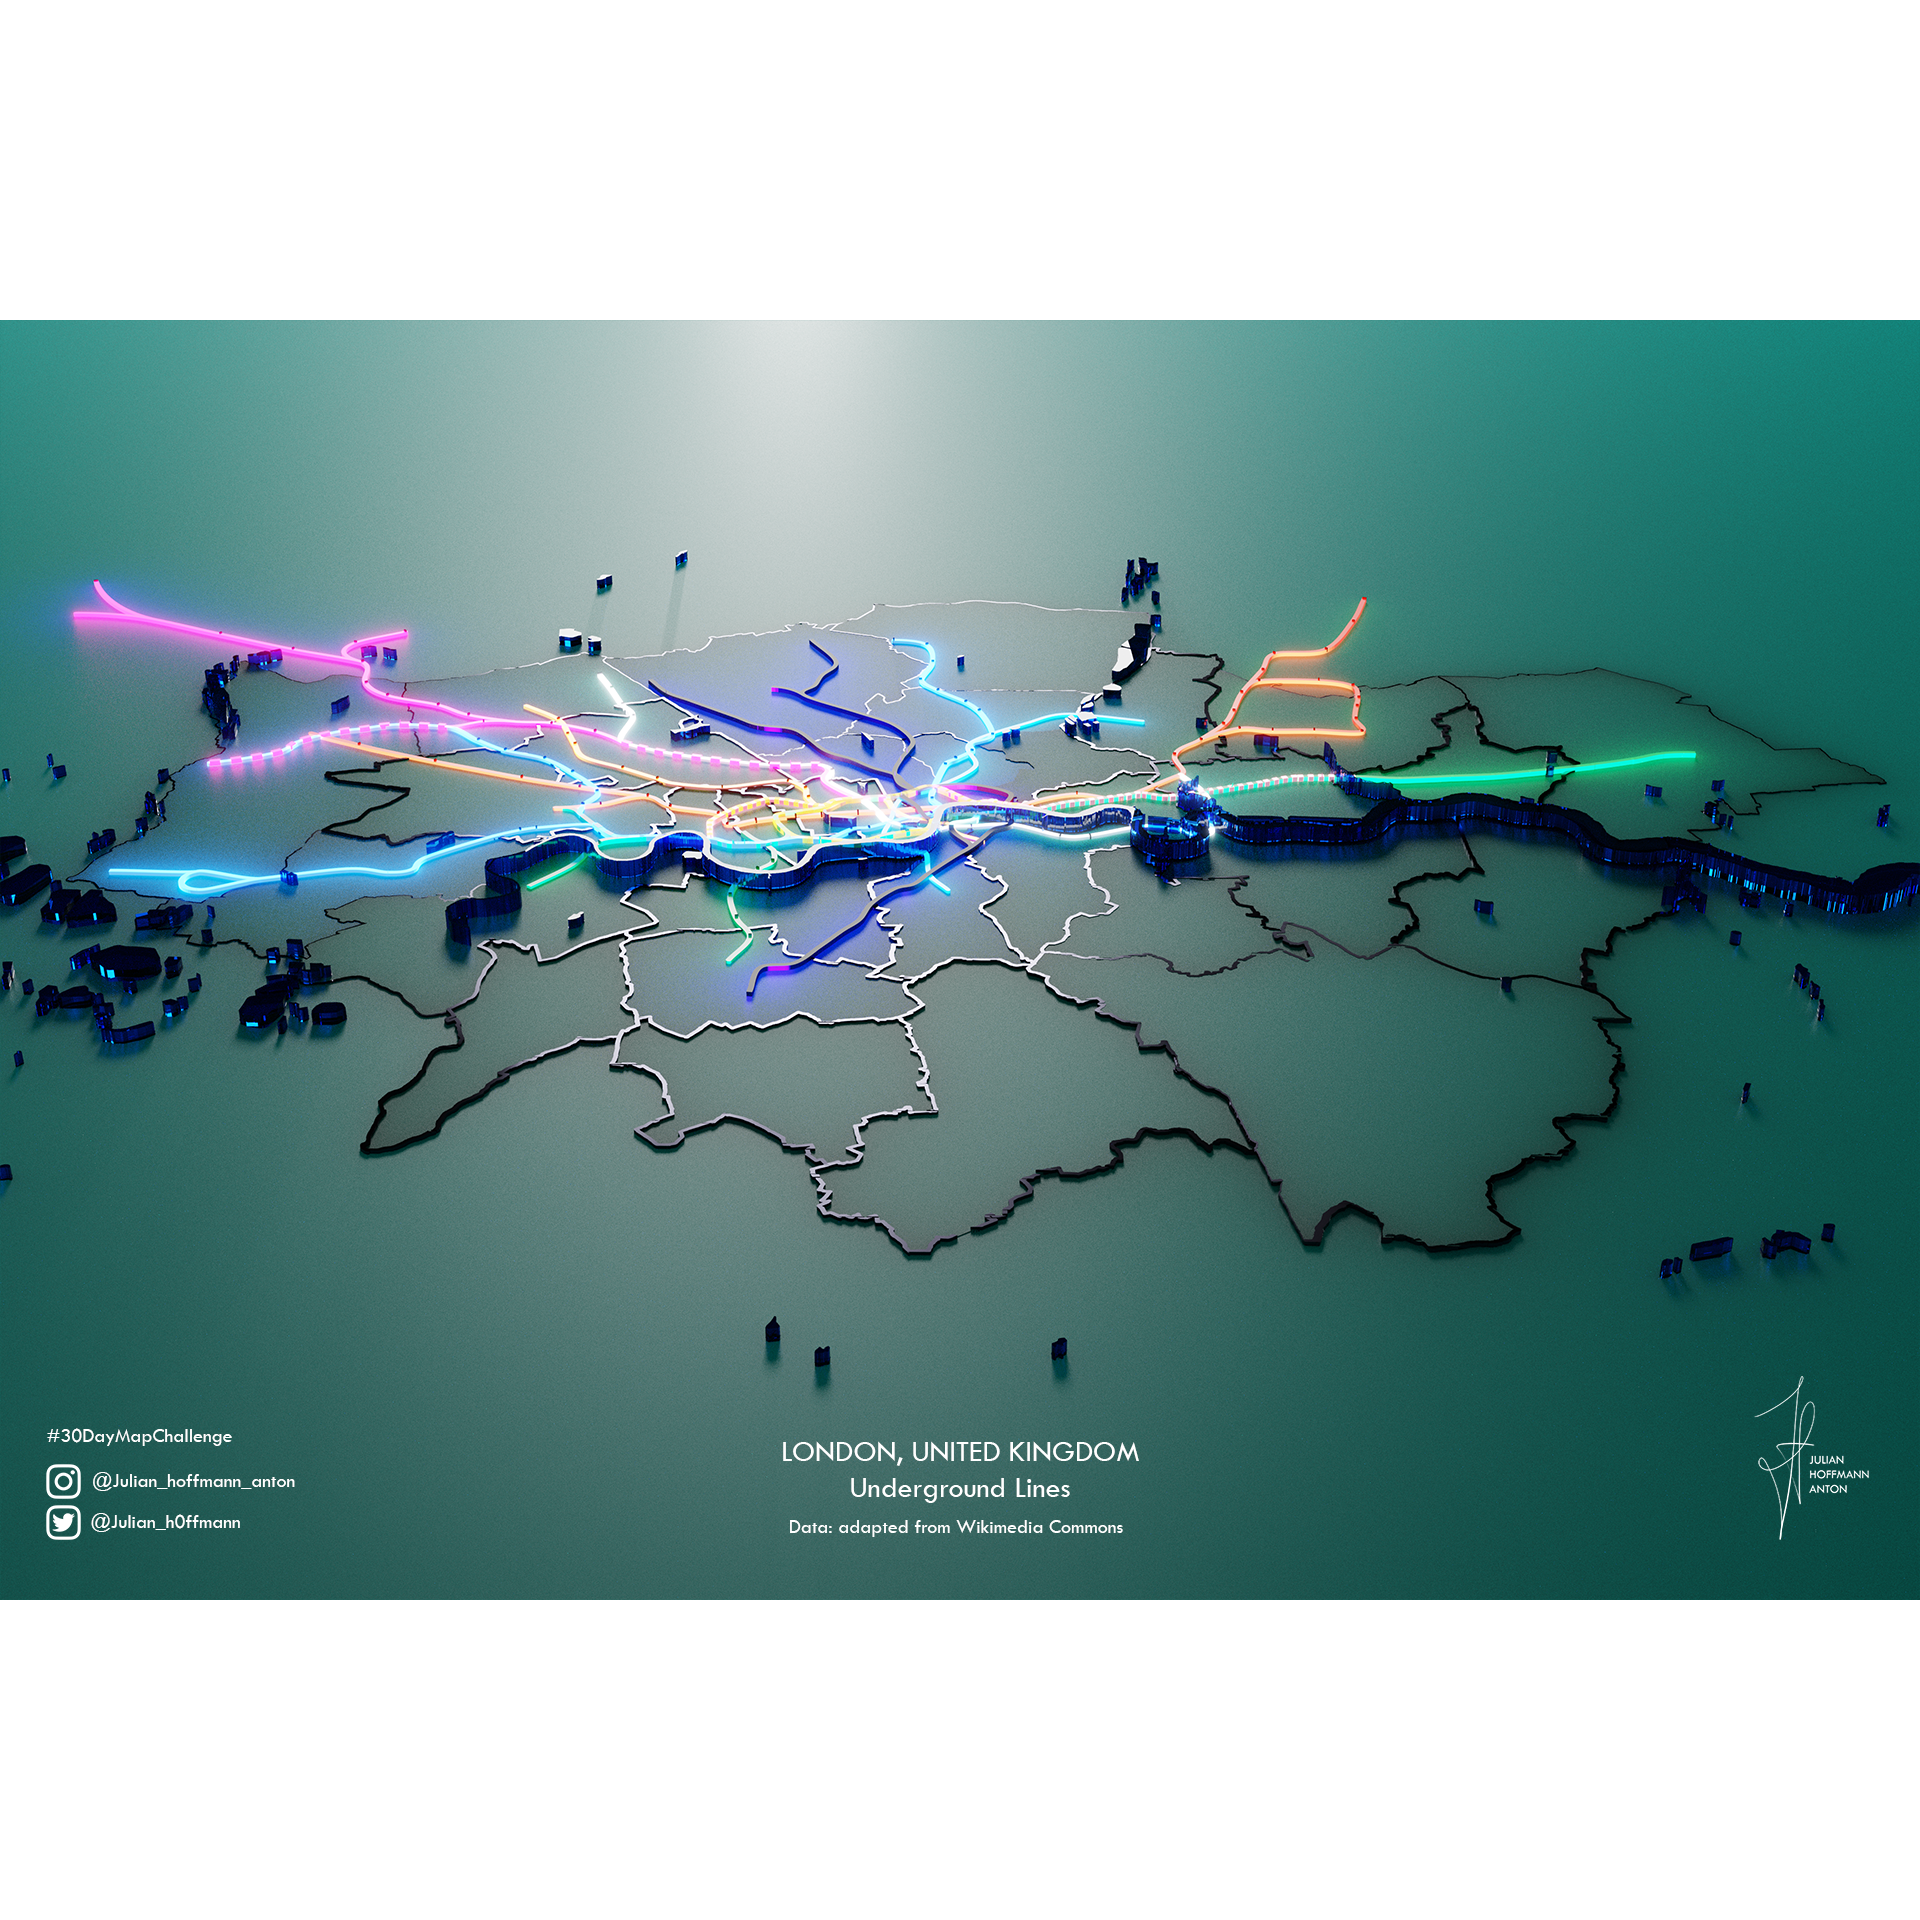
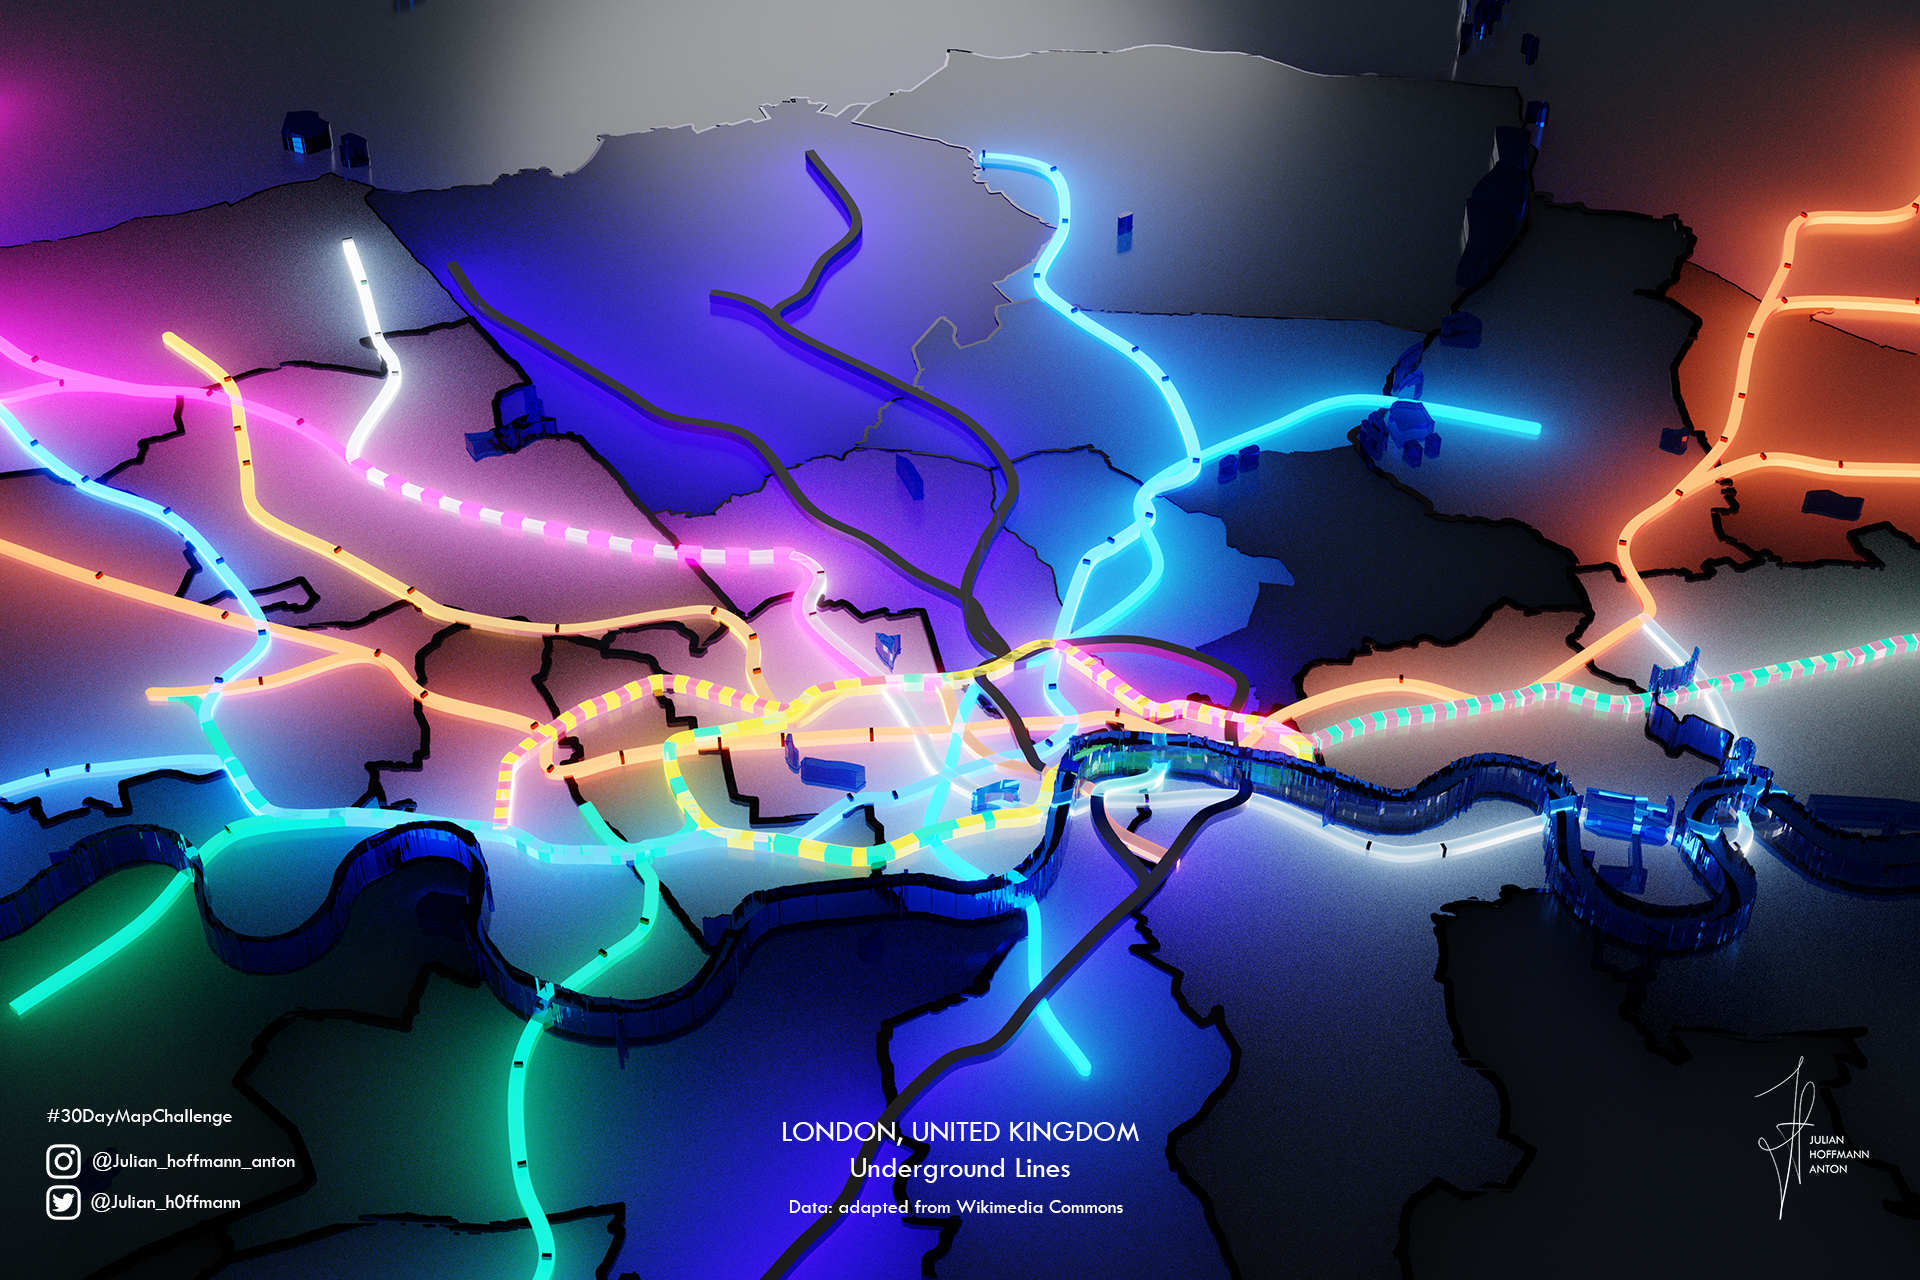
London Undeground

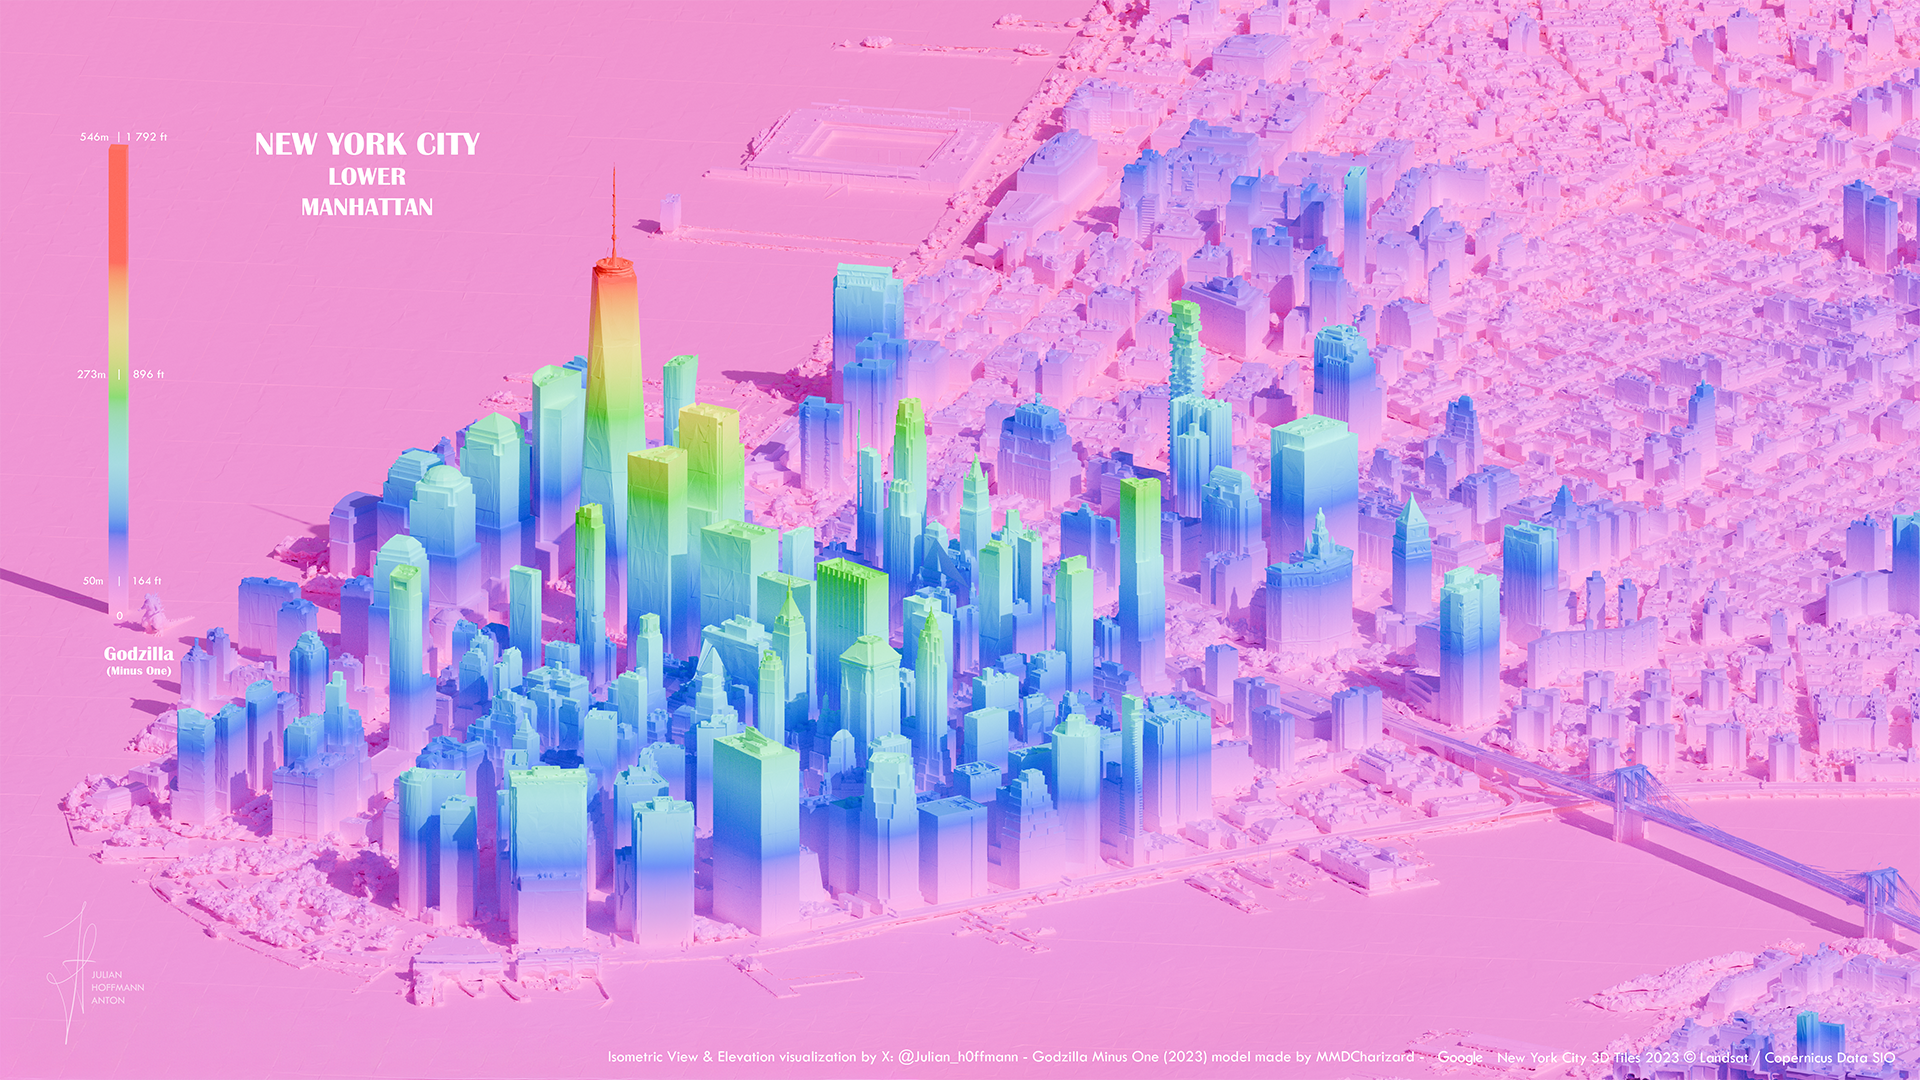
Downtown LA x Hollywood Elevation
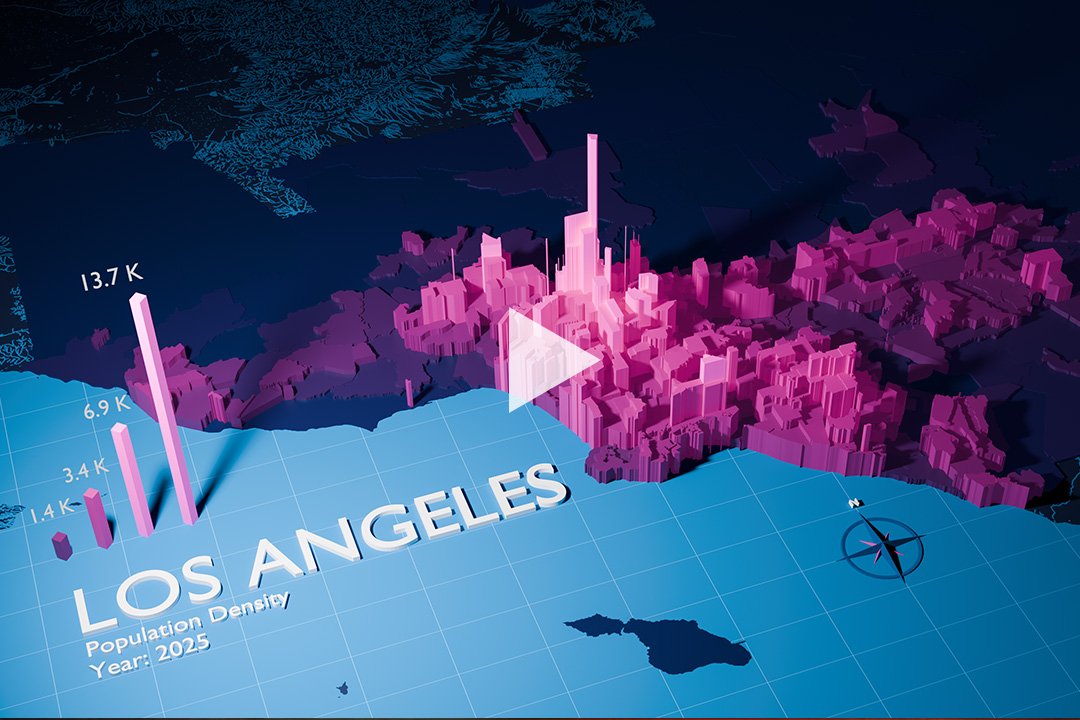
Greater Los Angeles Population
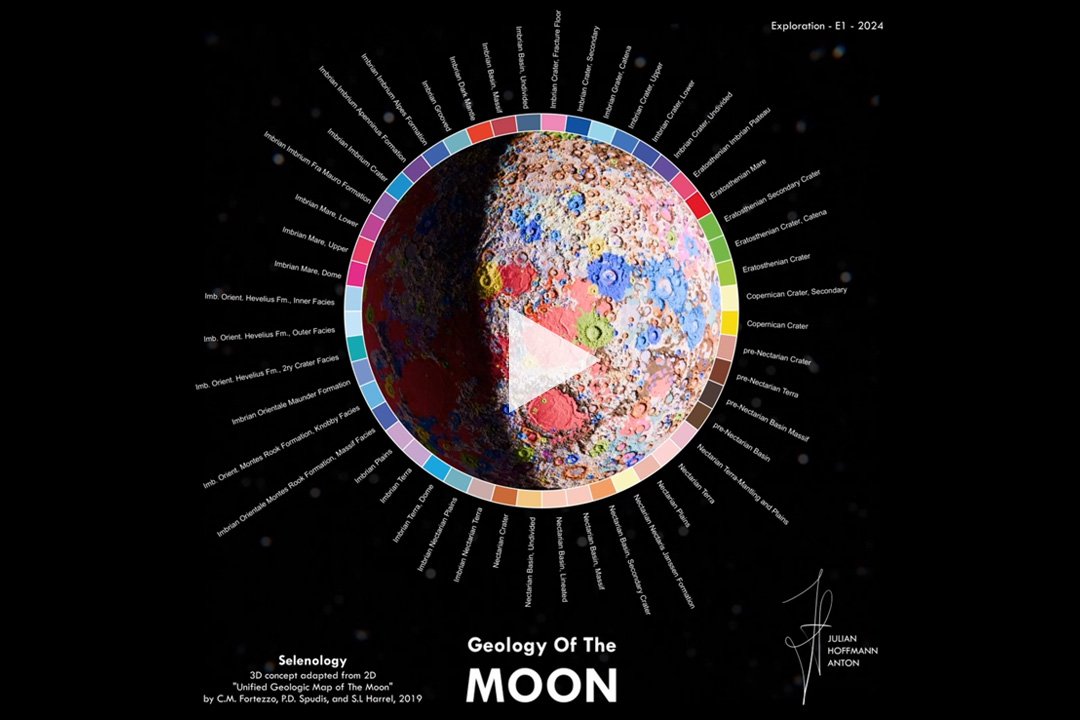
The Geology of the Moon

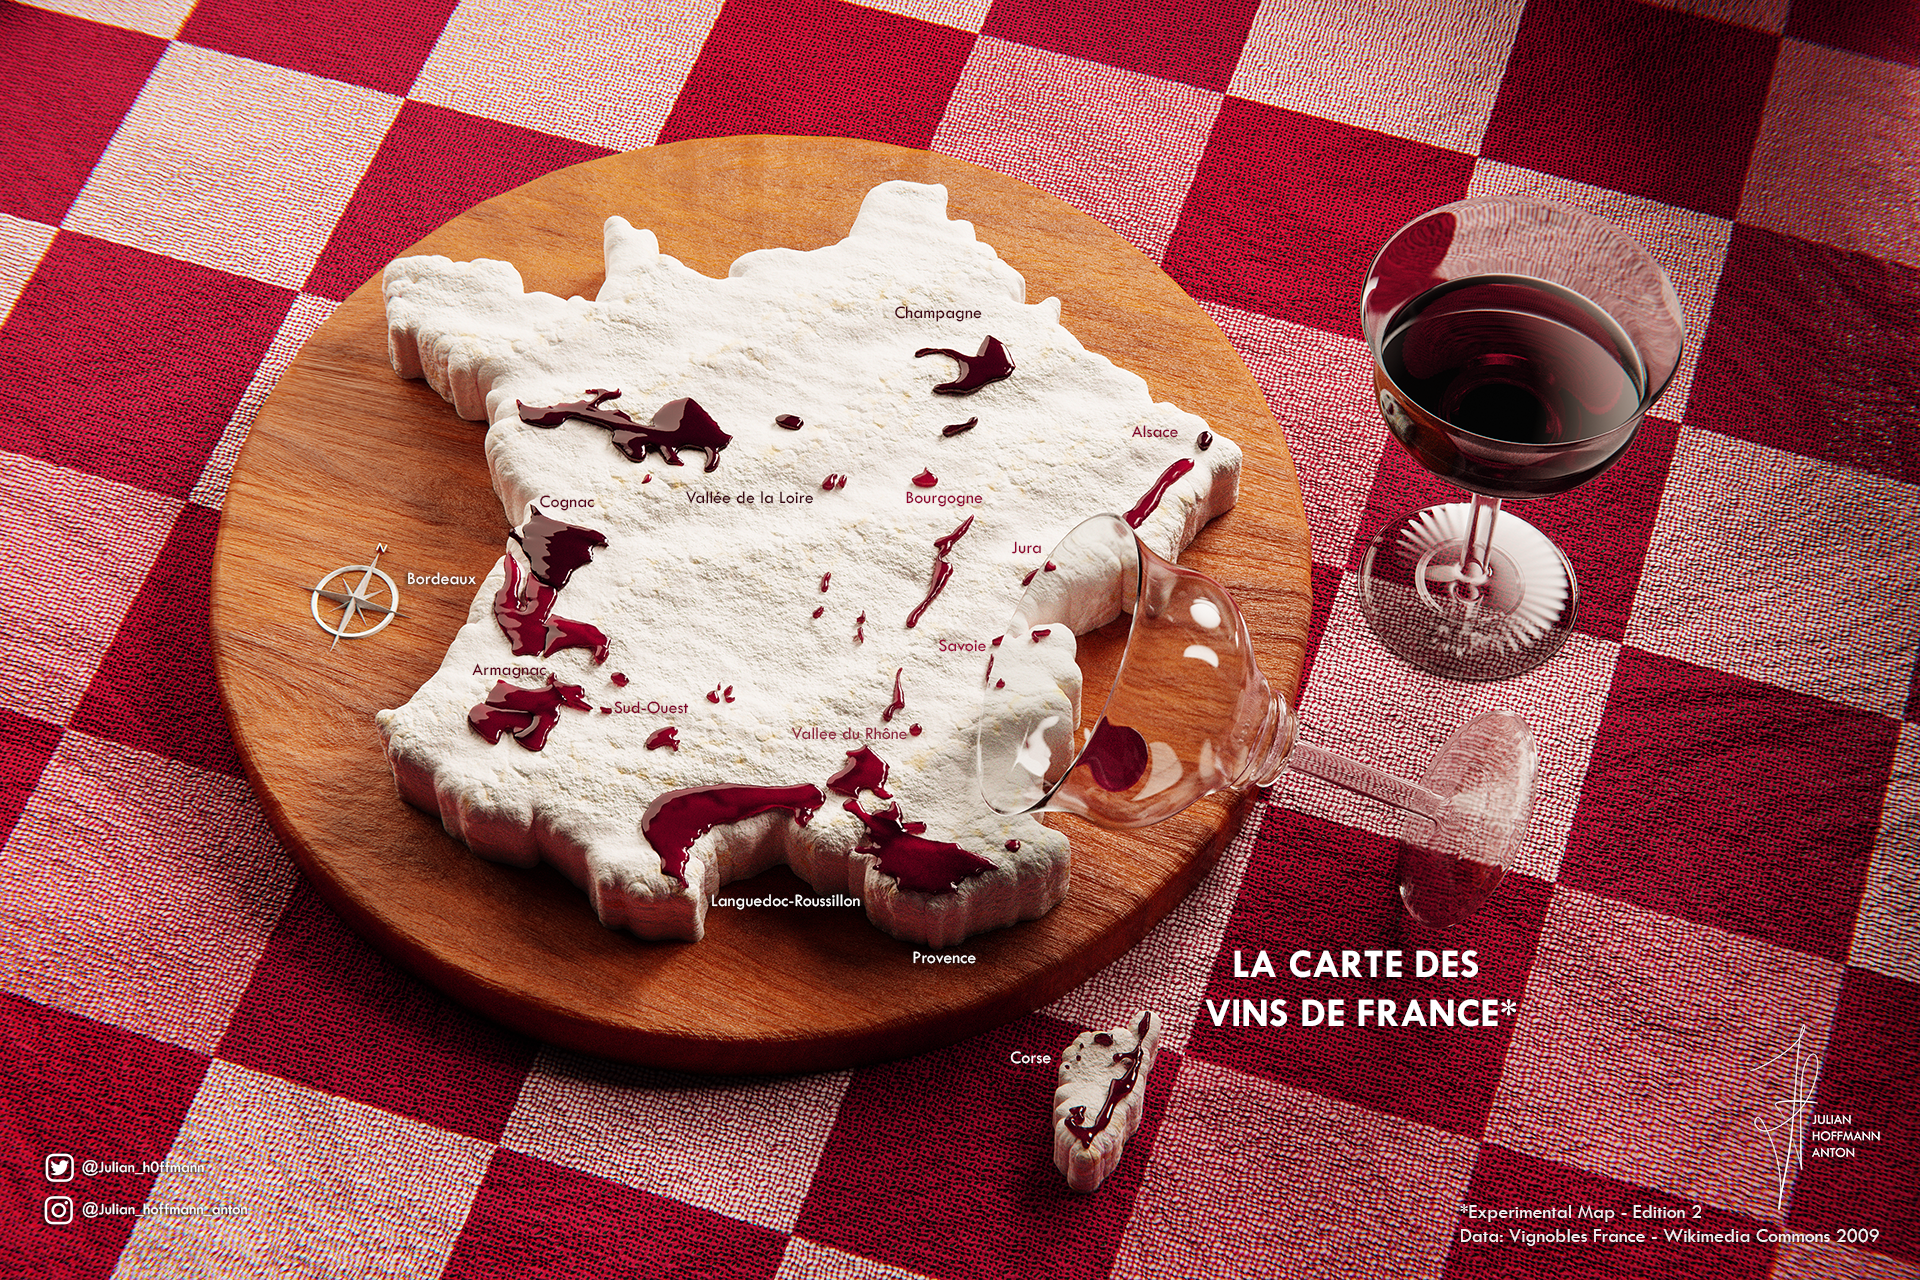
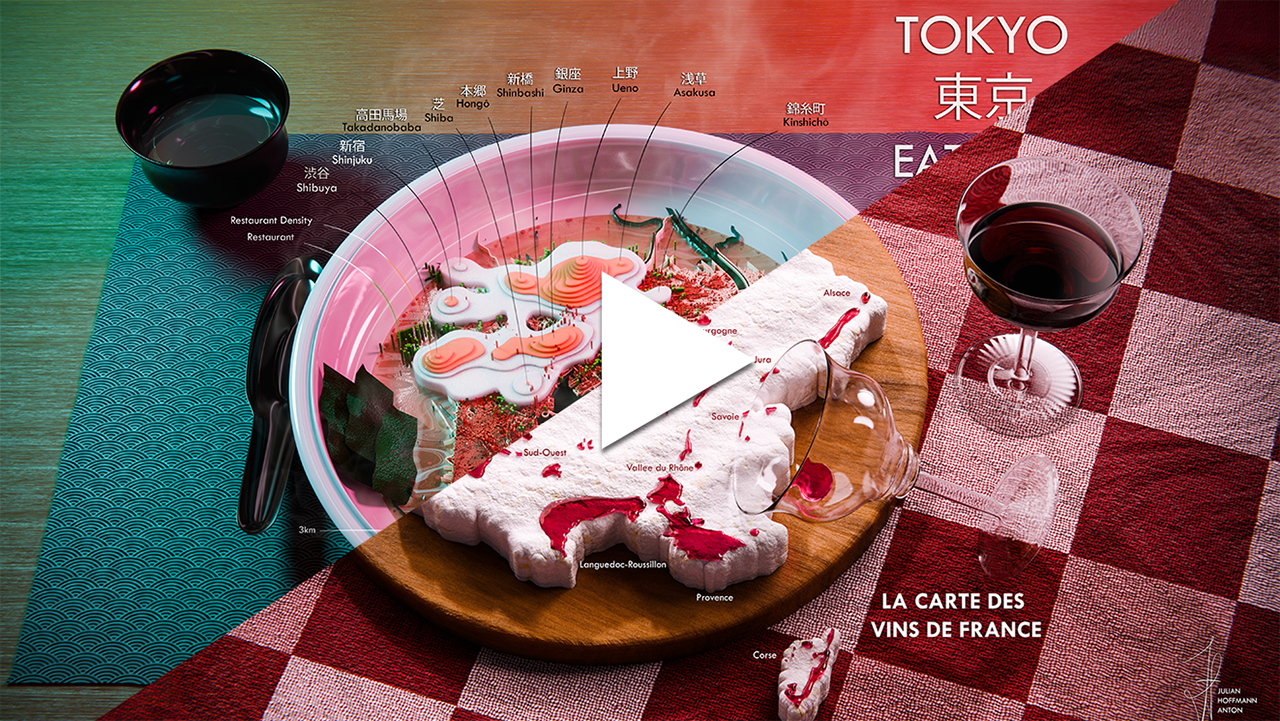
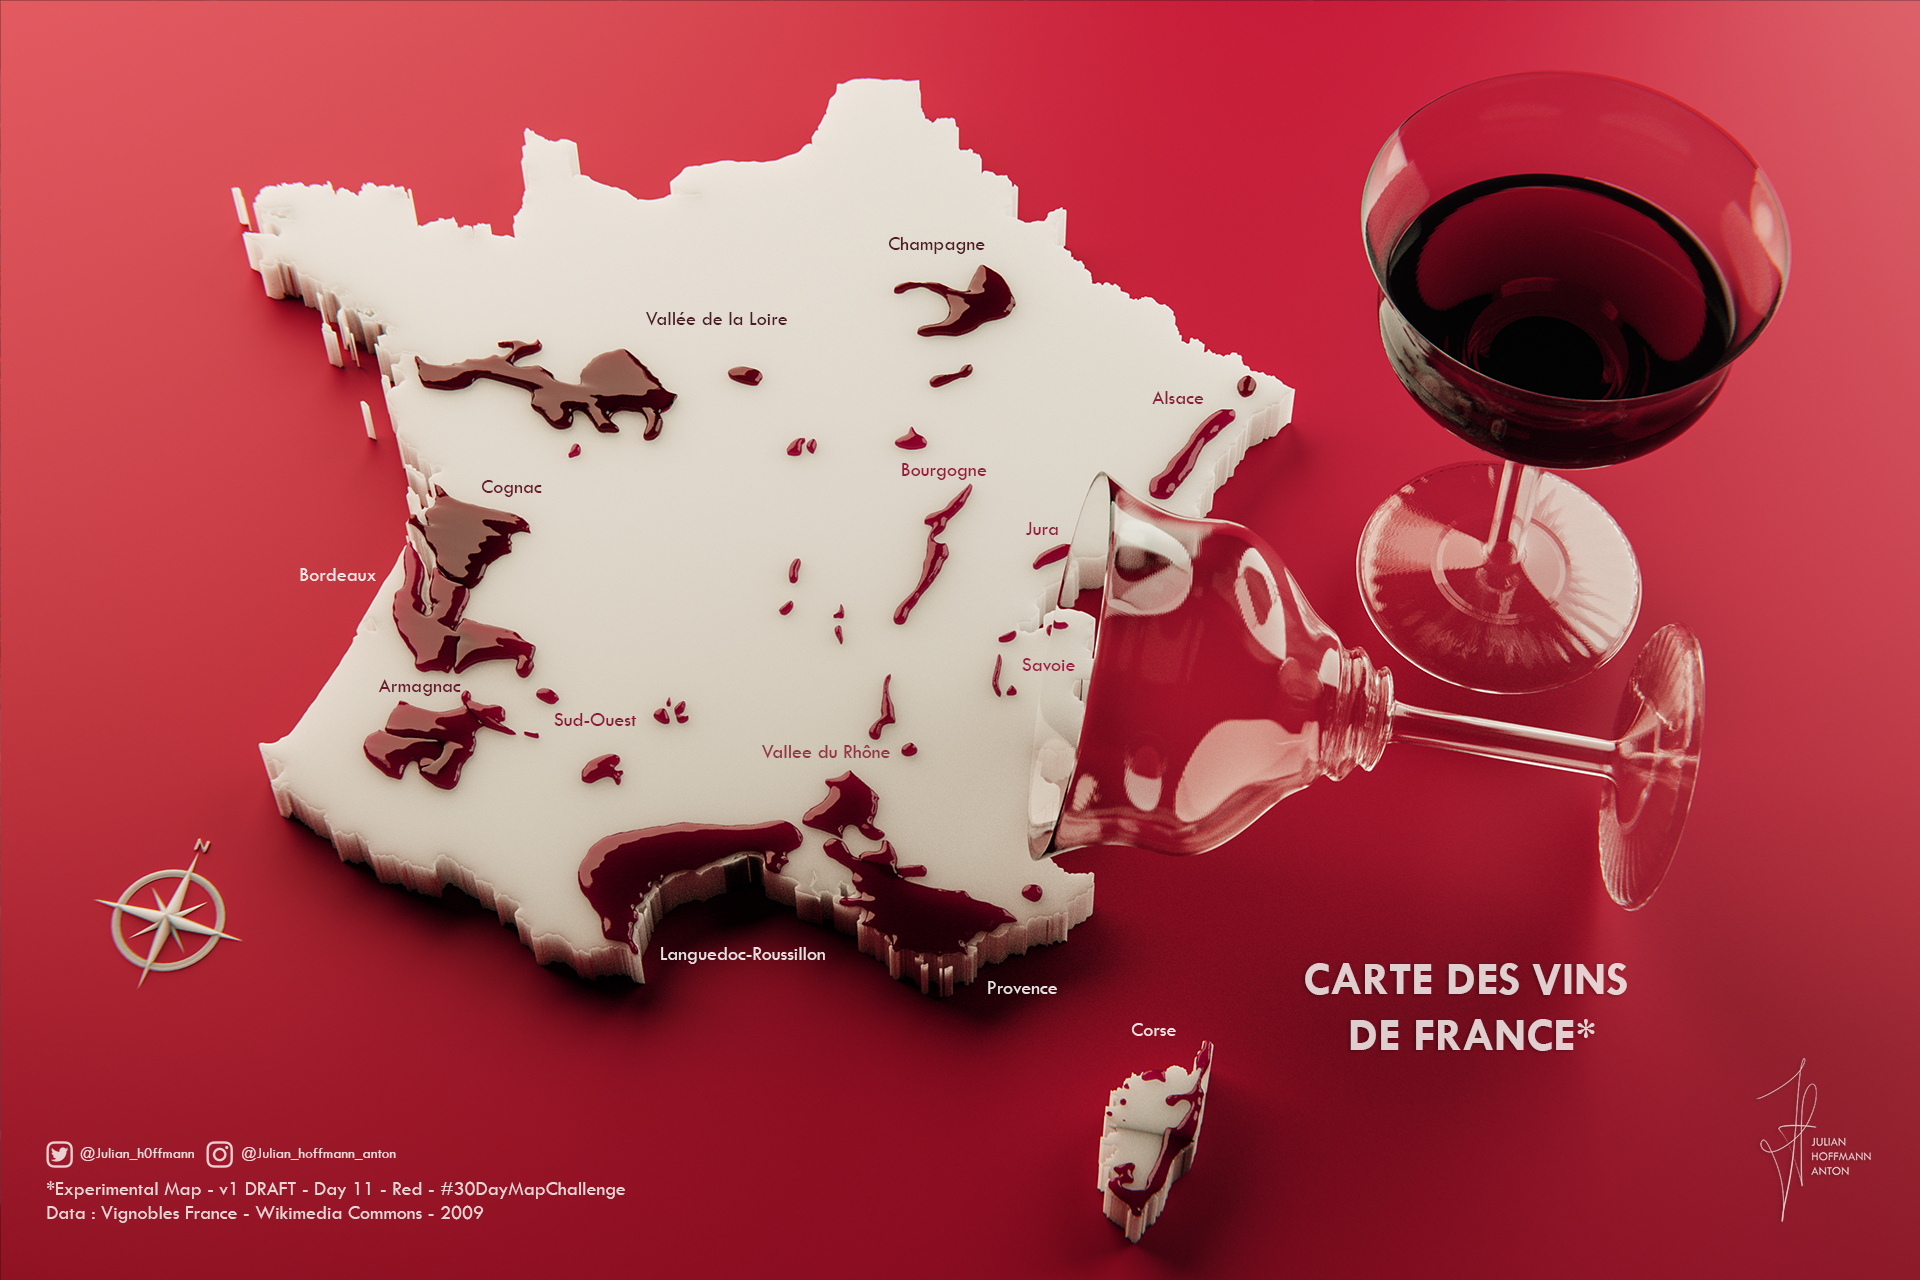
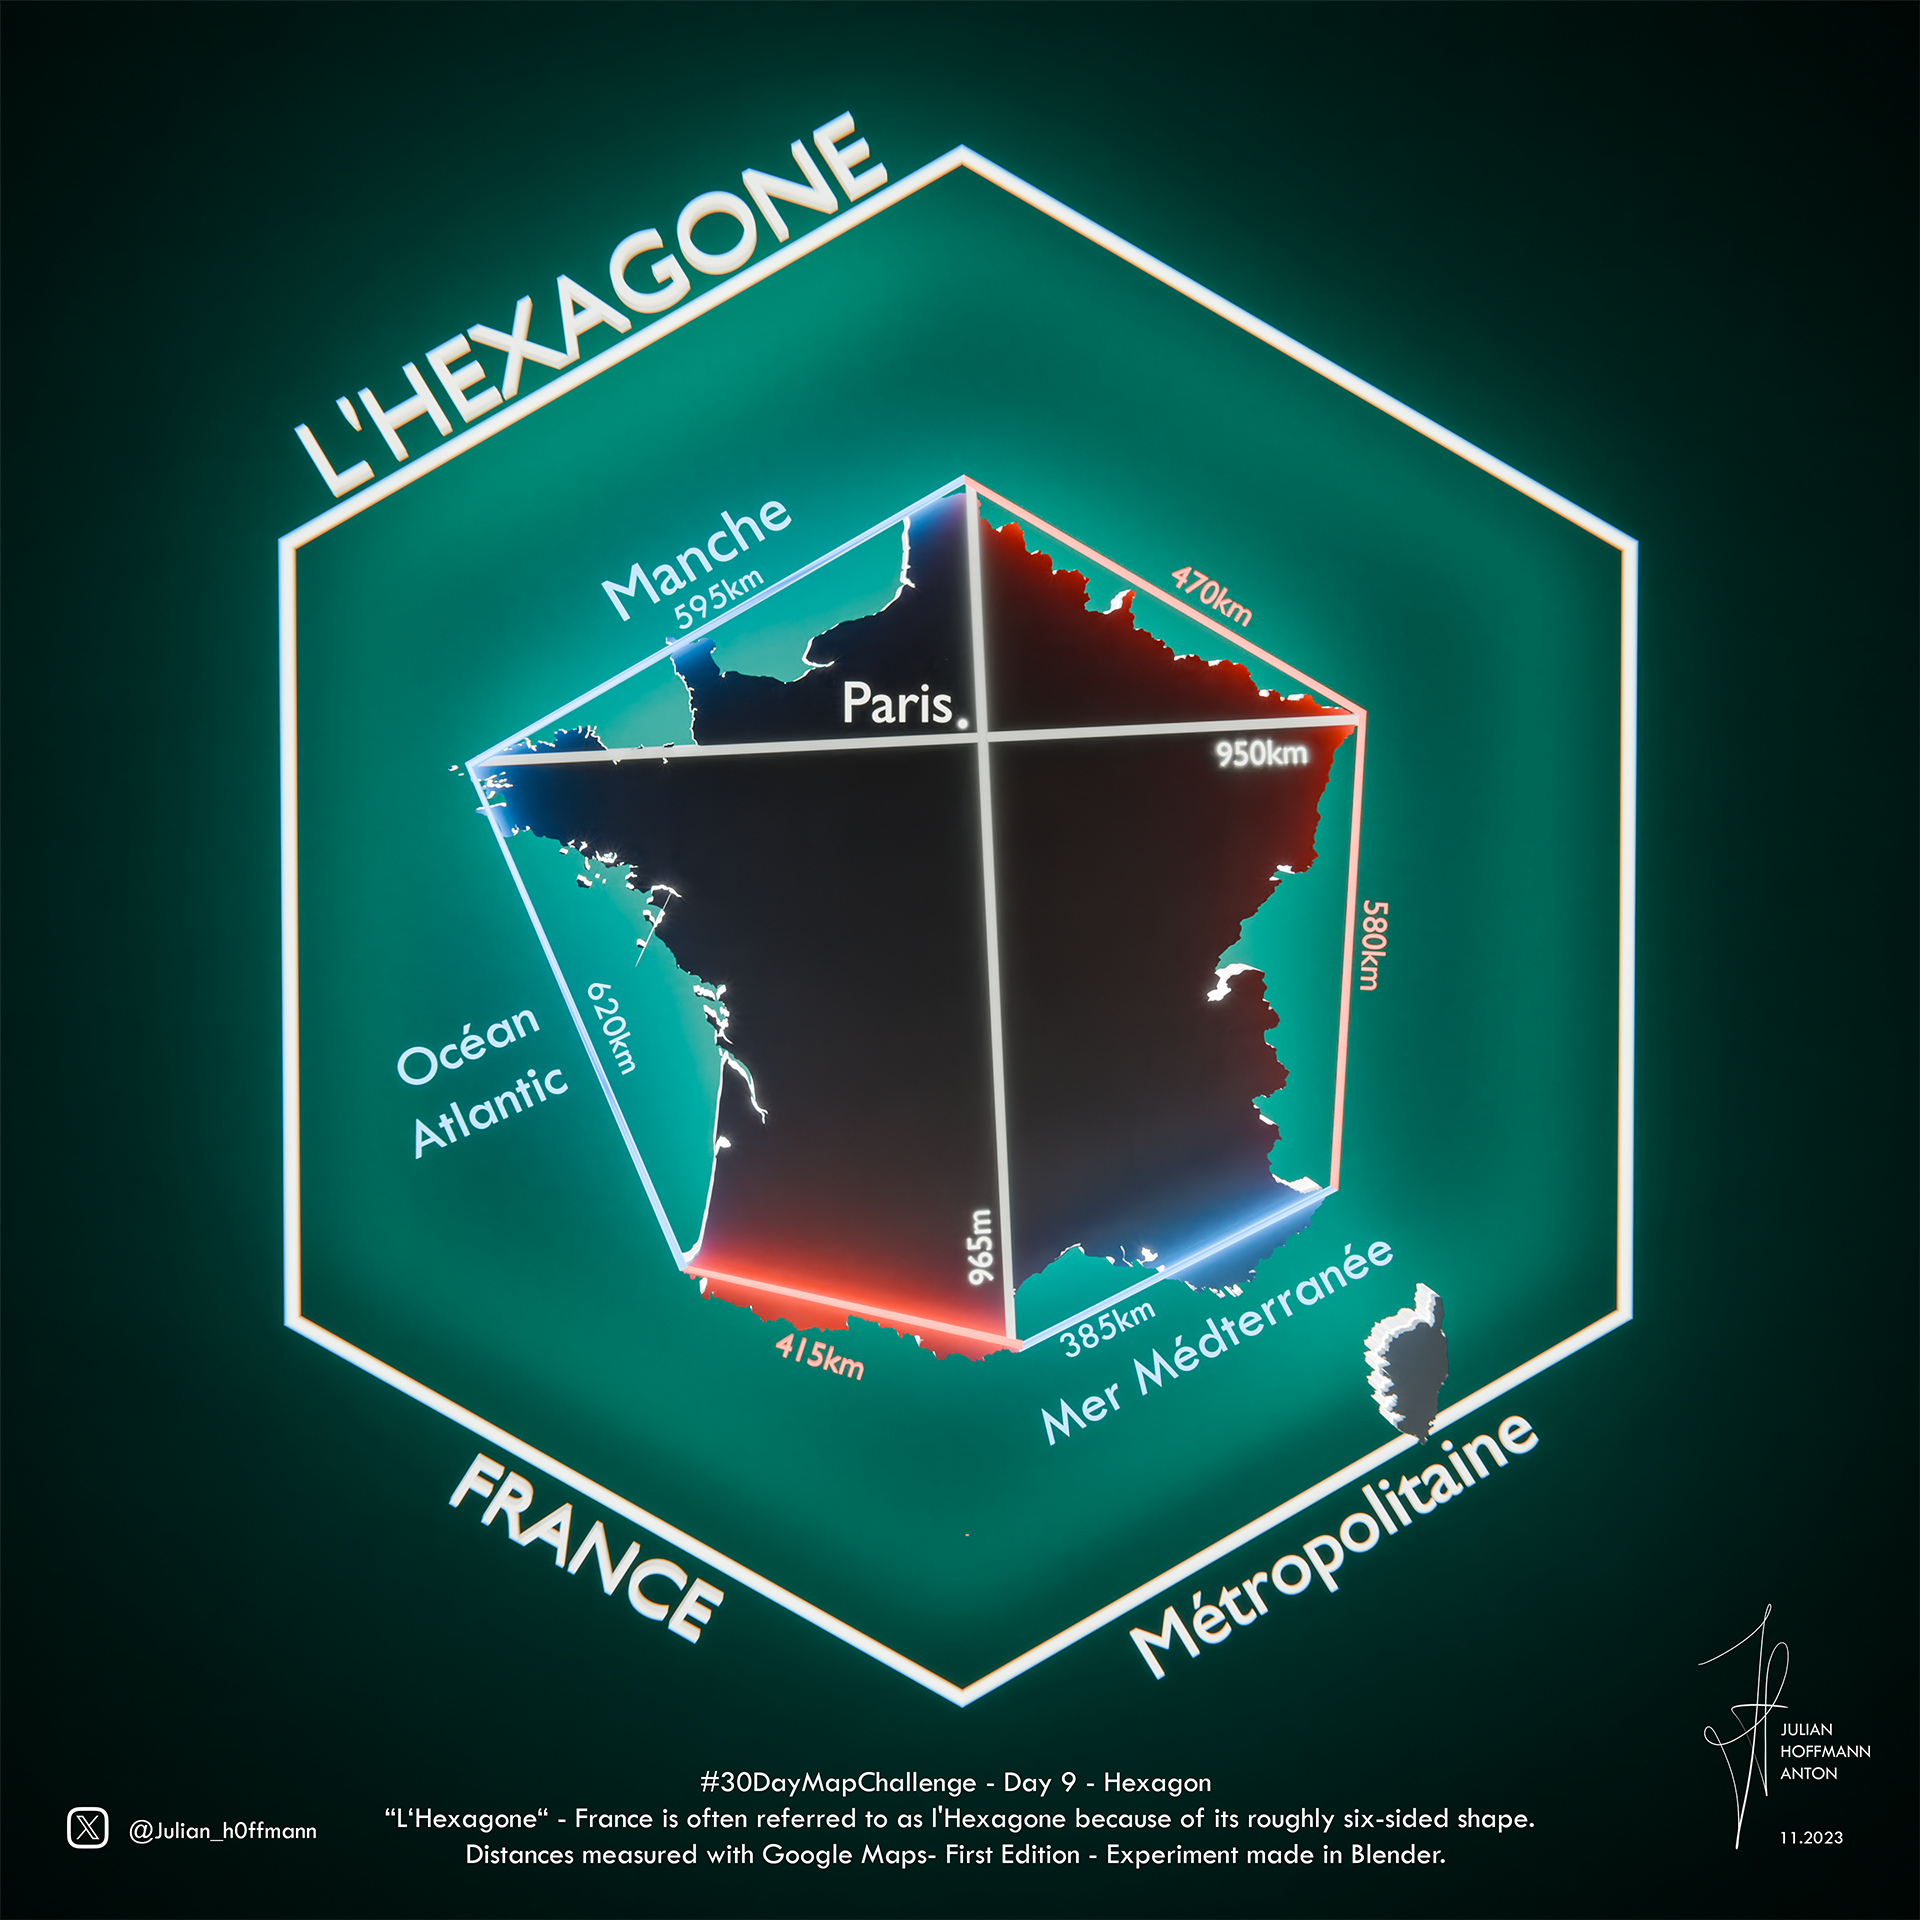
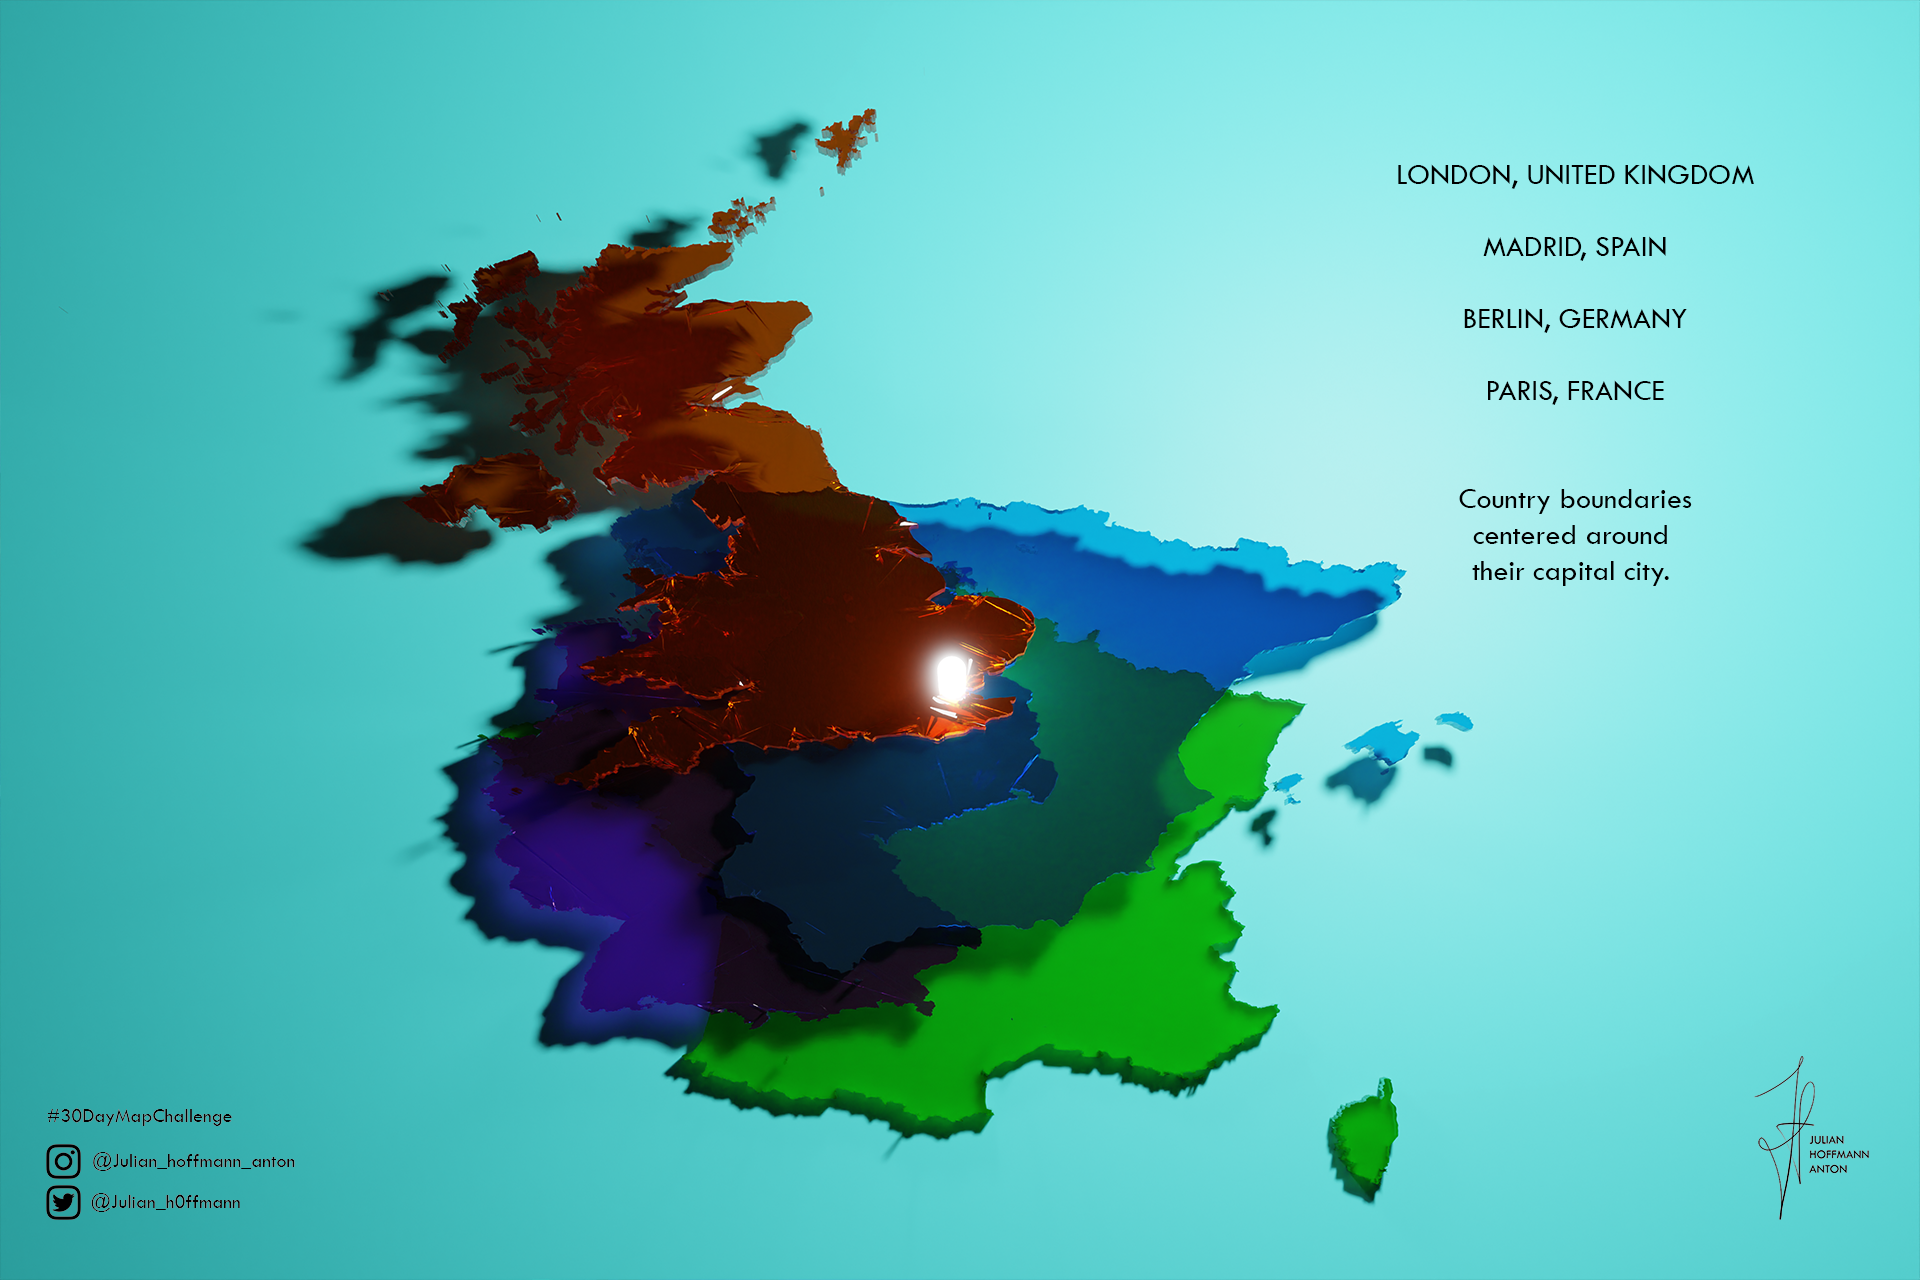
La Carte des Vins de France
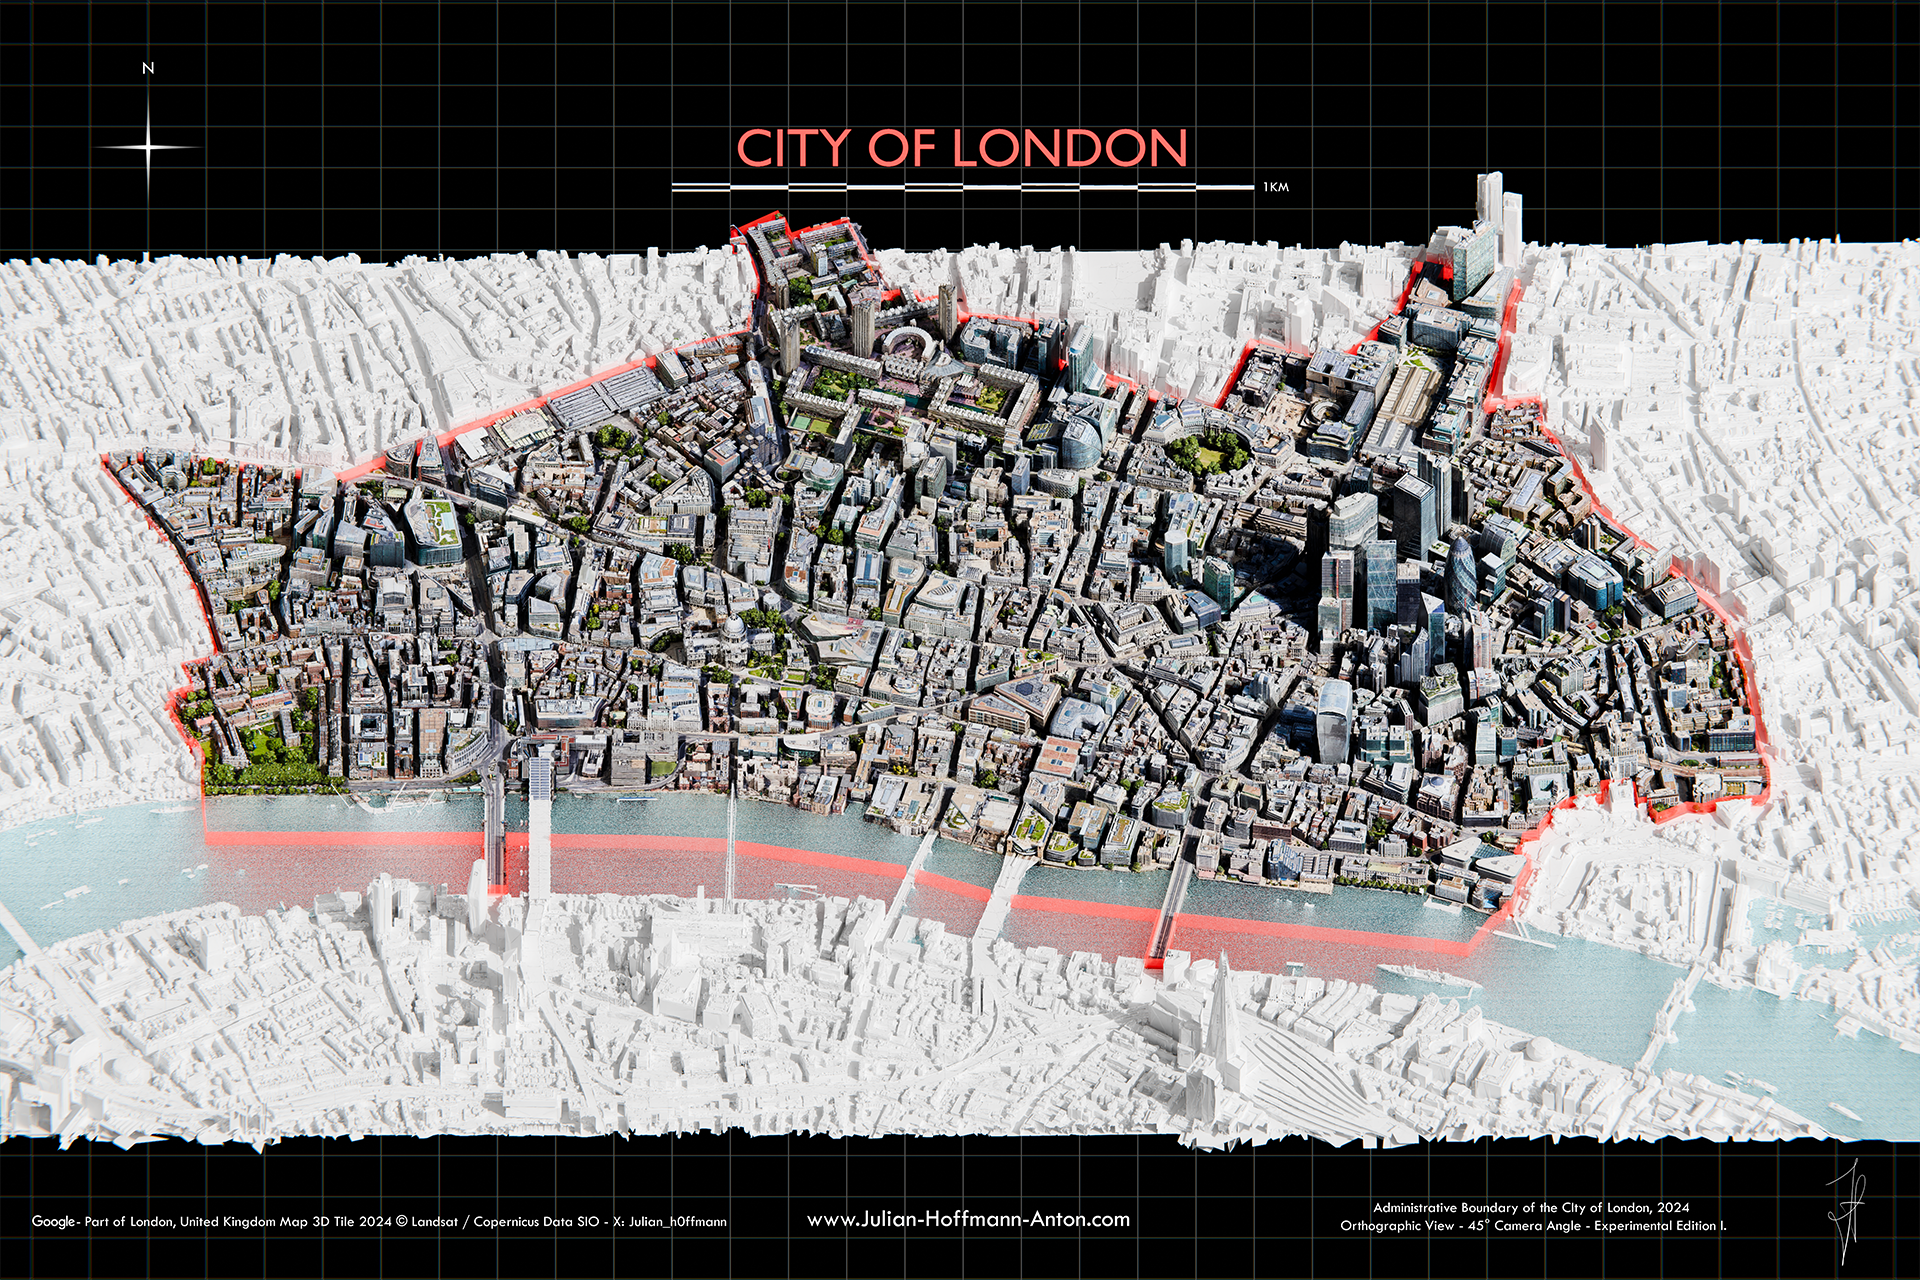
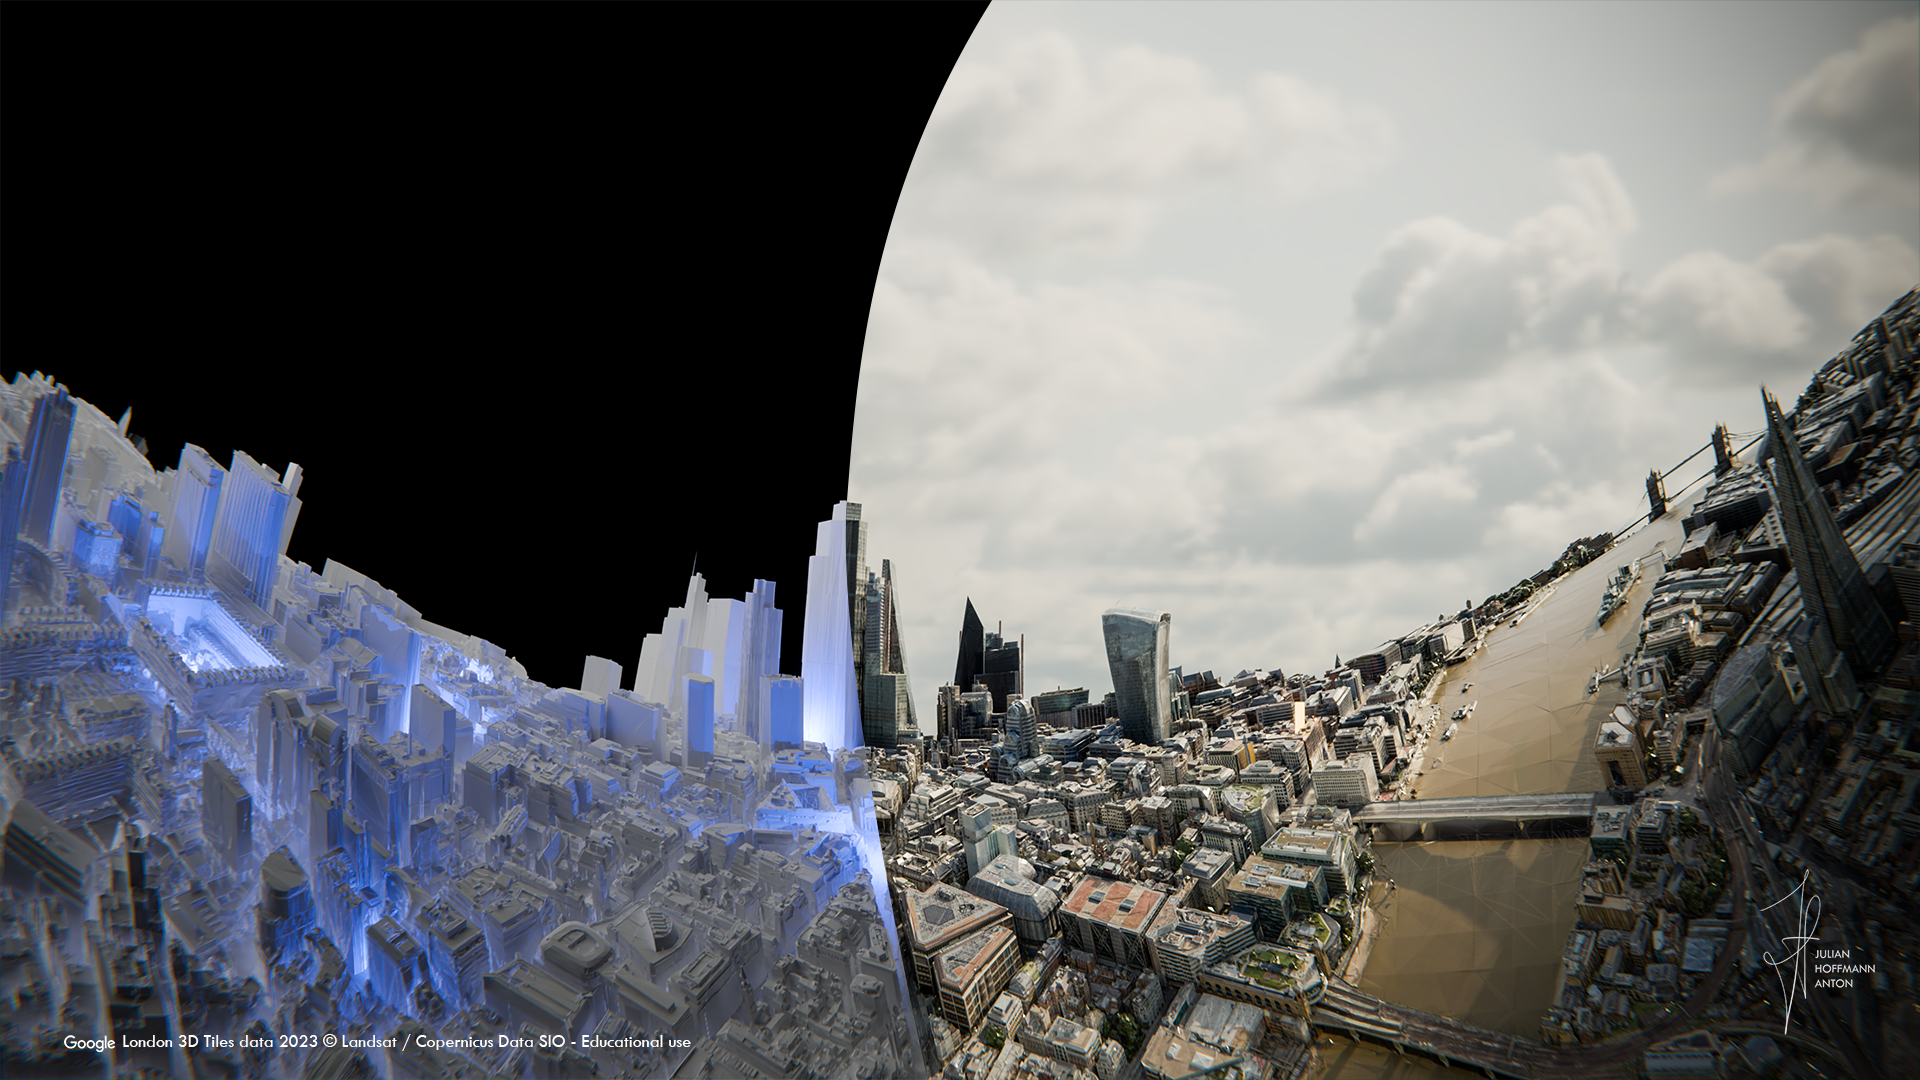
The City of London
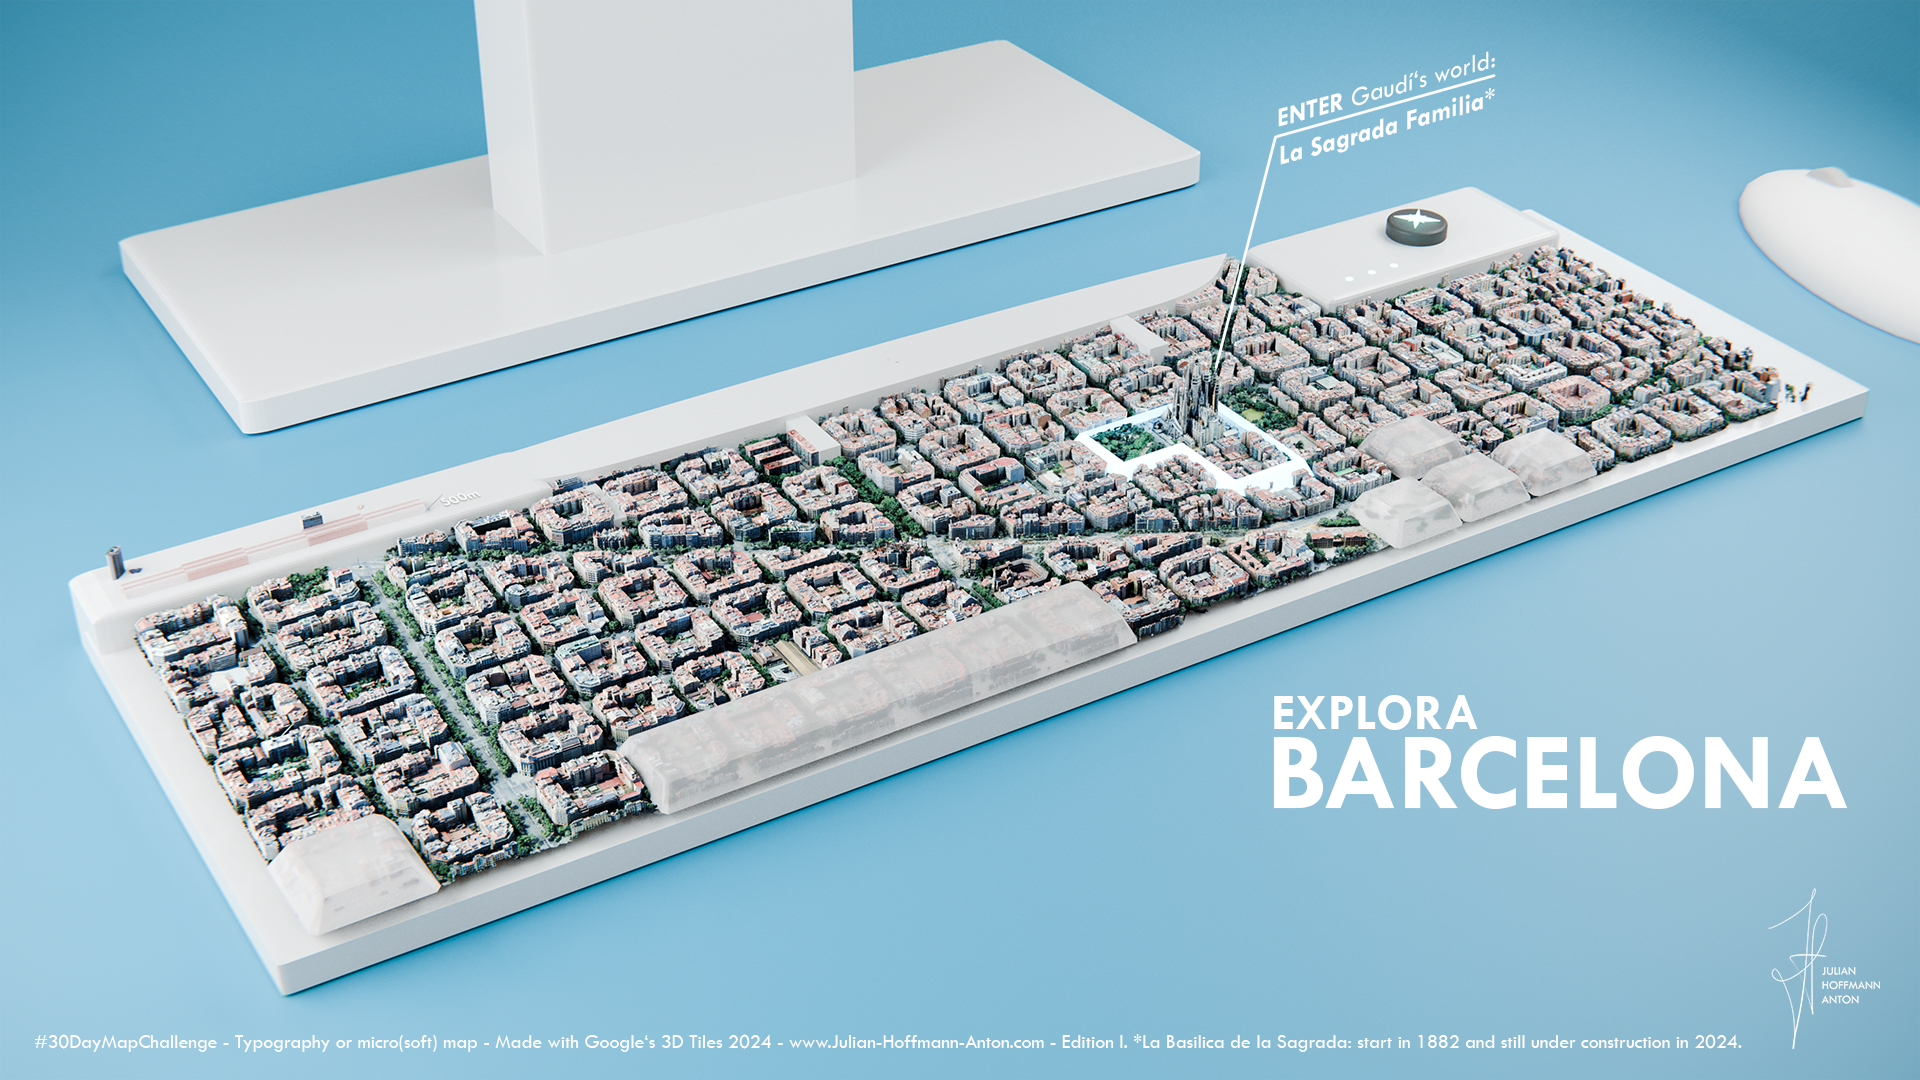
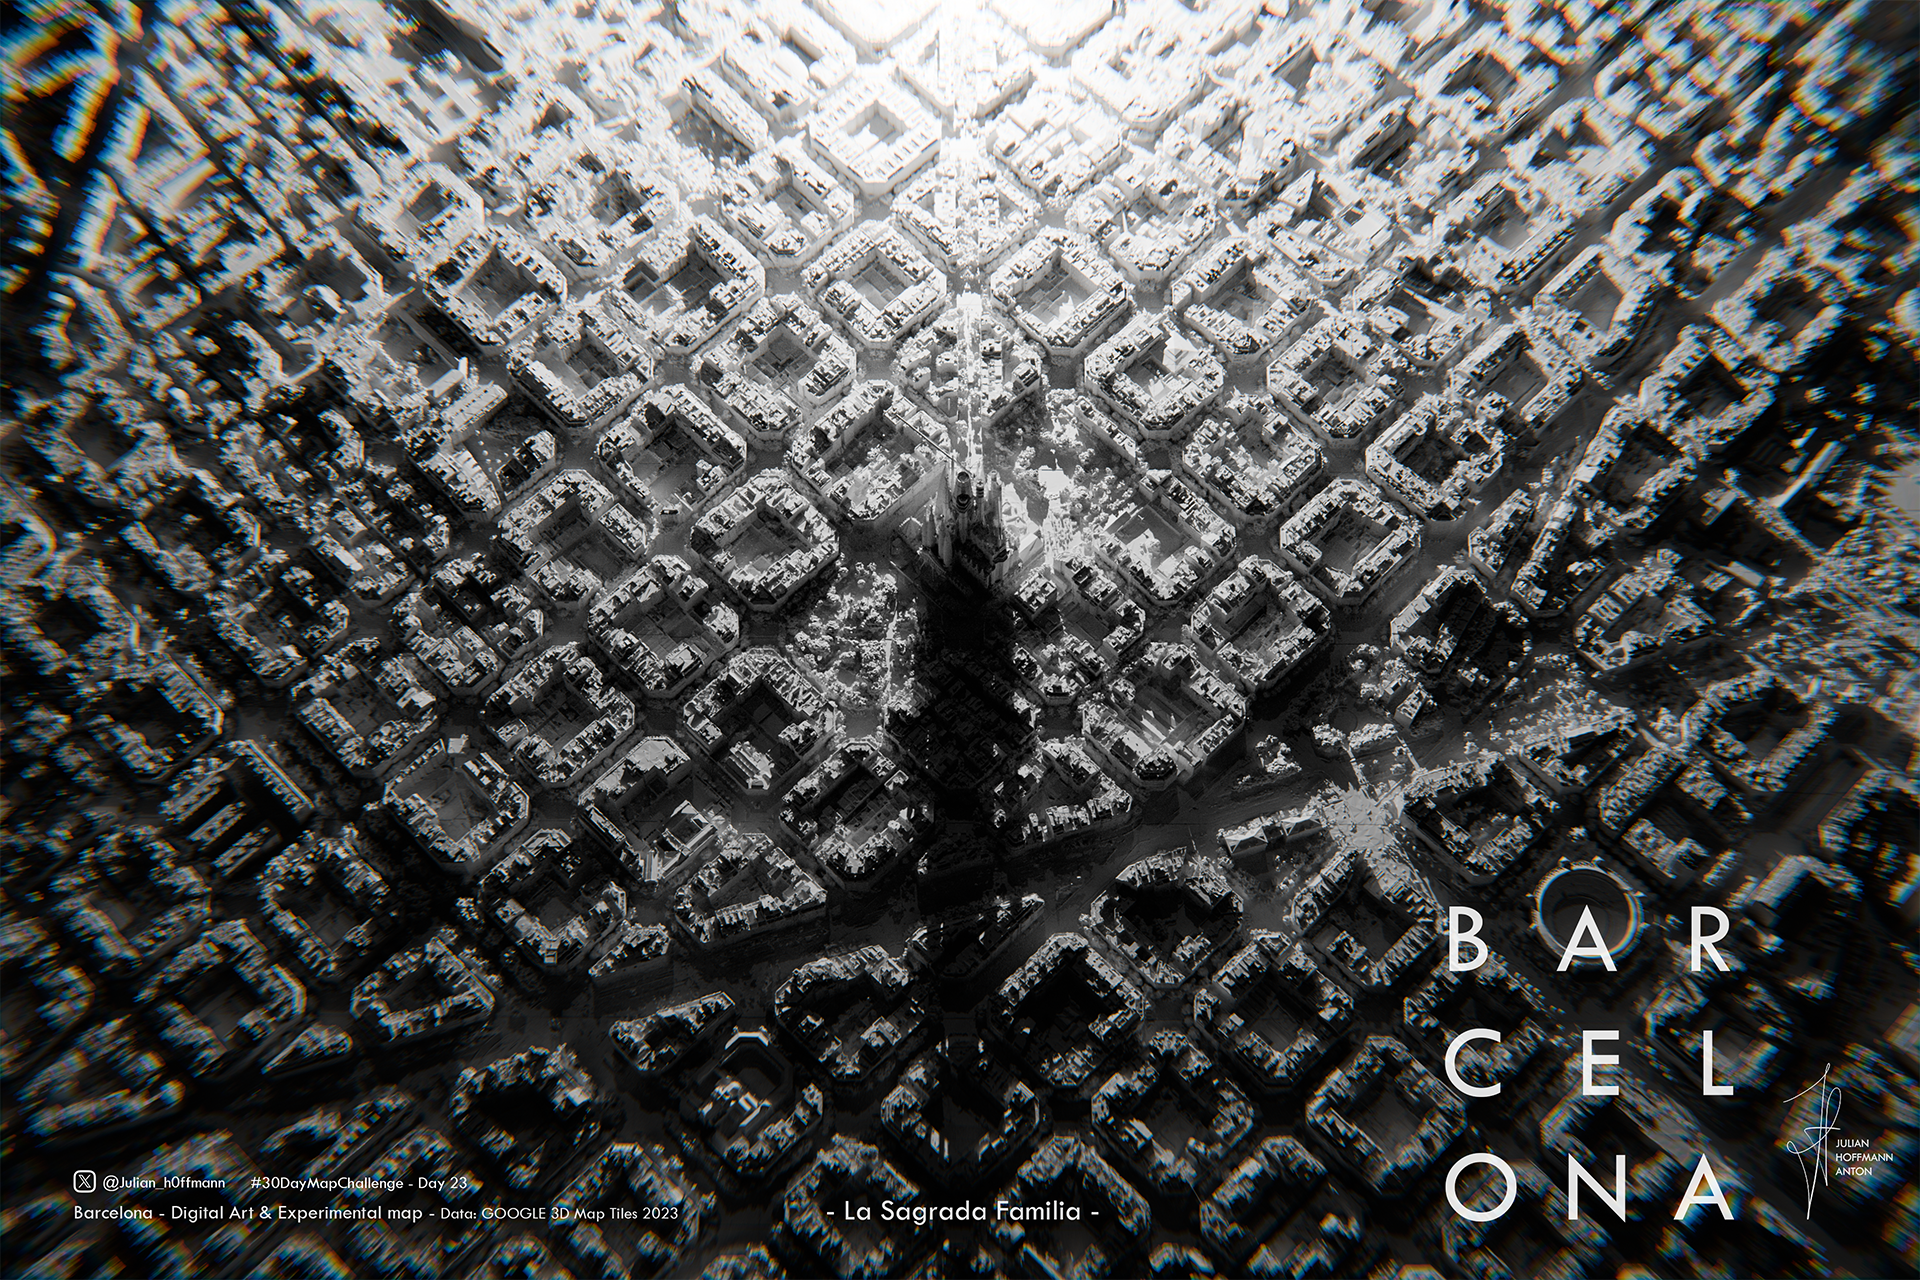
Barcelona (Typography)
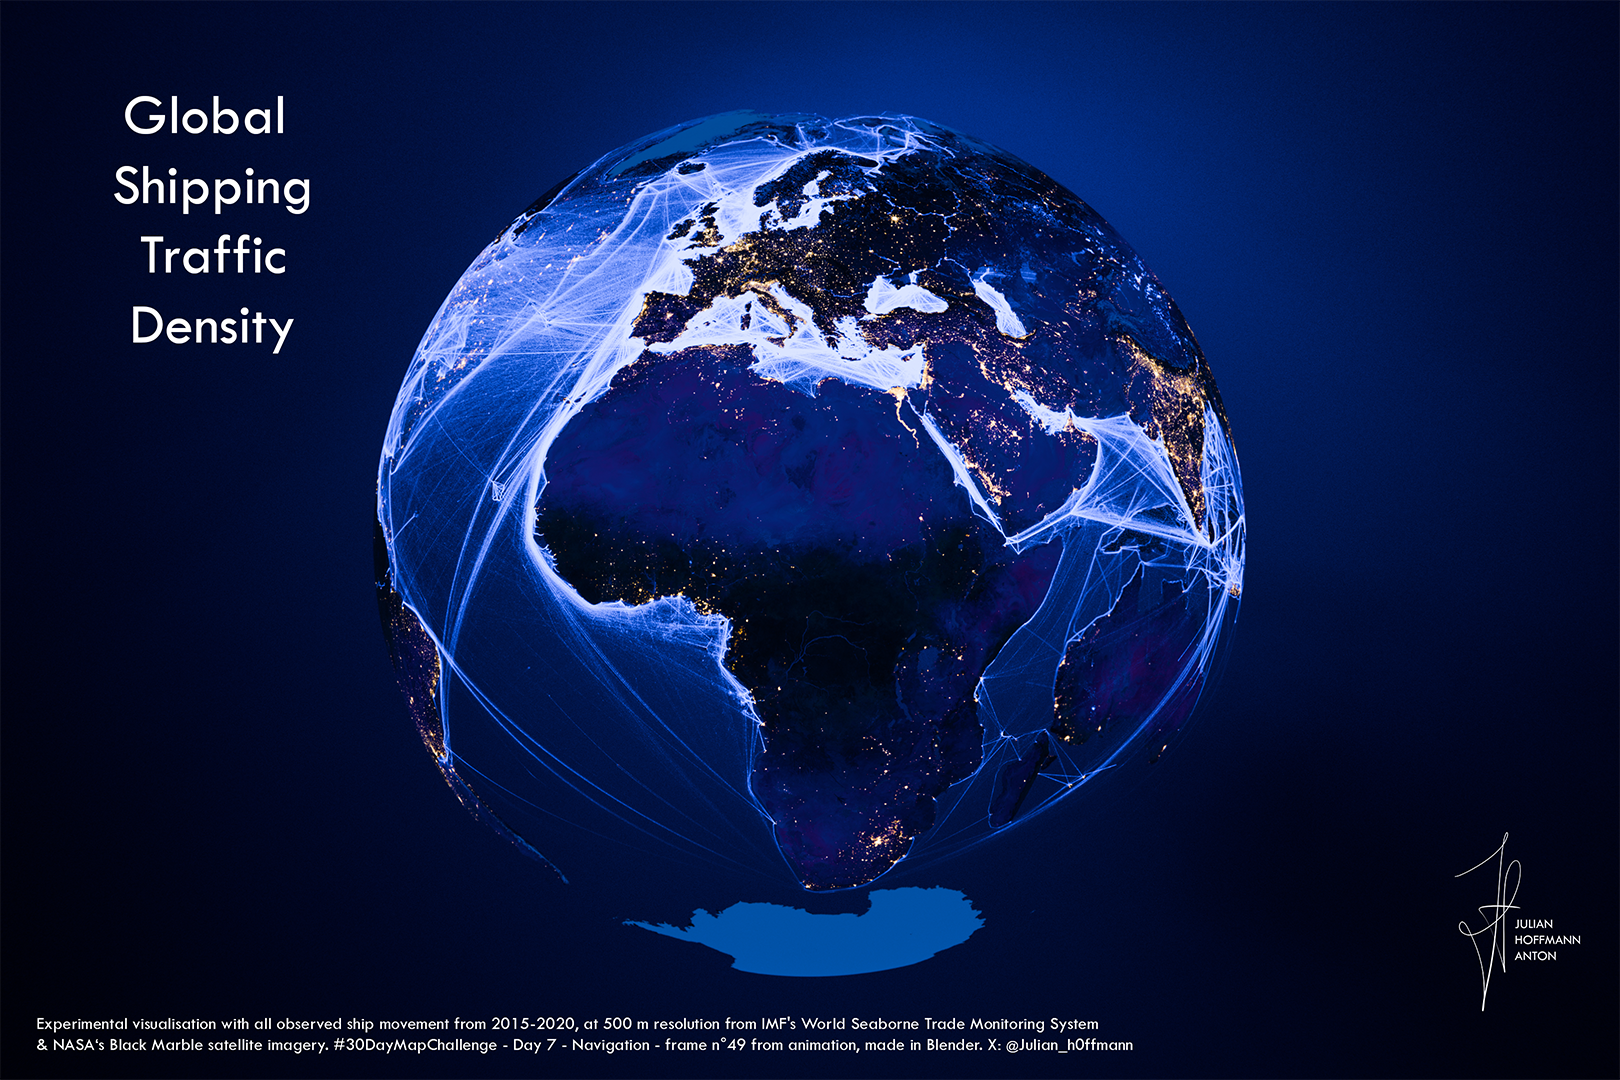
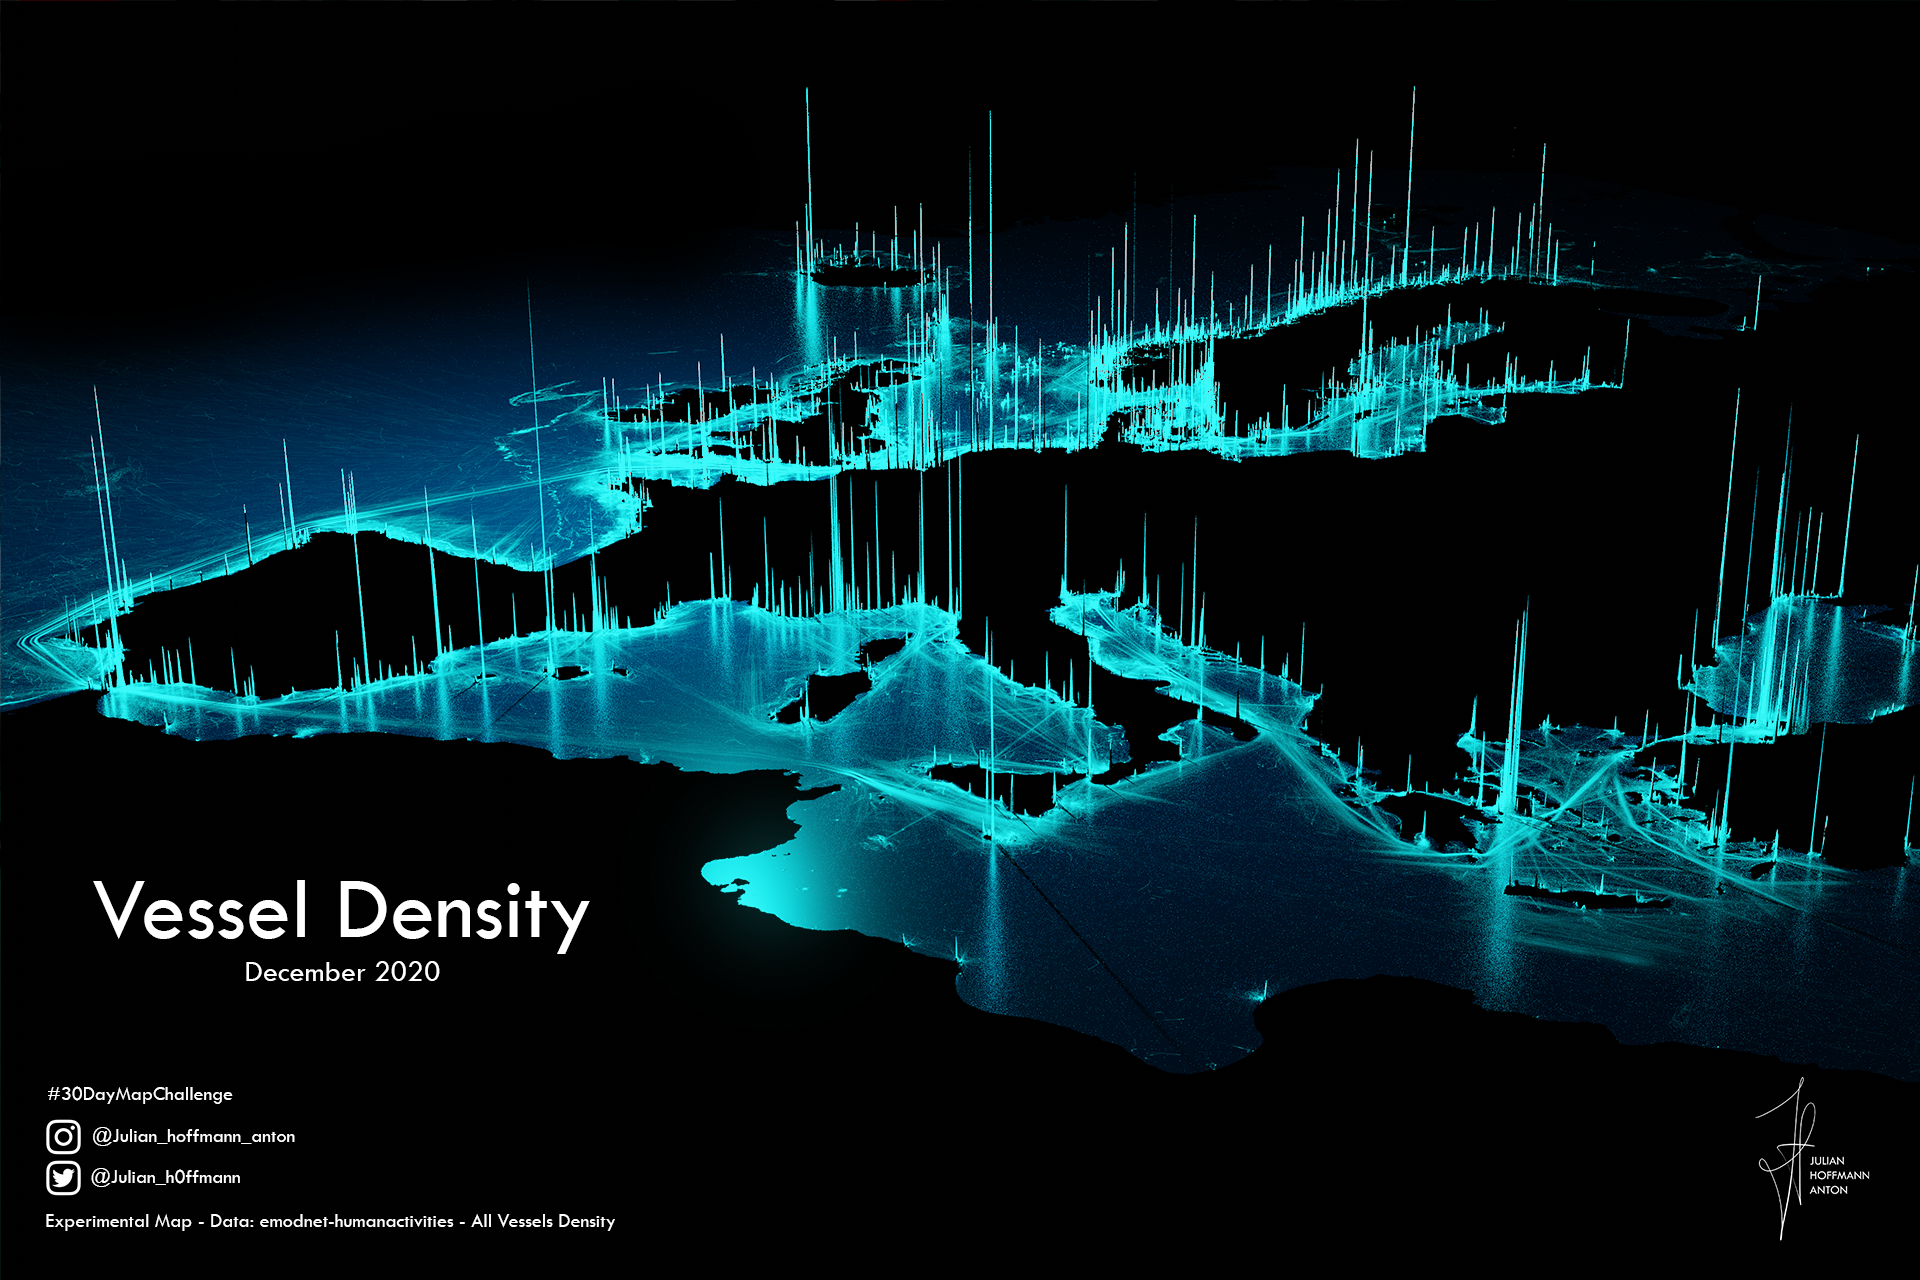
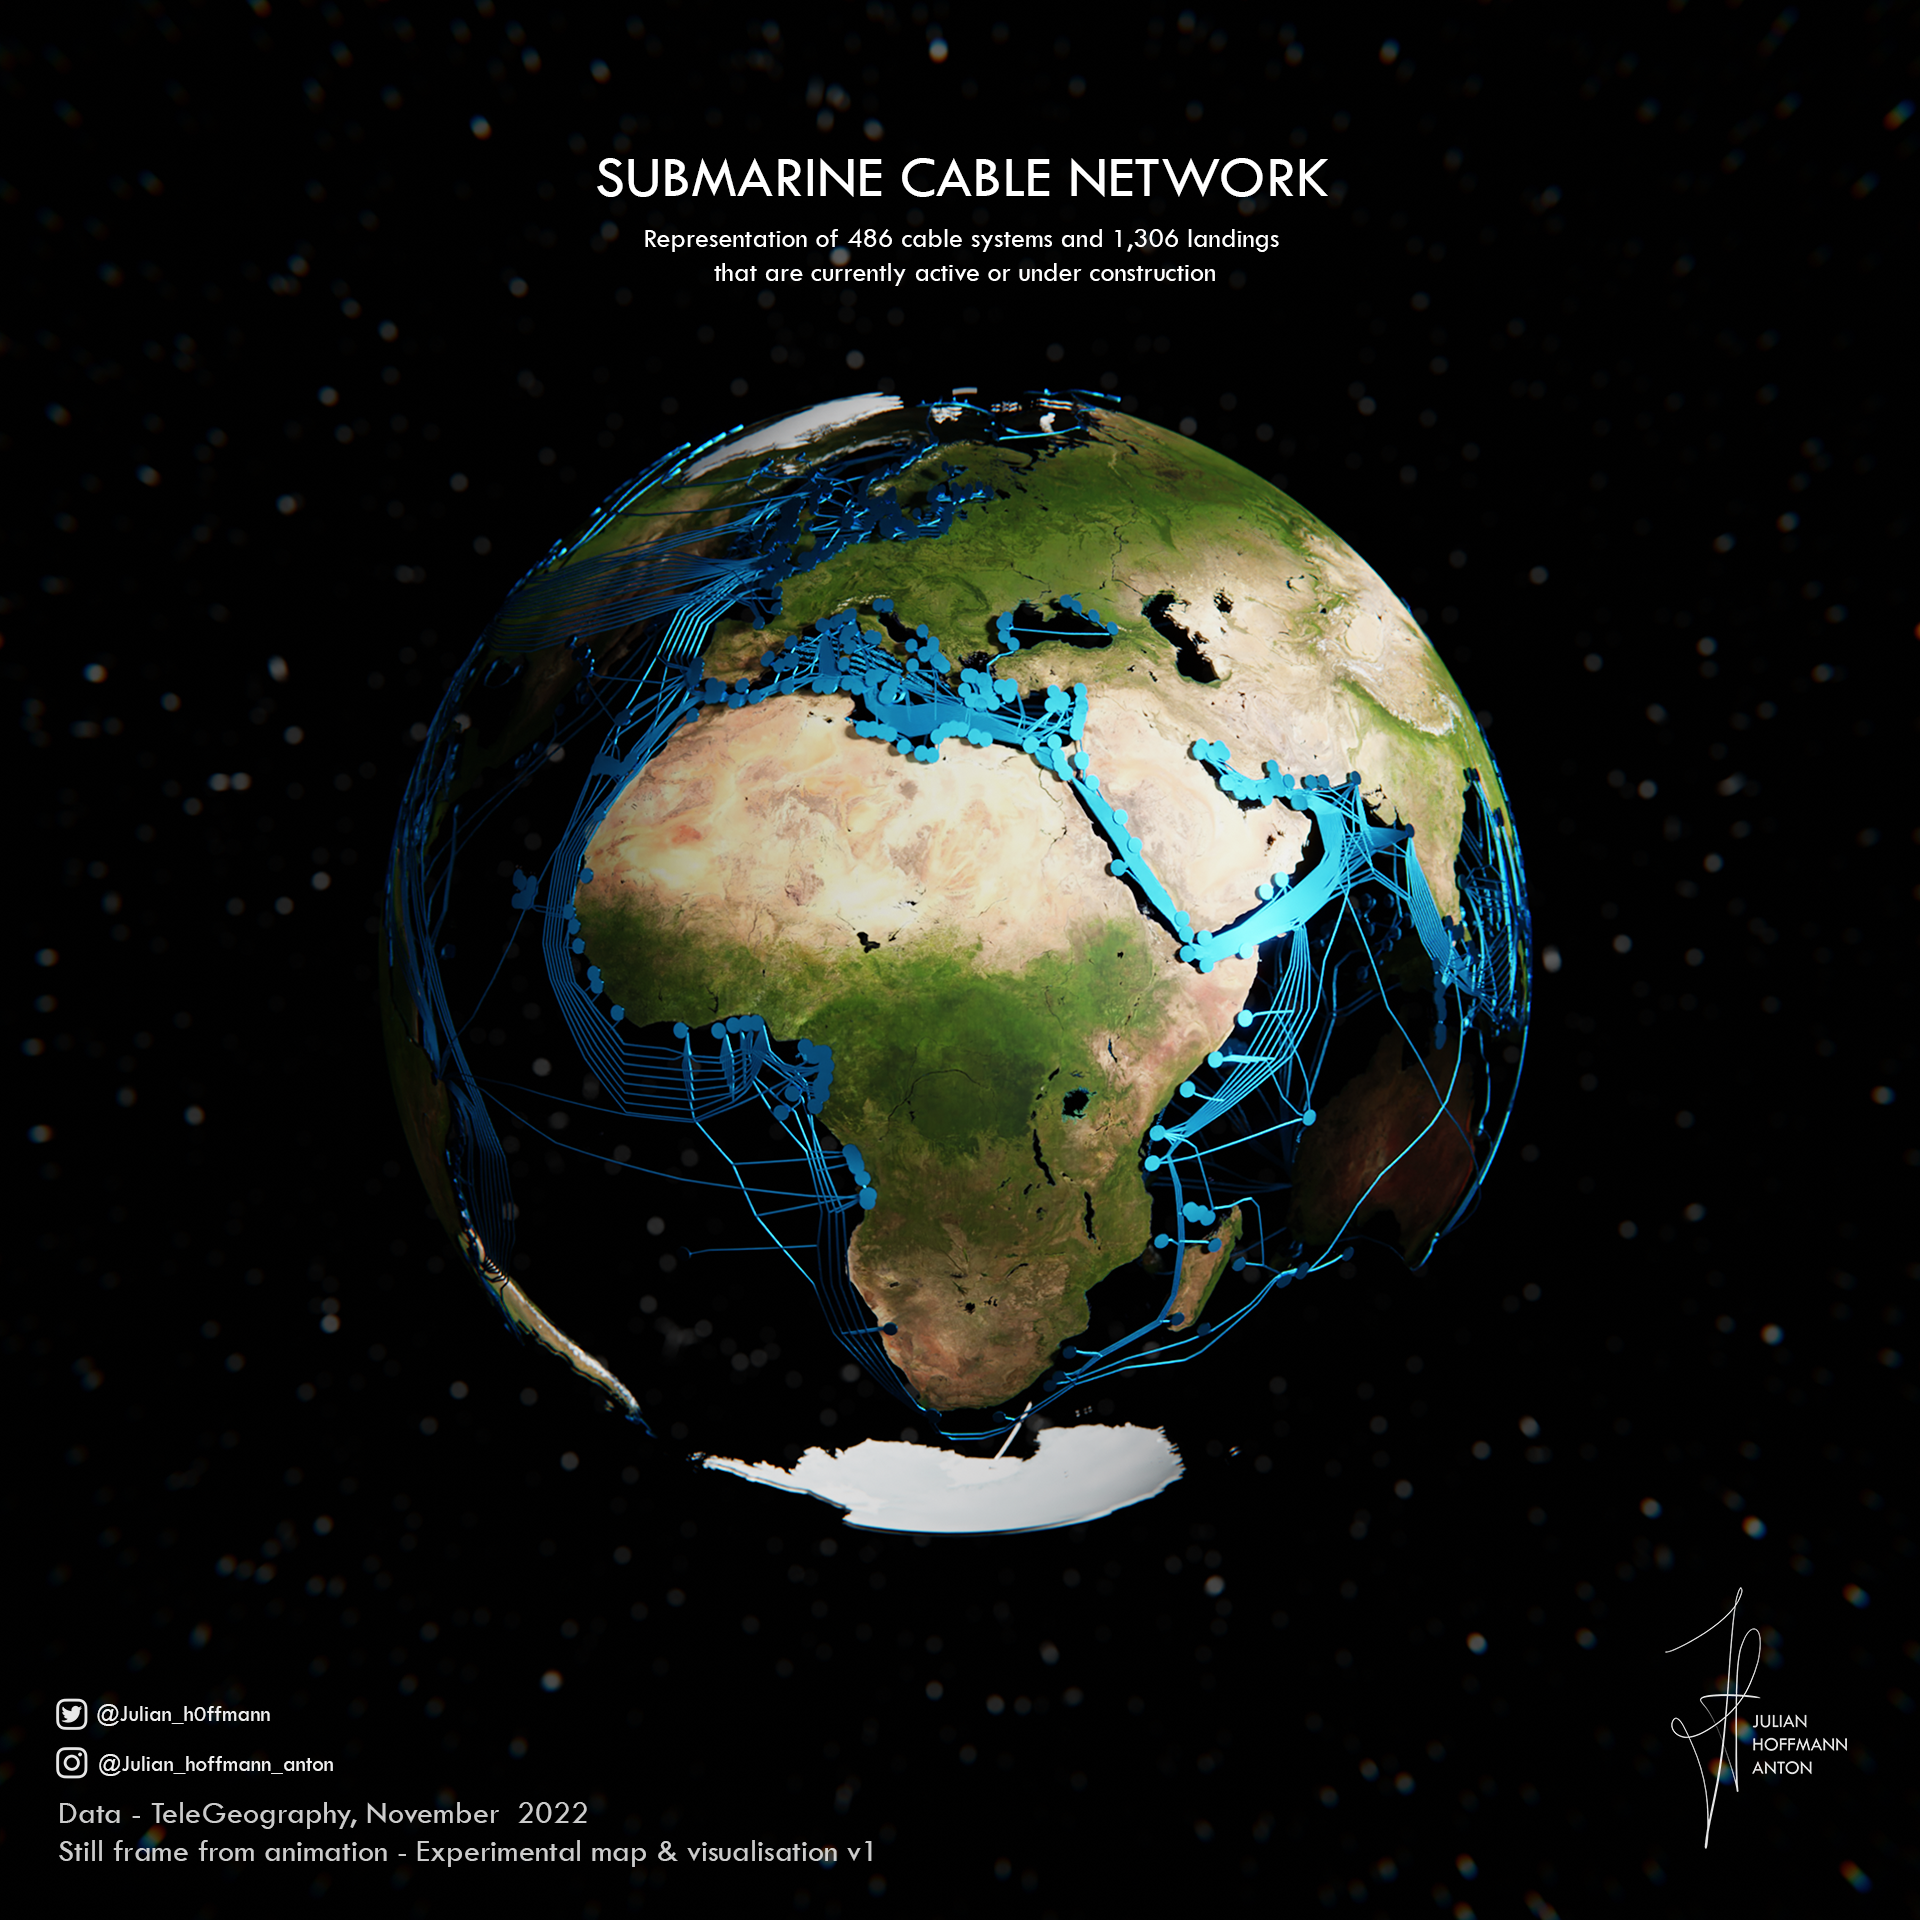
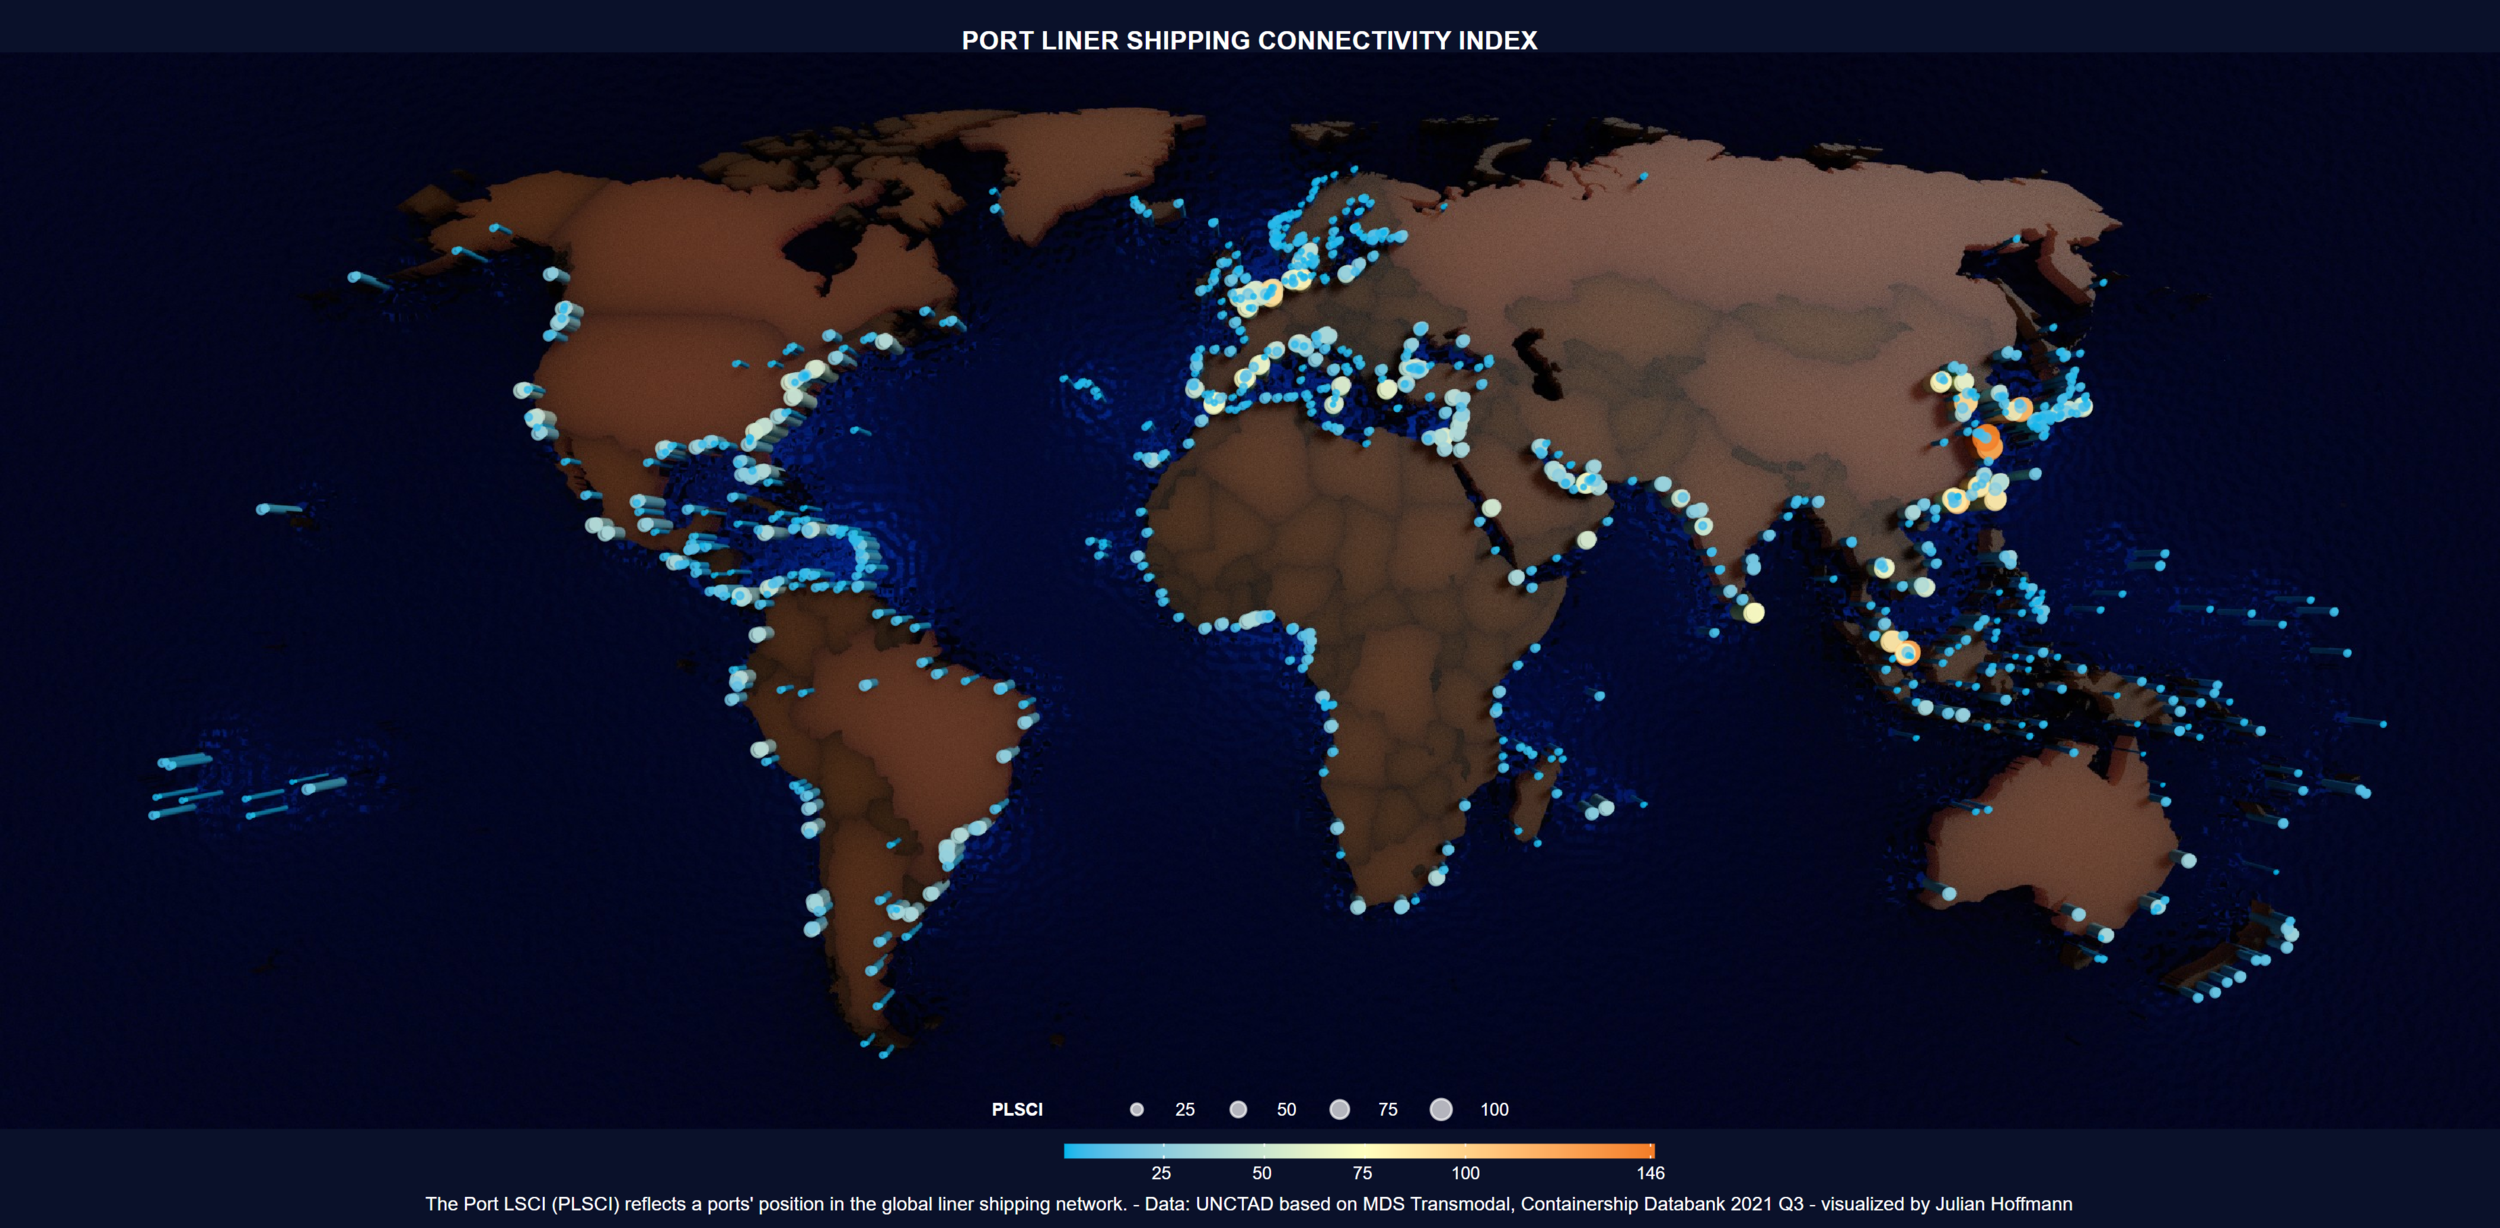
Global Shipping Density Network

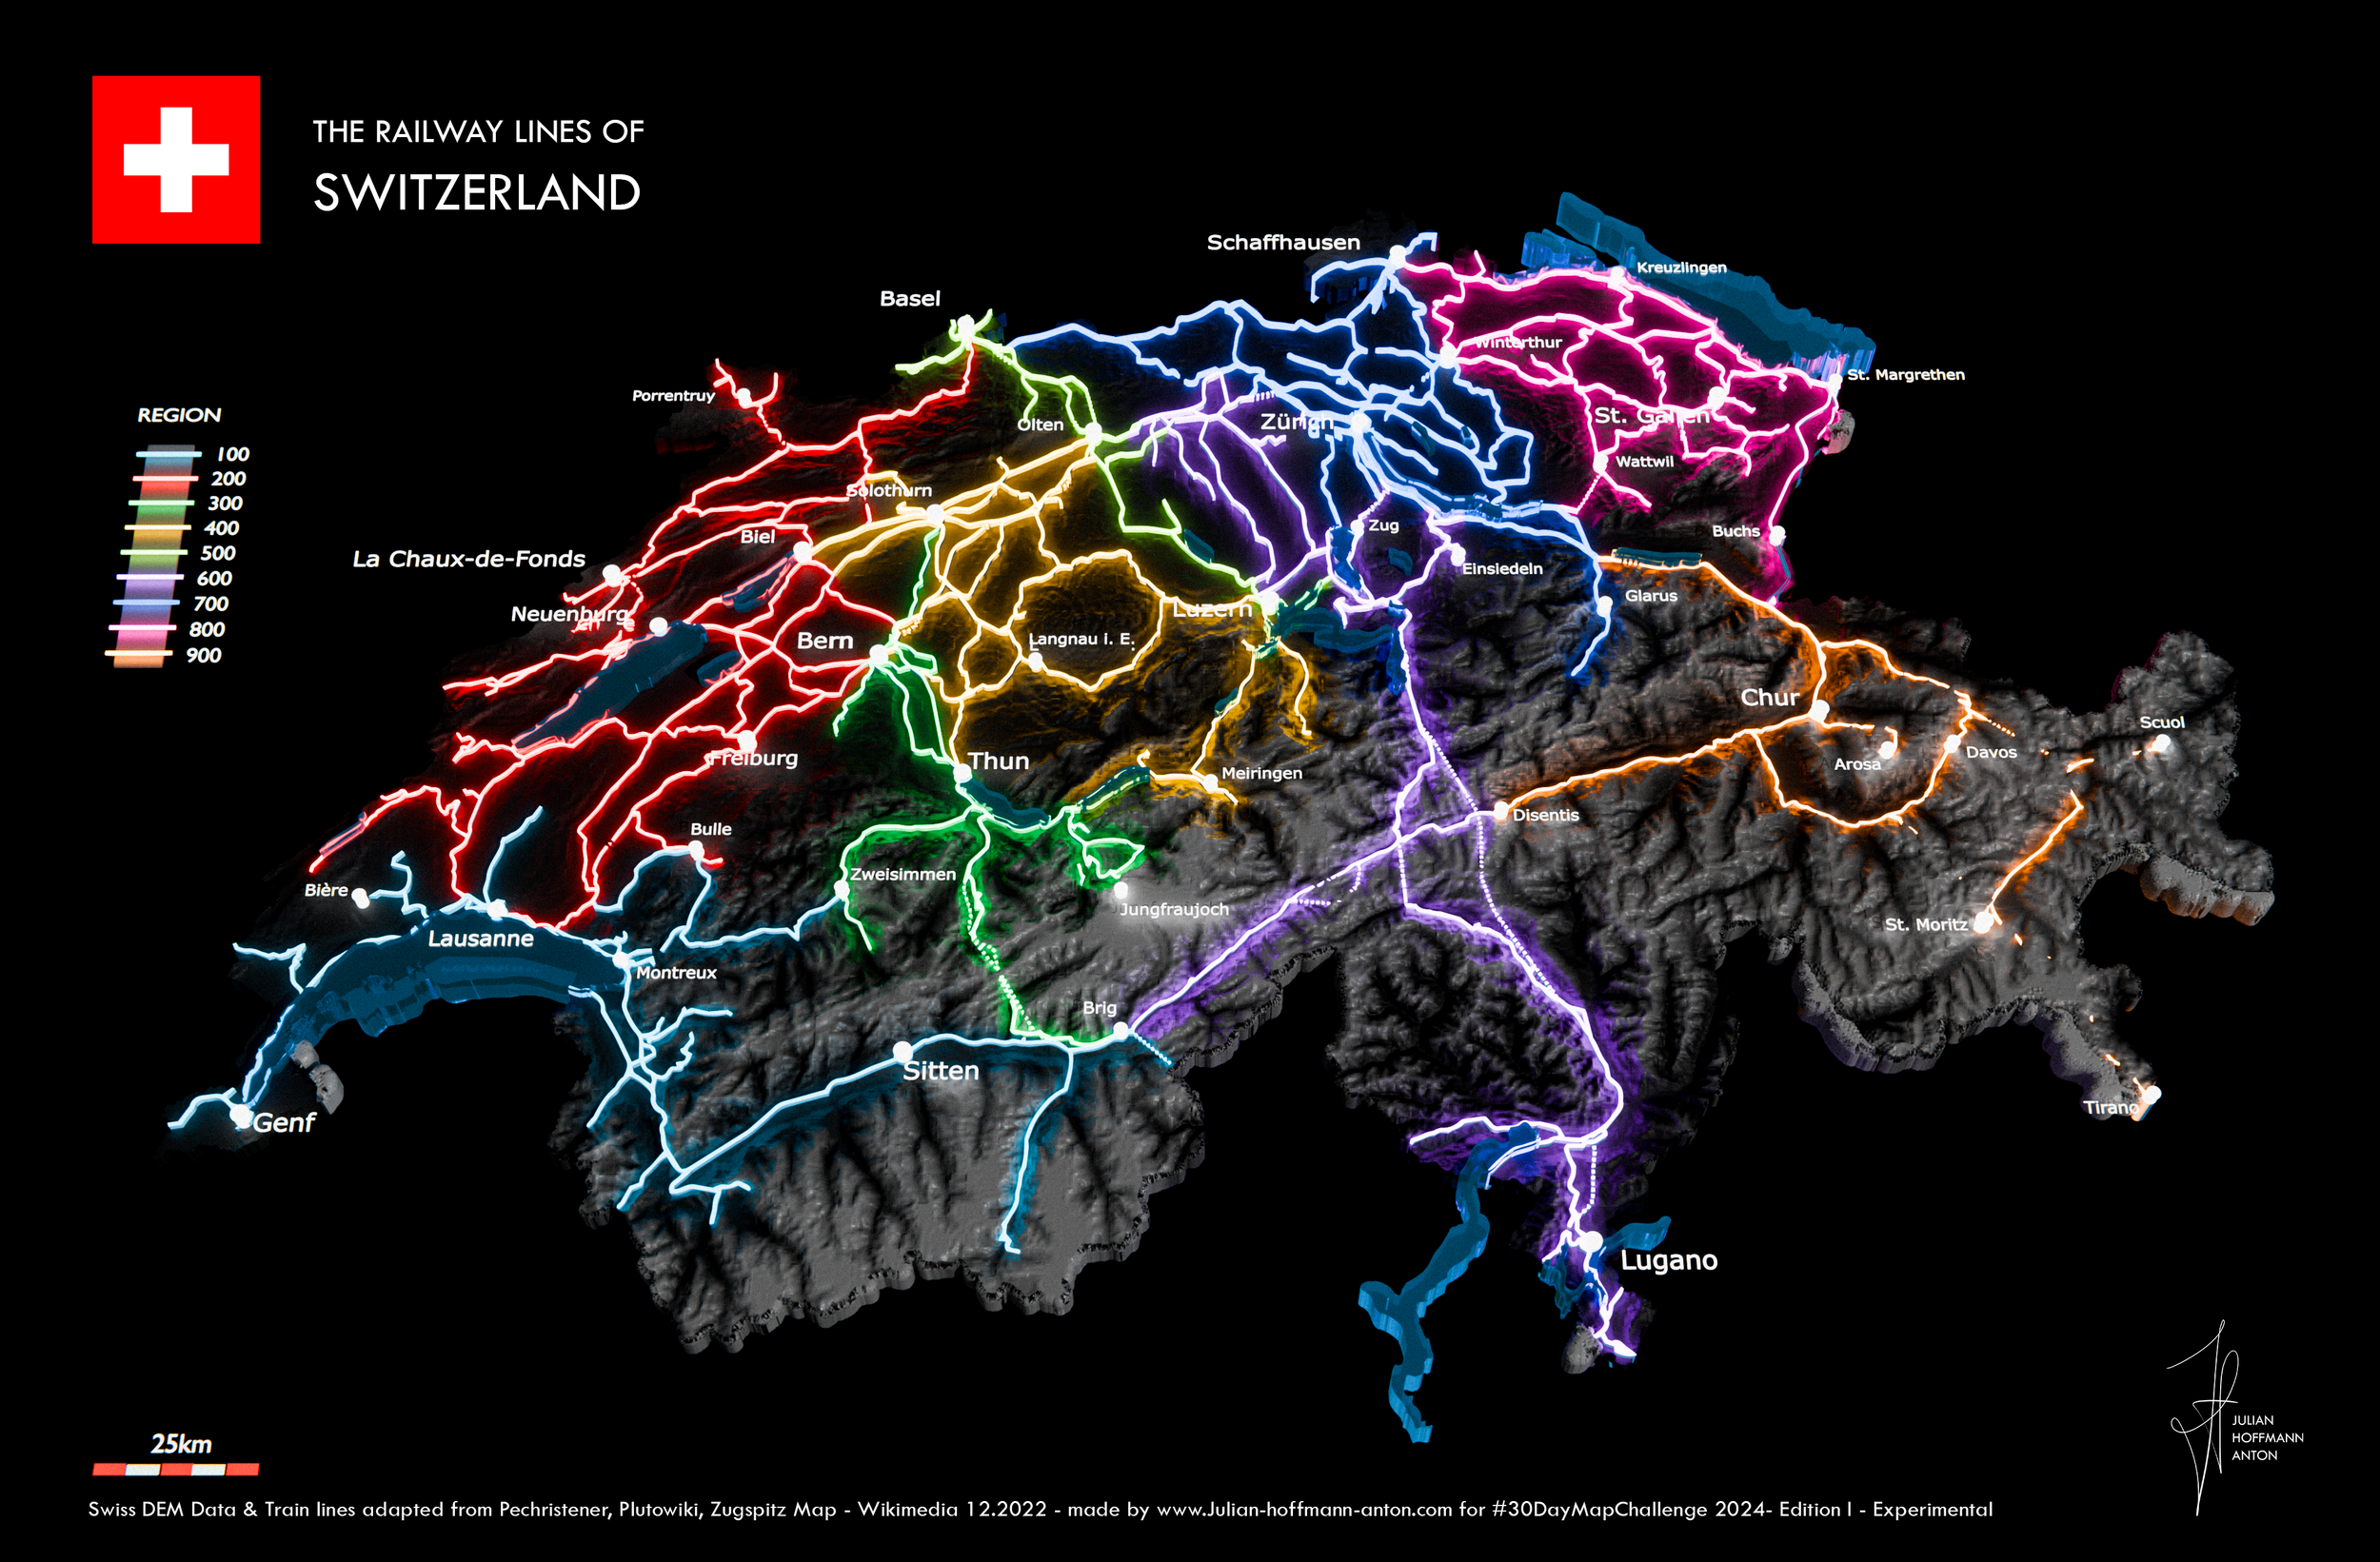
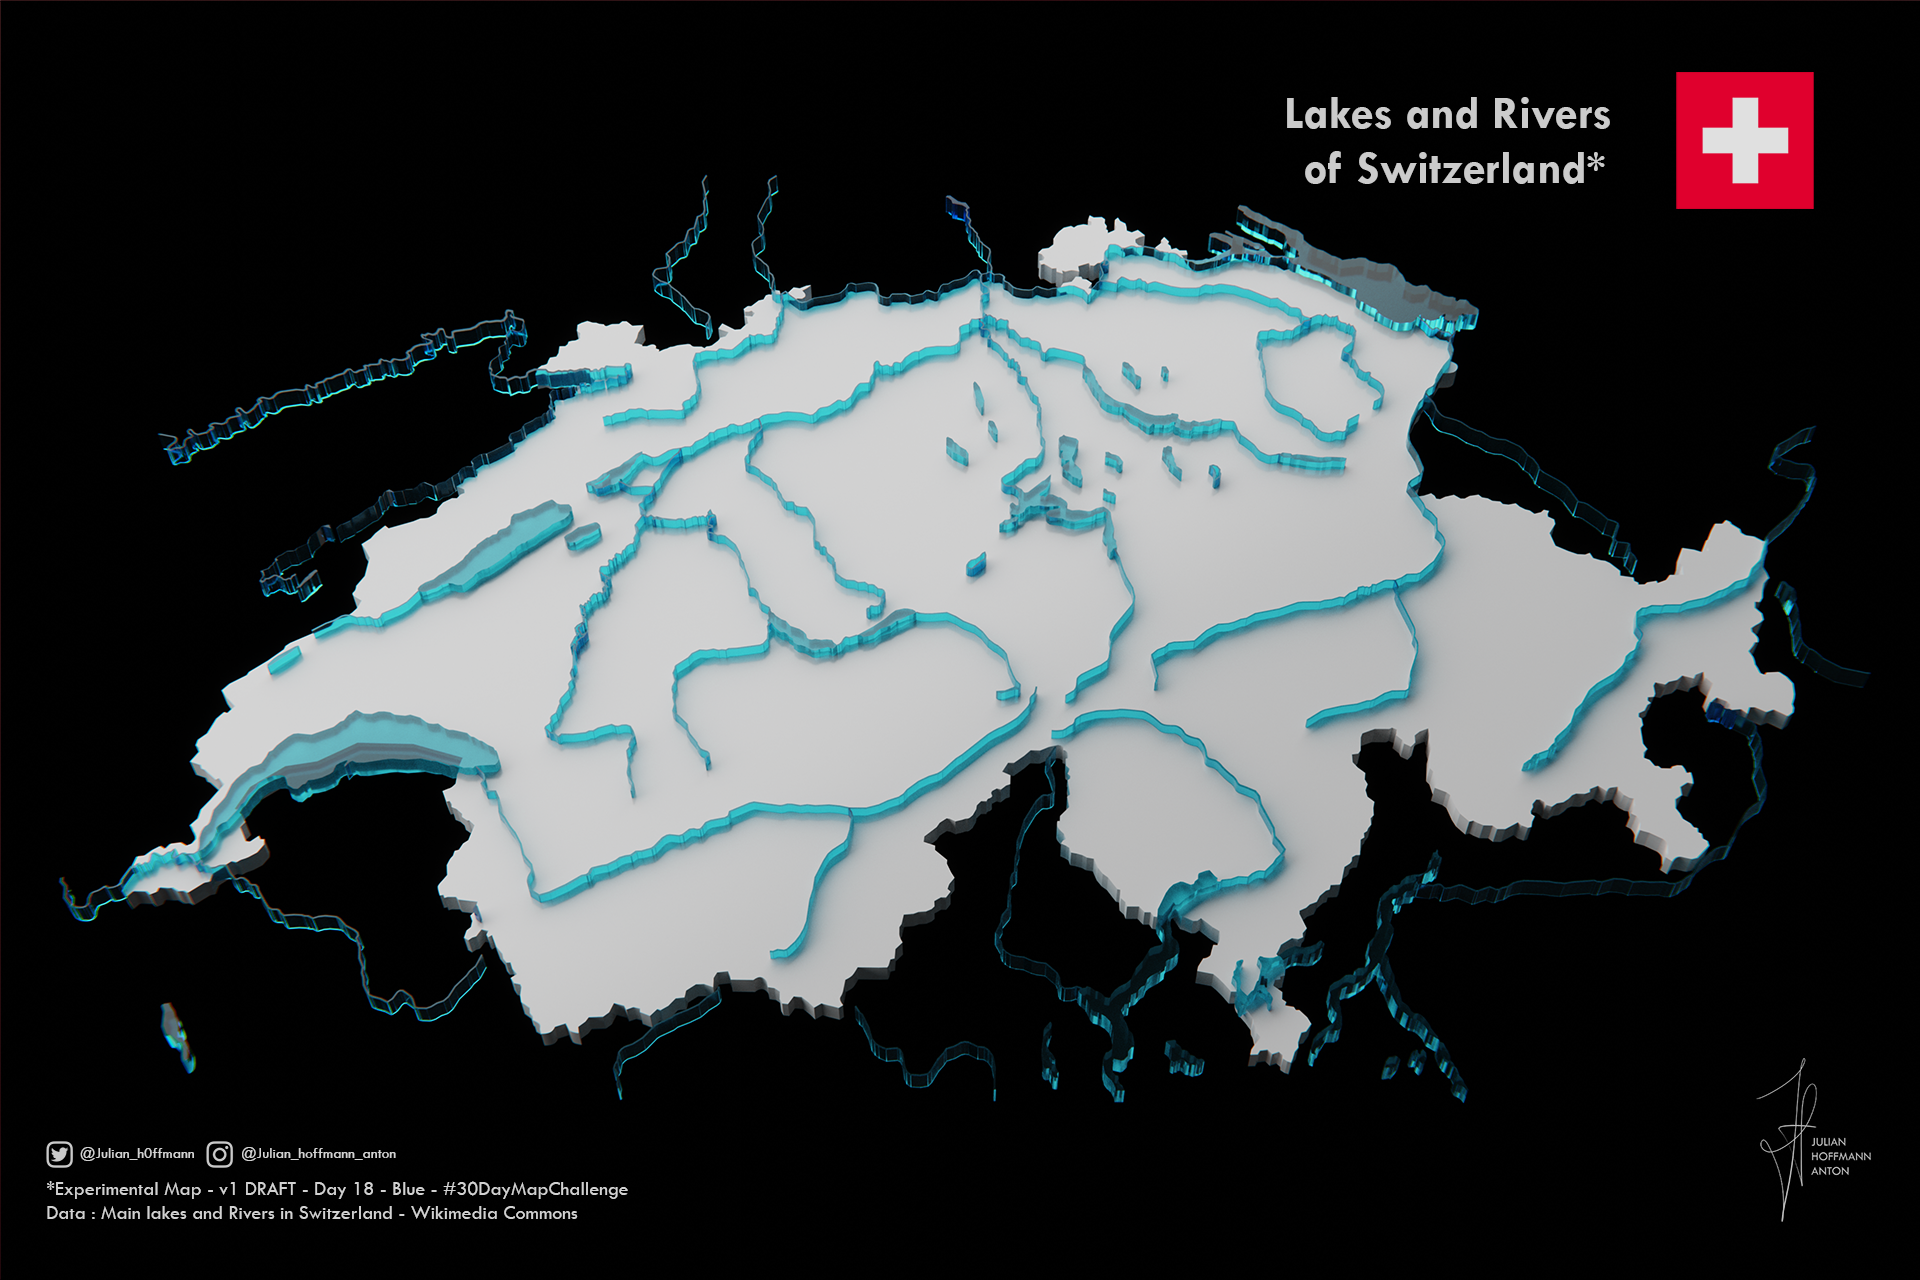
The Train Lines of Switzerland


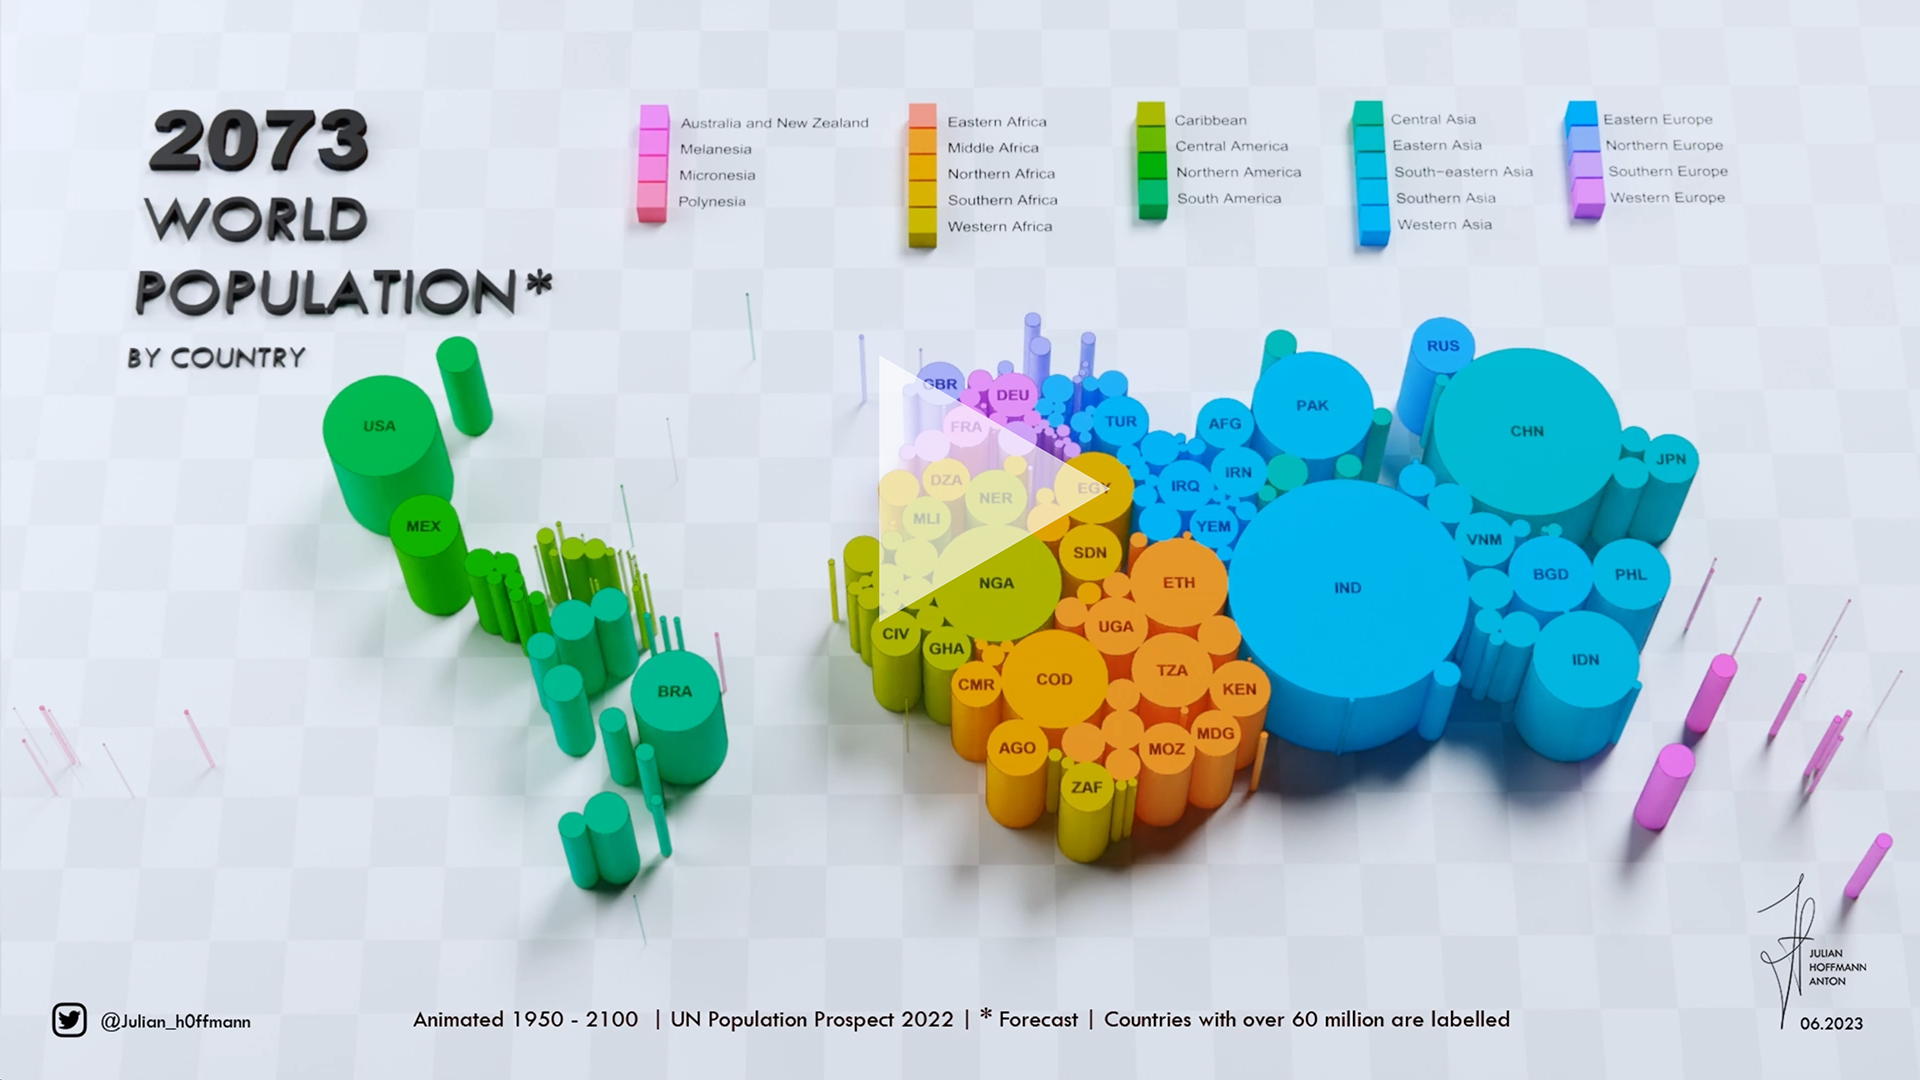
World Population 1950 - 2100
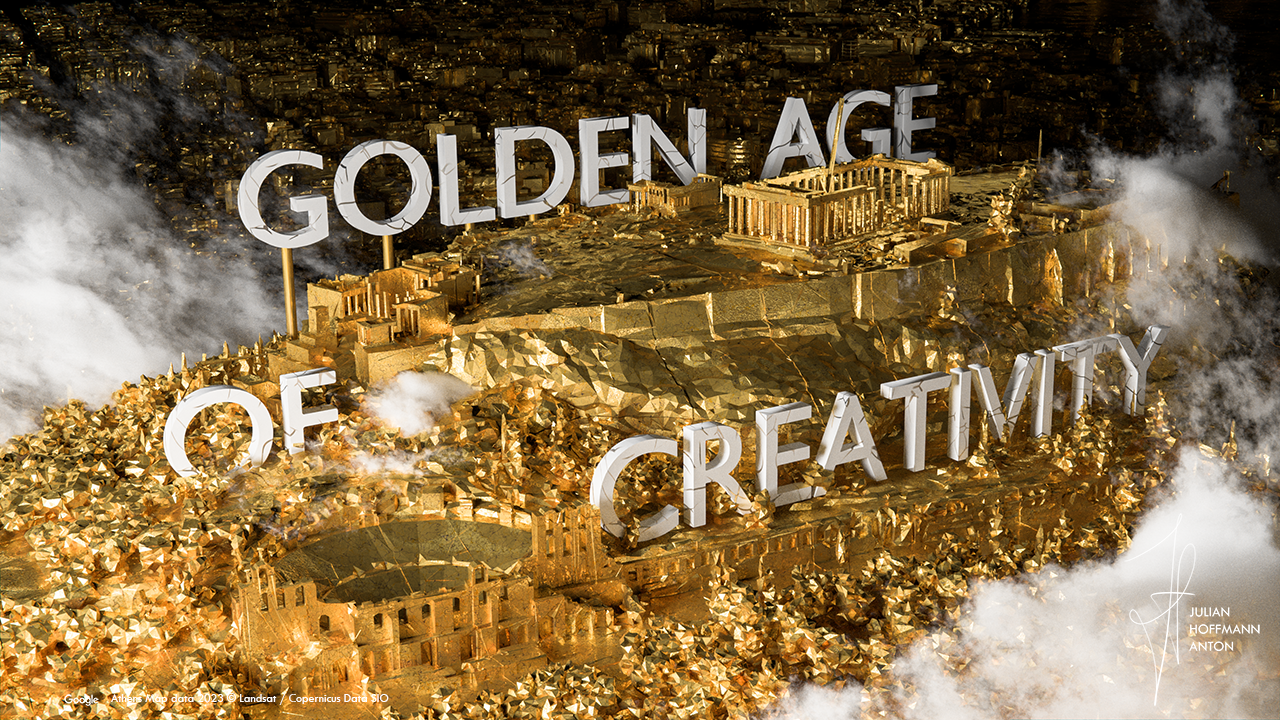
Golden Age of Creativity
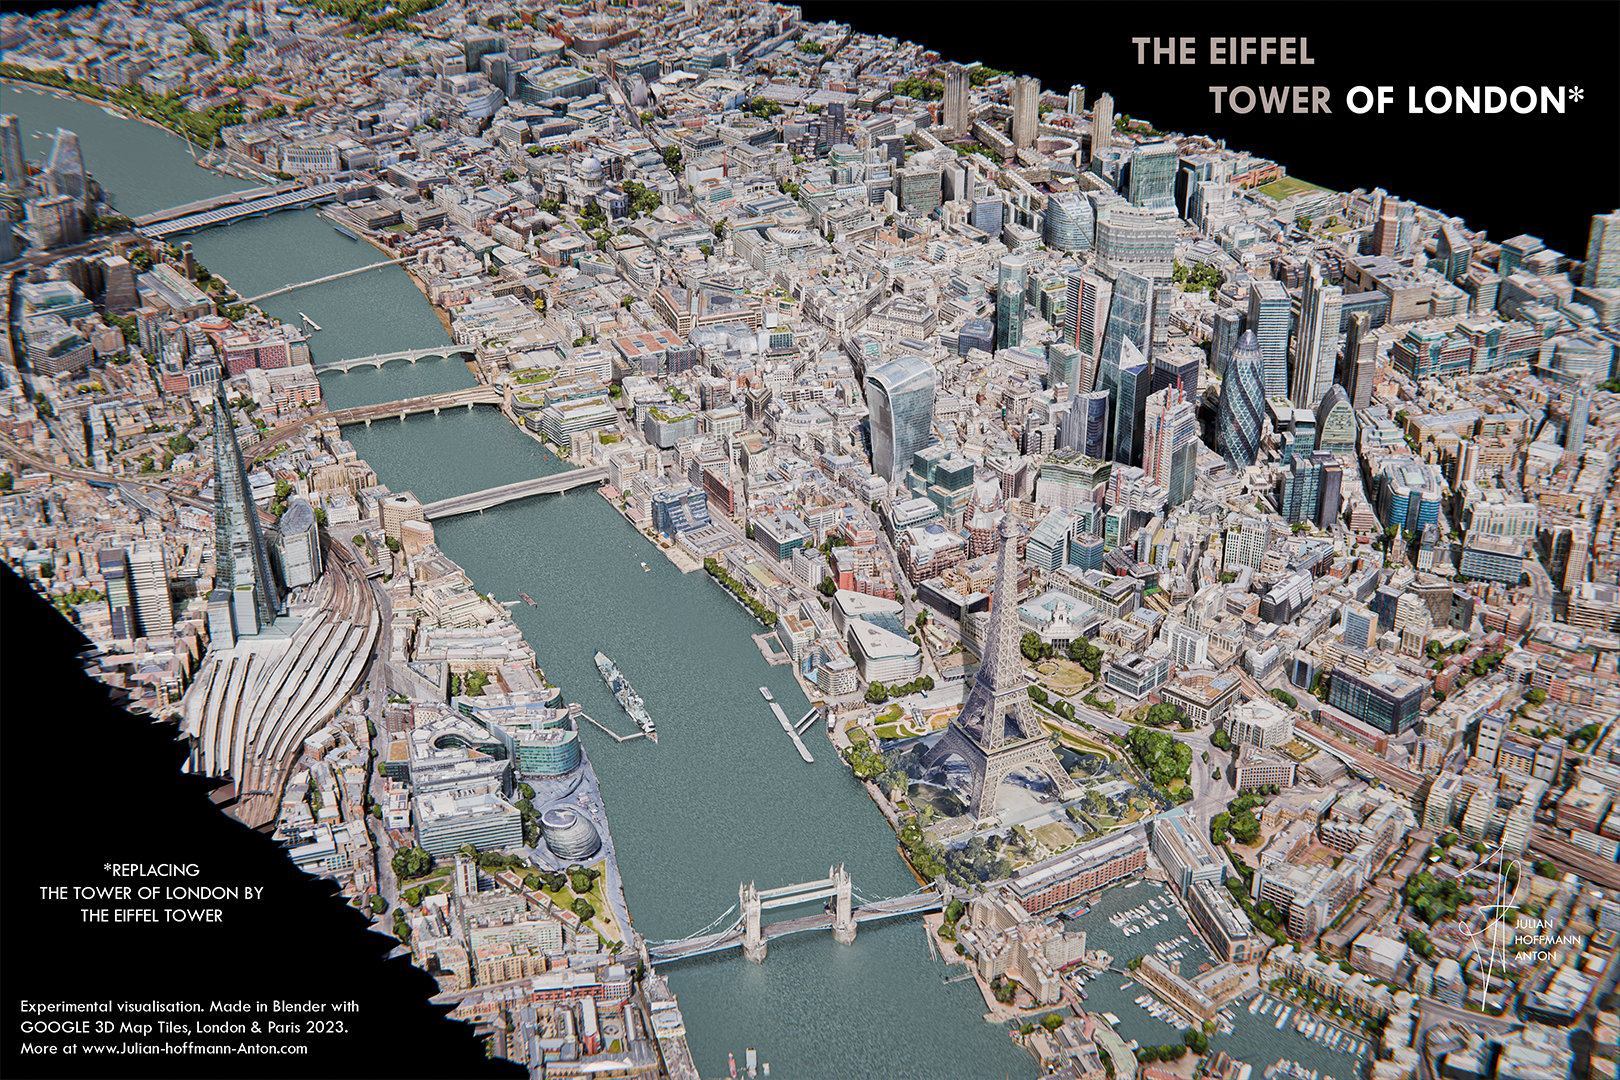
The Eiffel Tower of London
Paris Neon-Expo v1


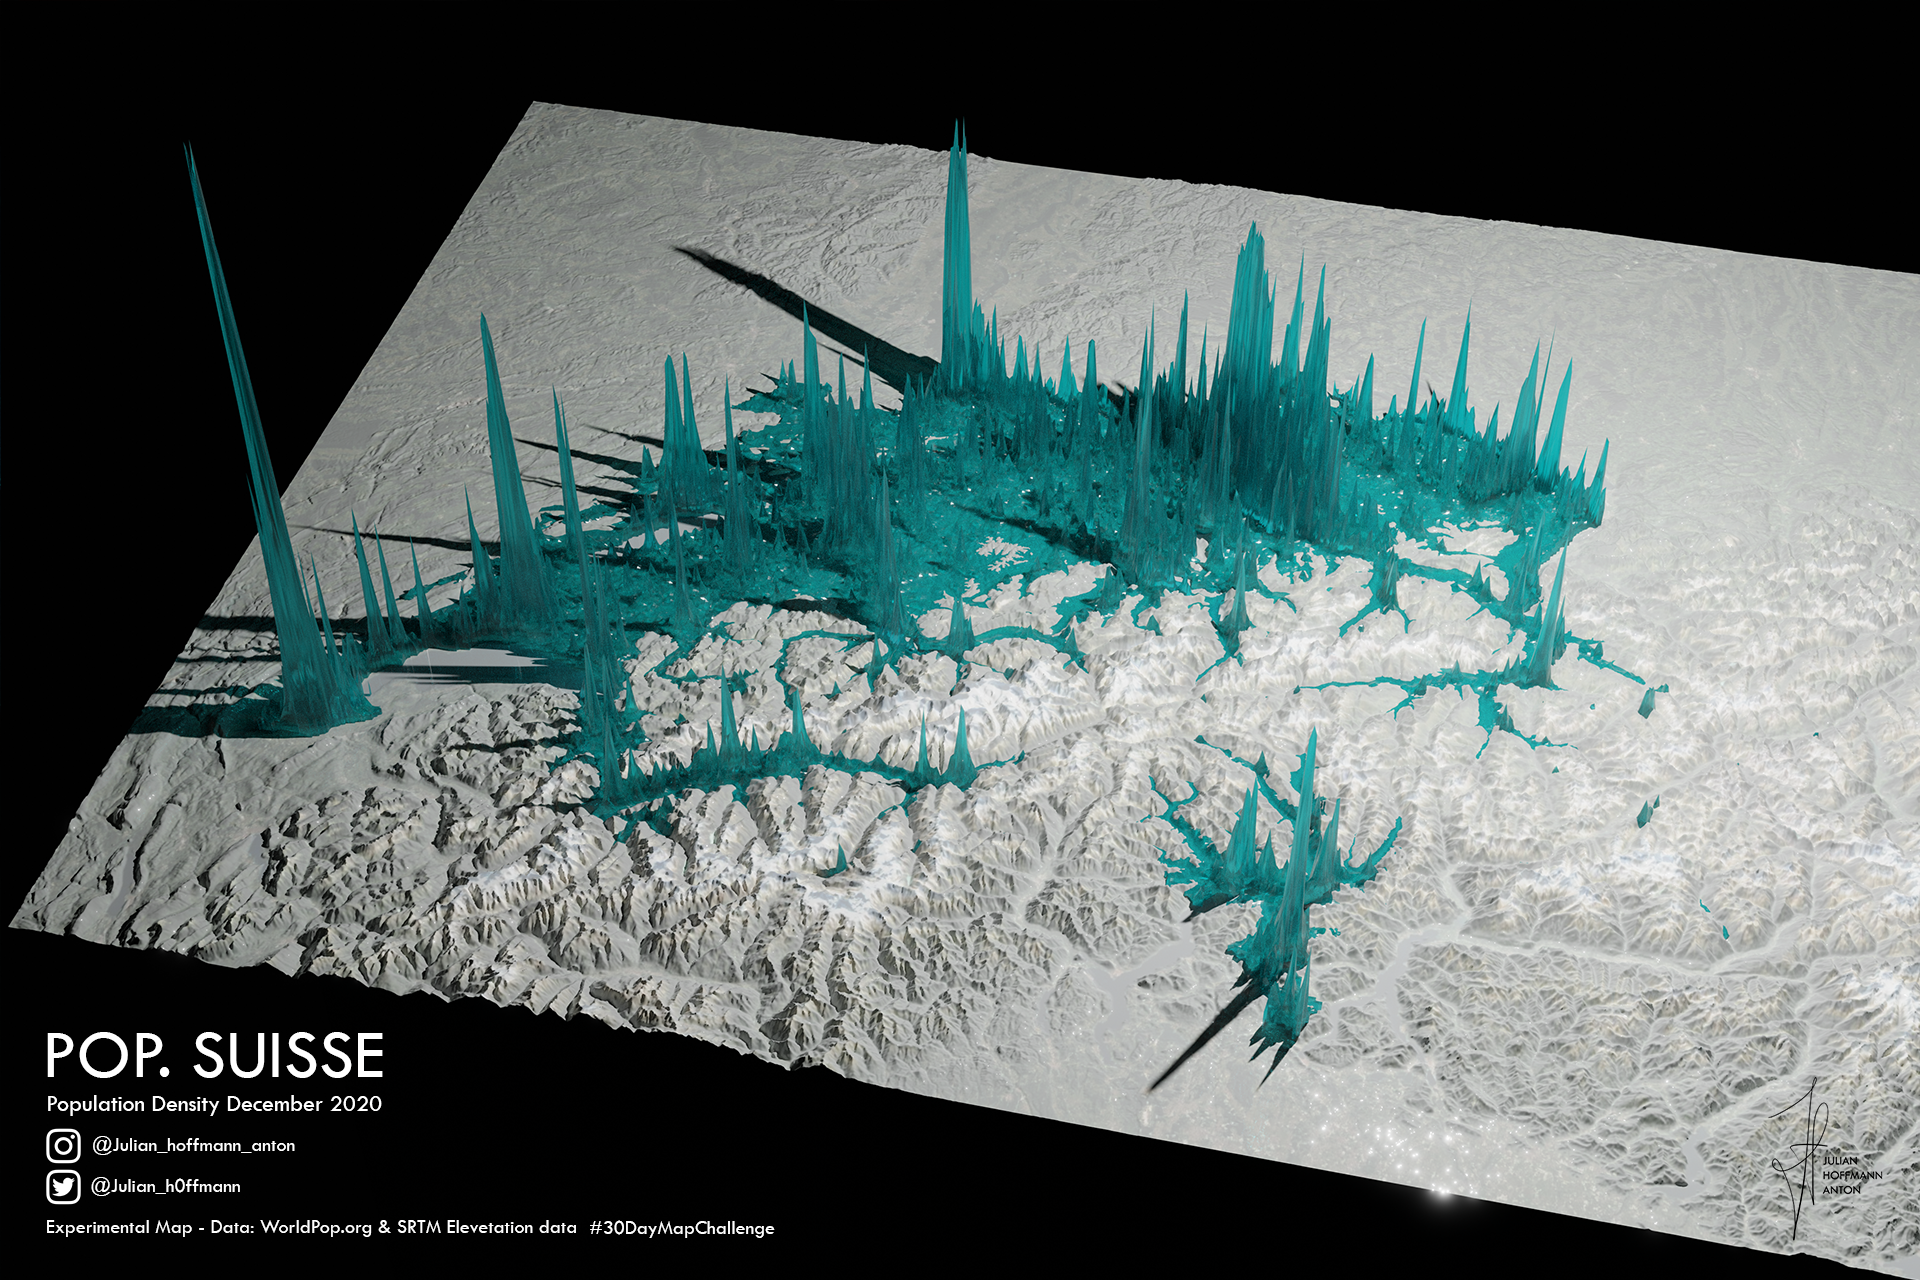
Population density of Switzerland
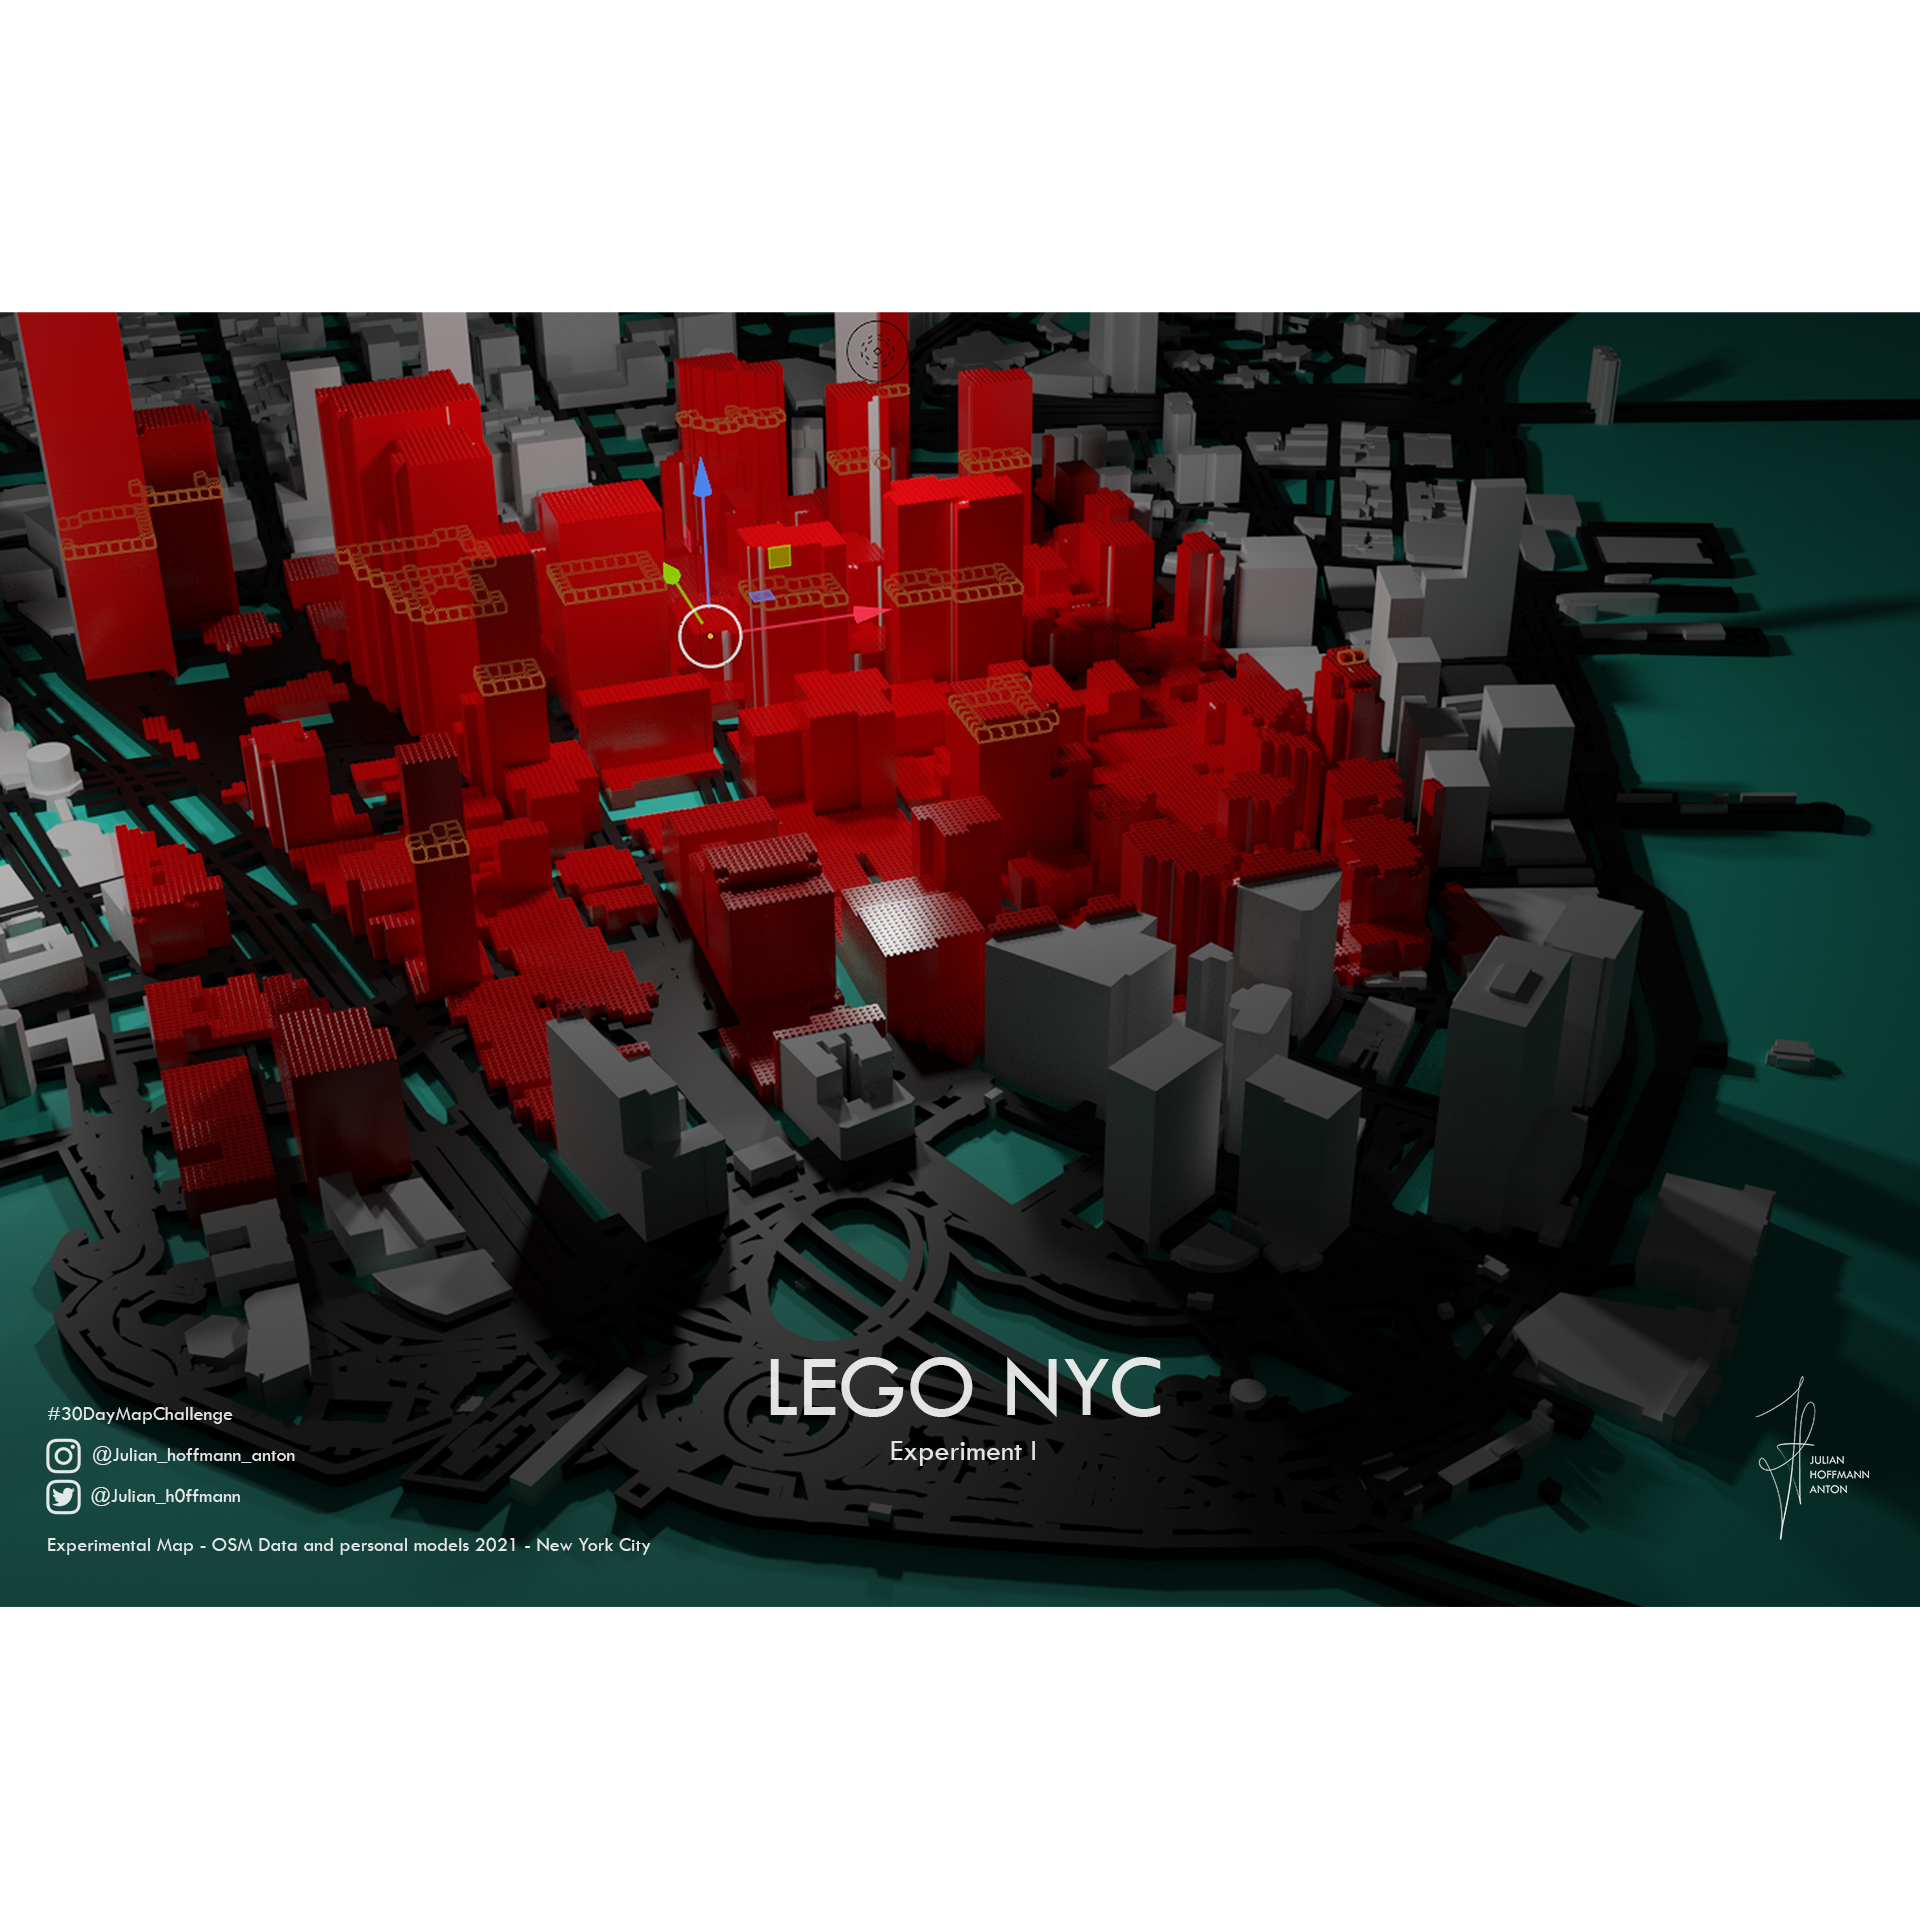
Pieces of the USA


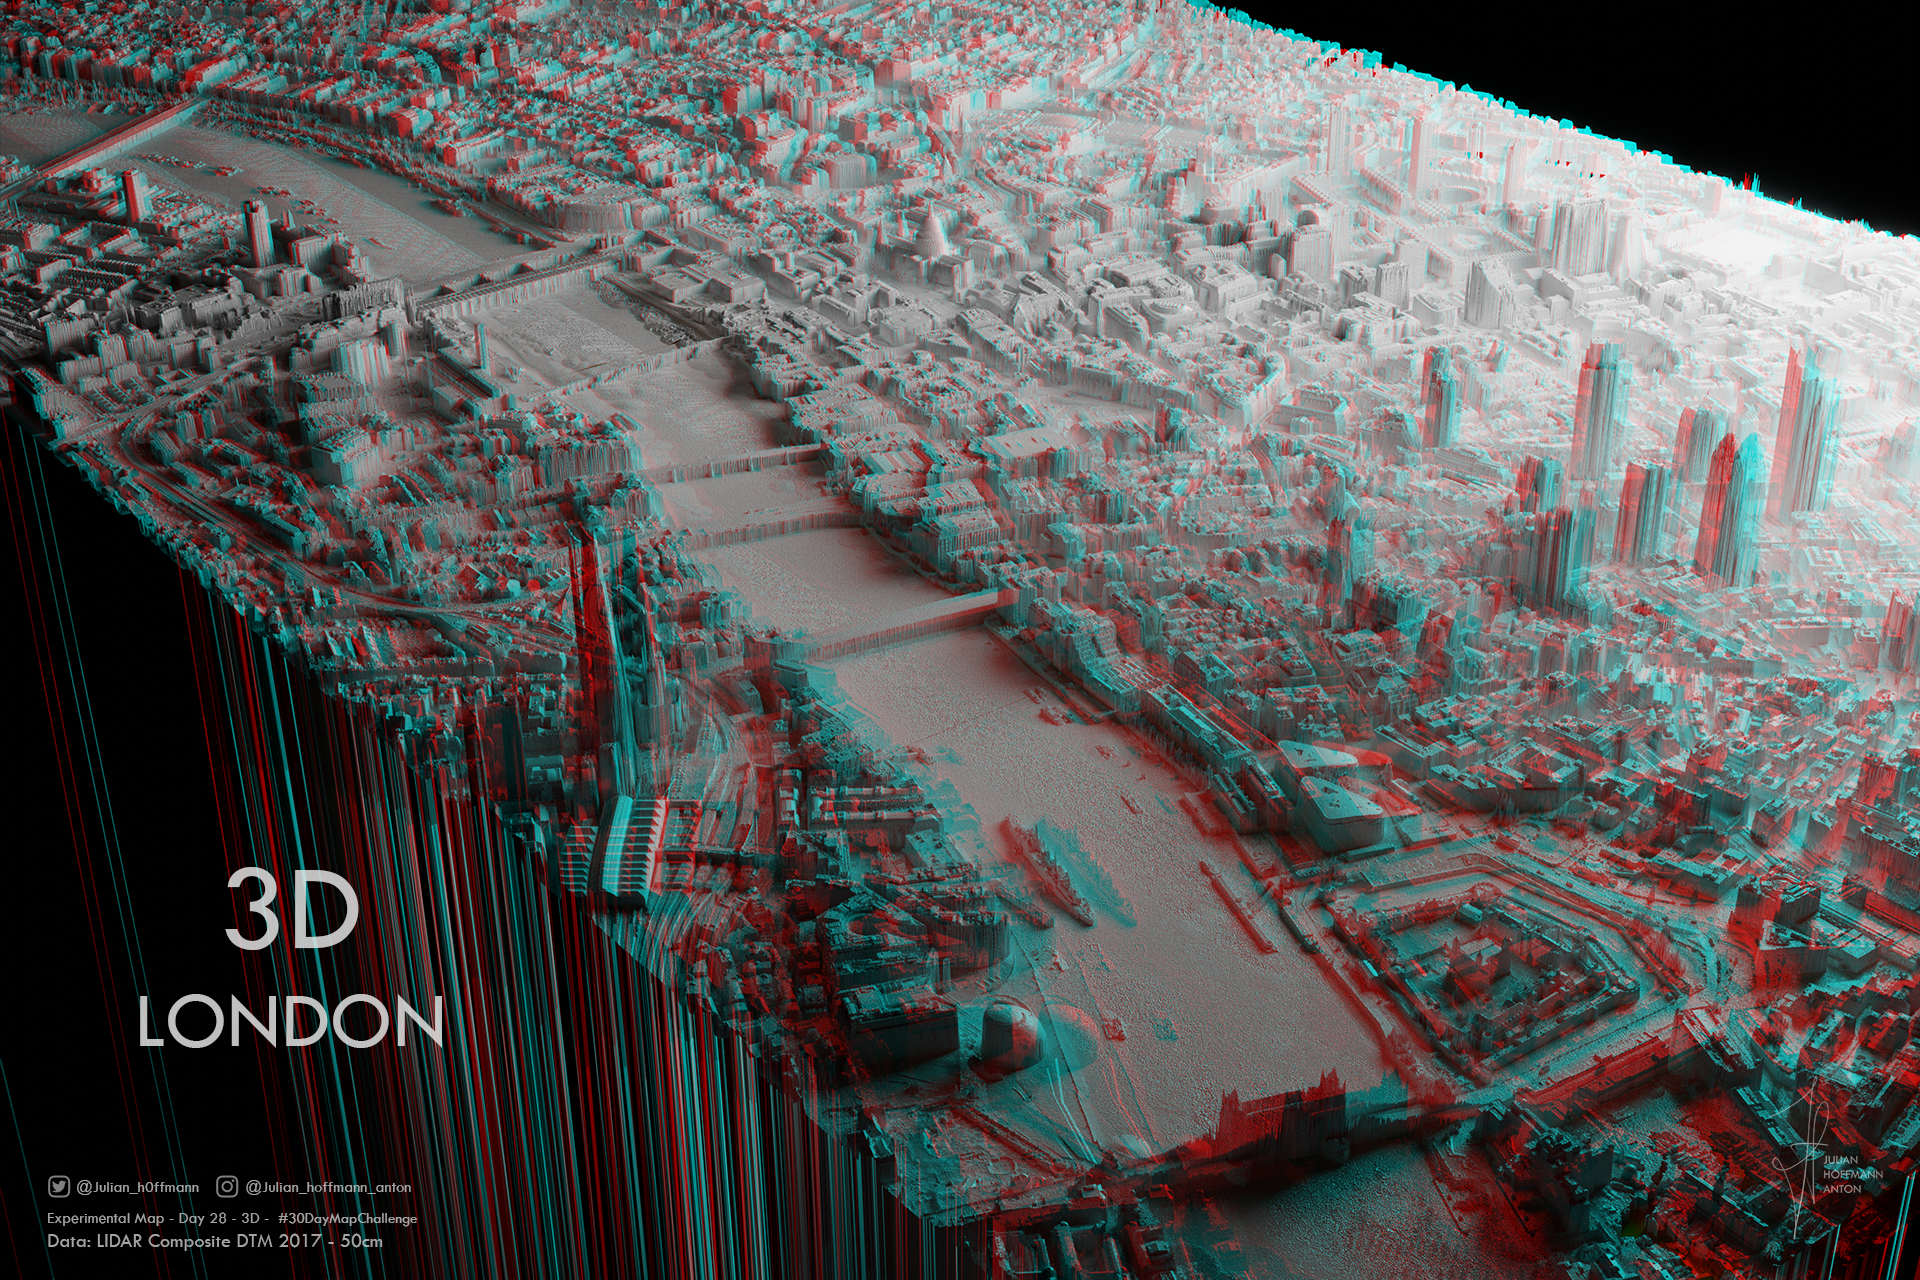
3D London
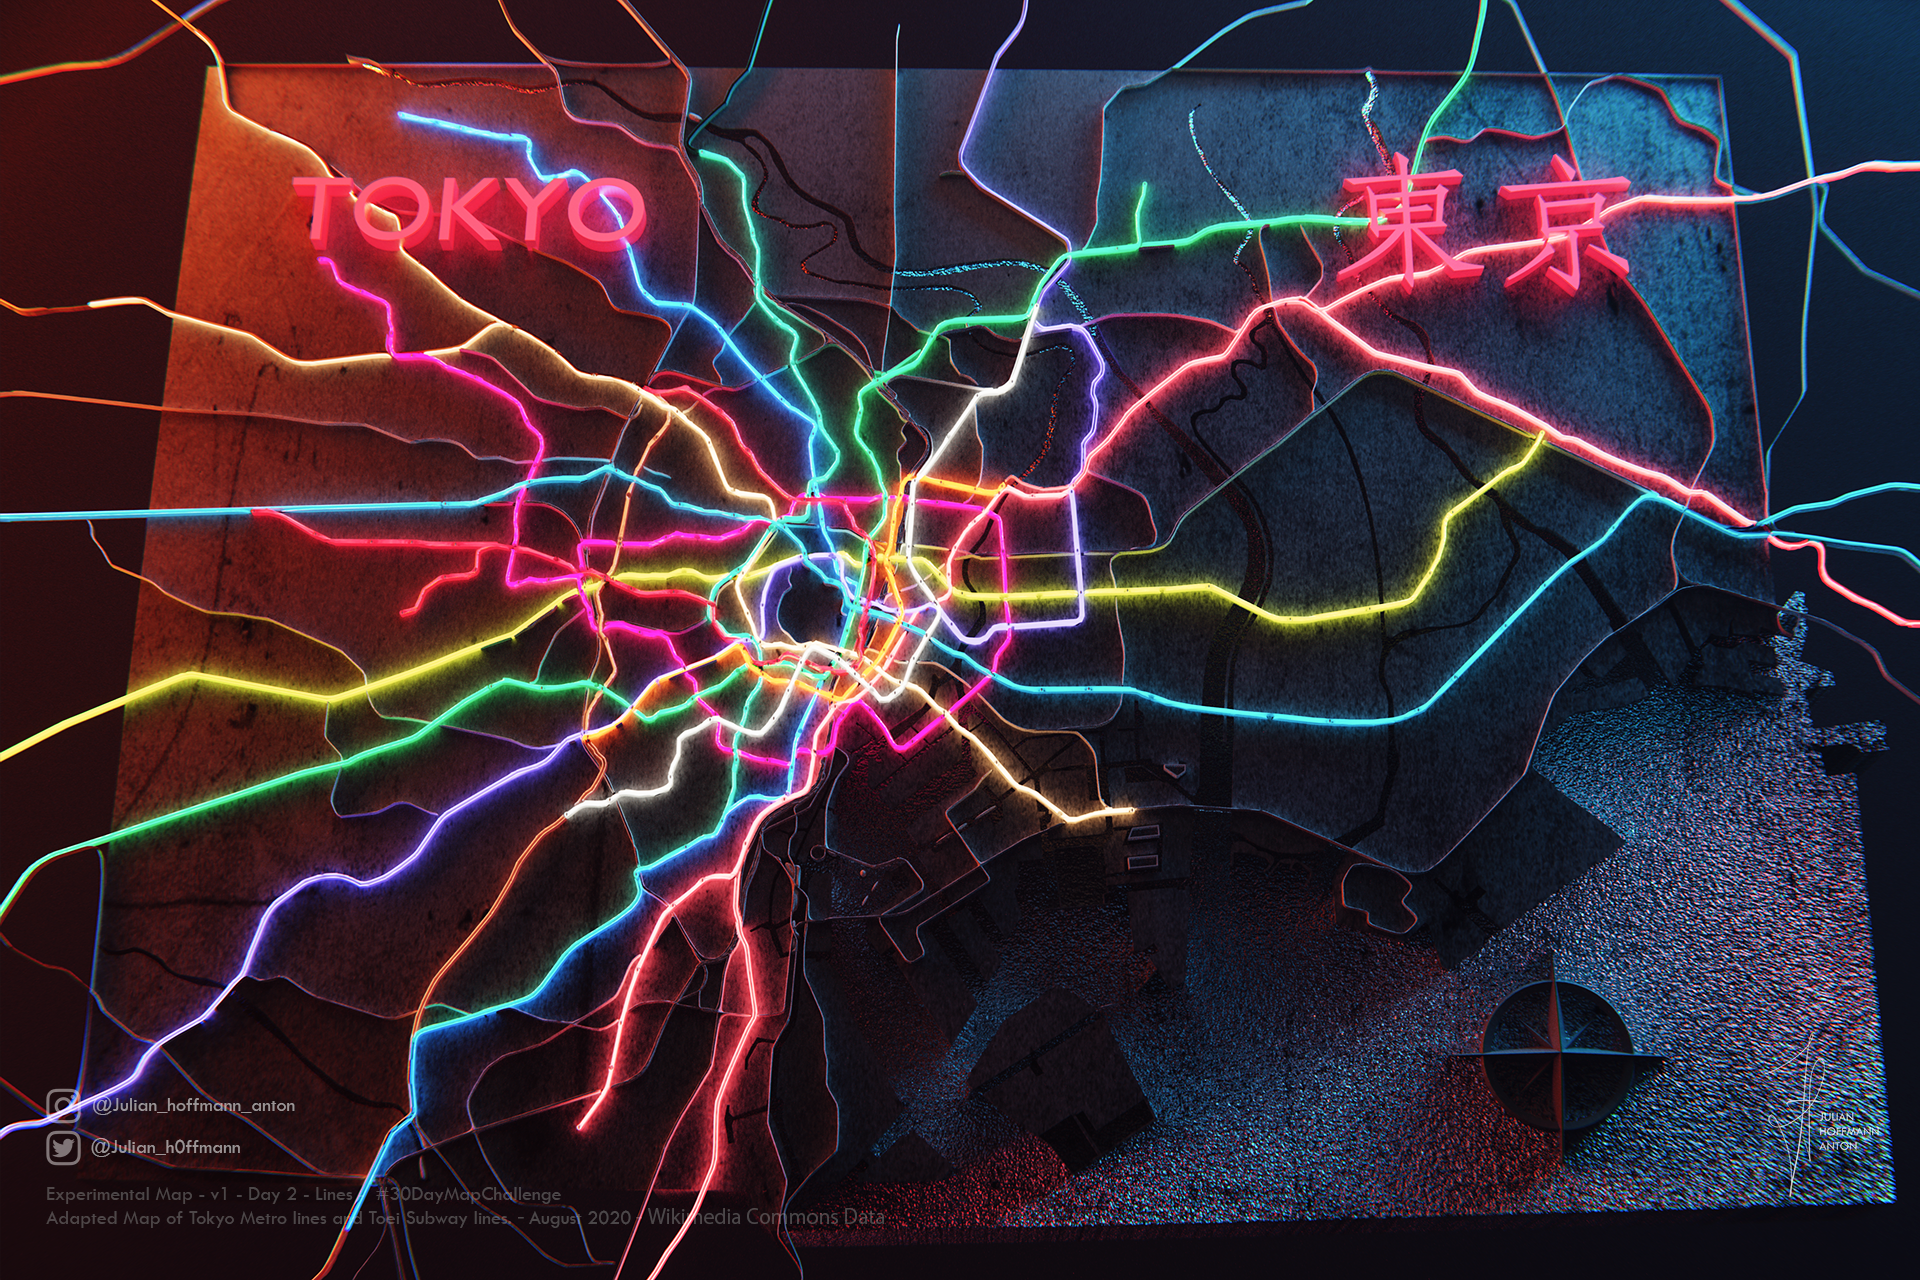
Tokyo Lines

Tokyo Eat Map BTS

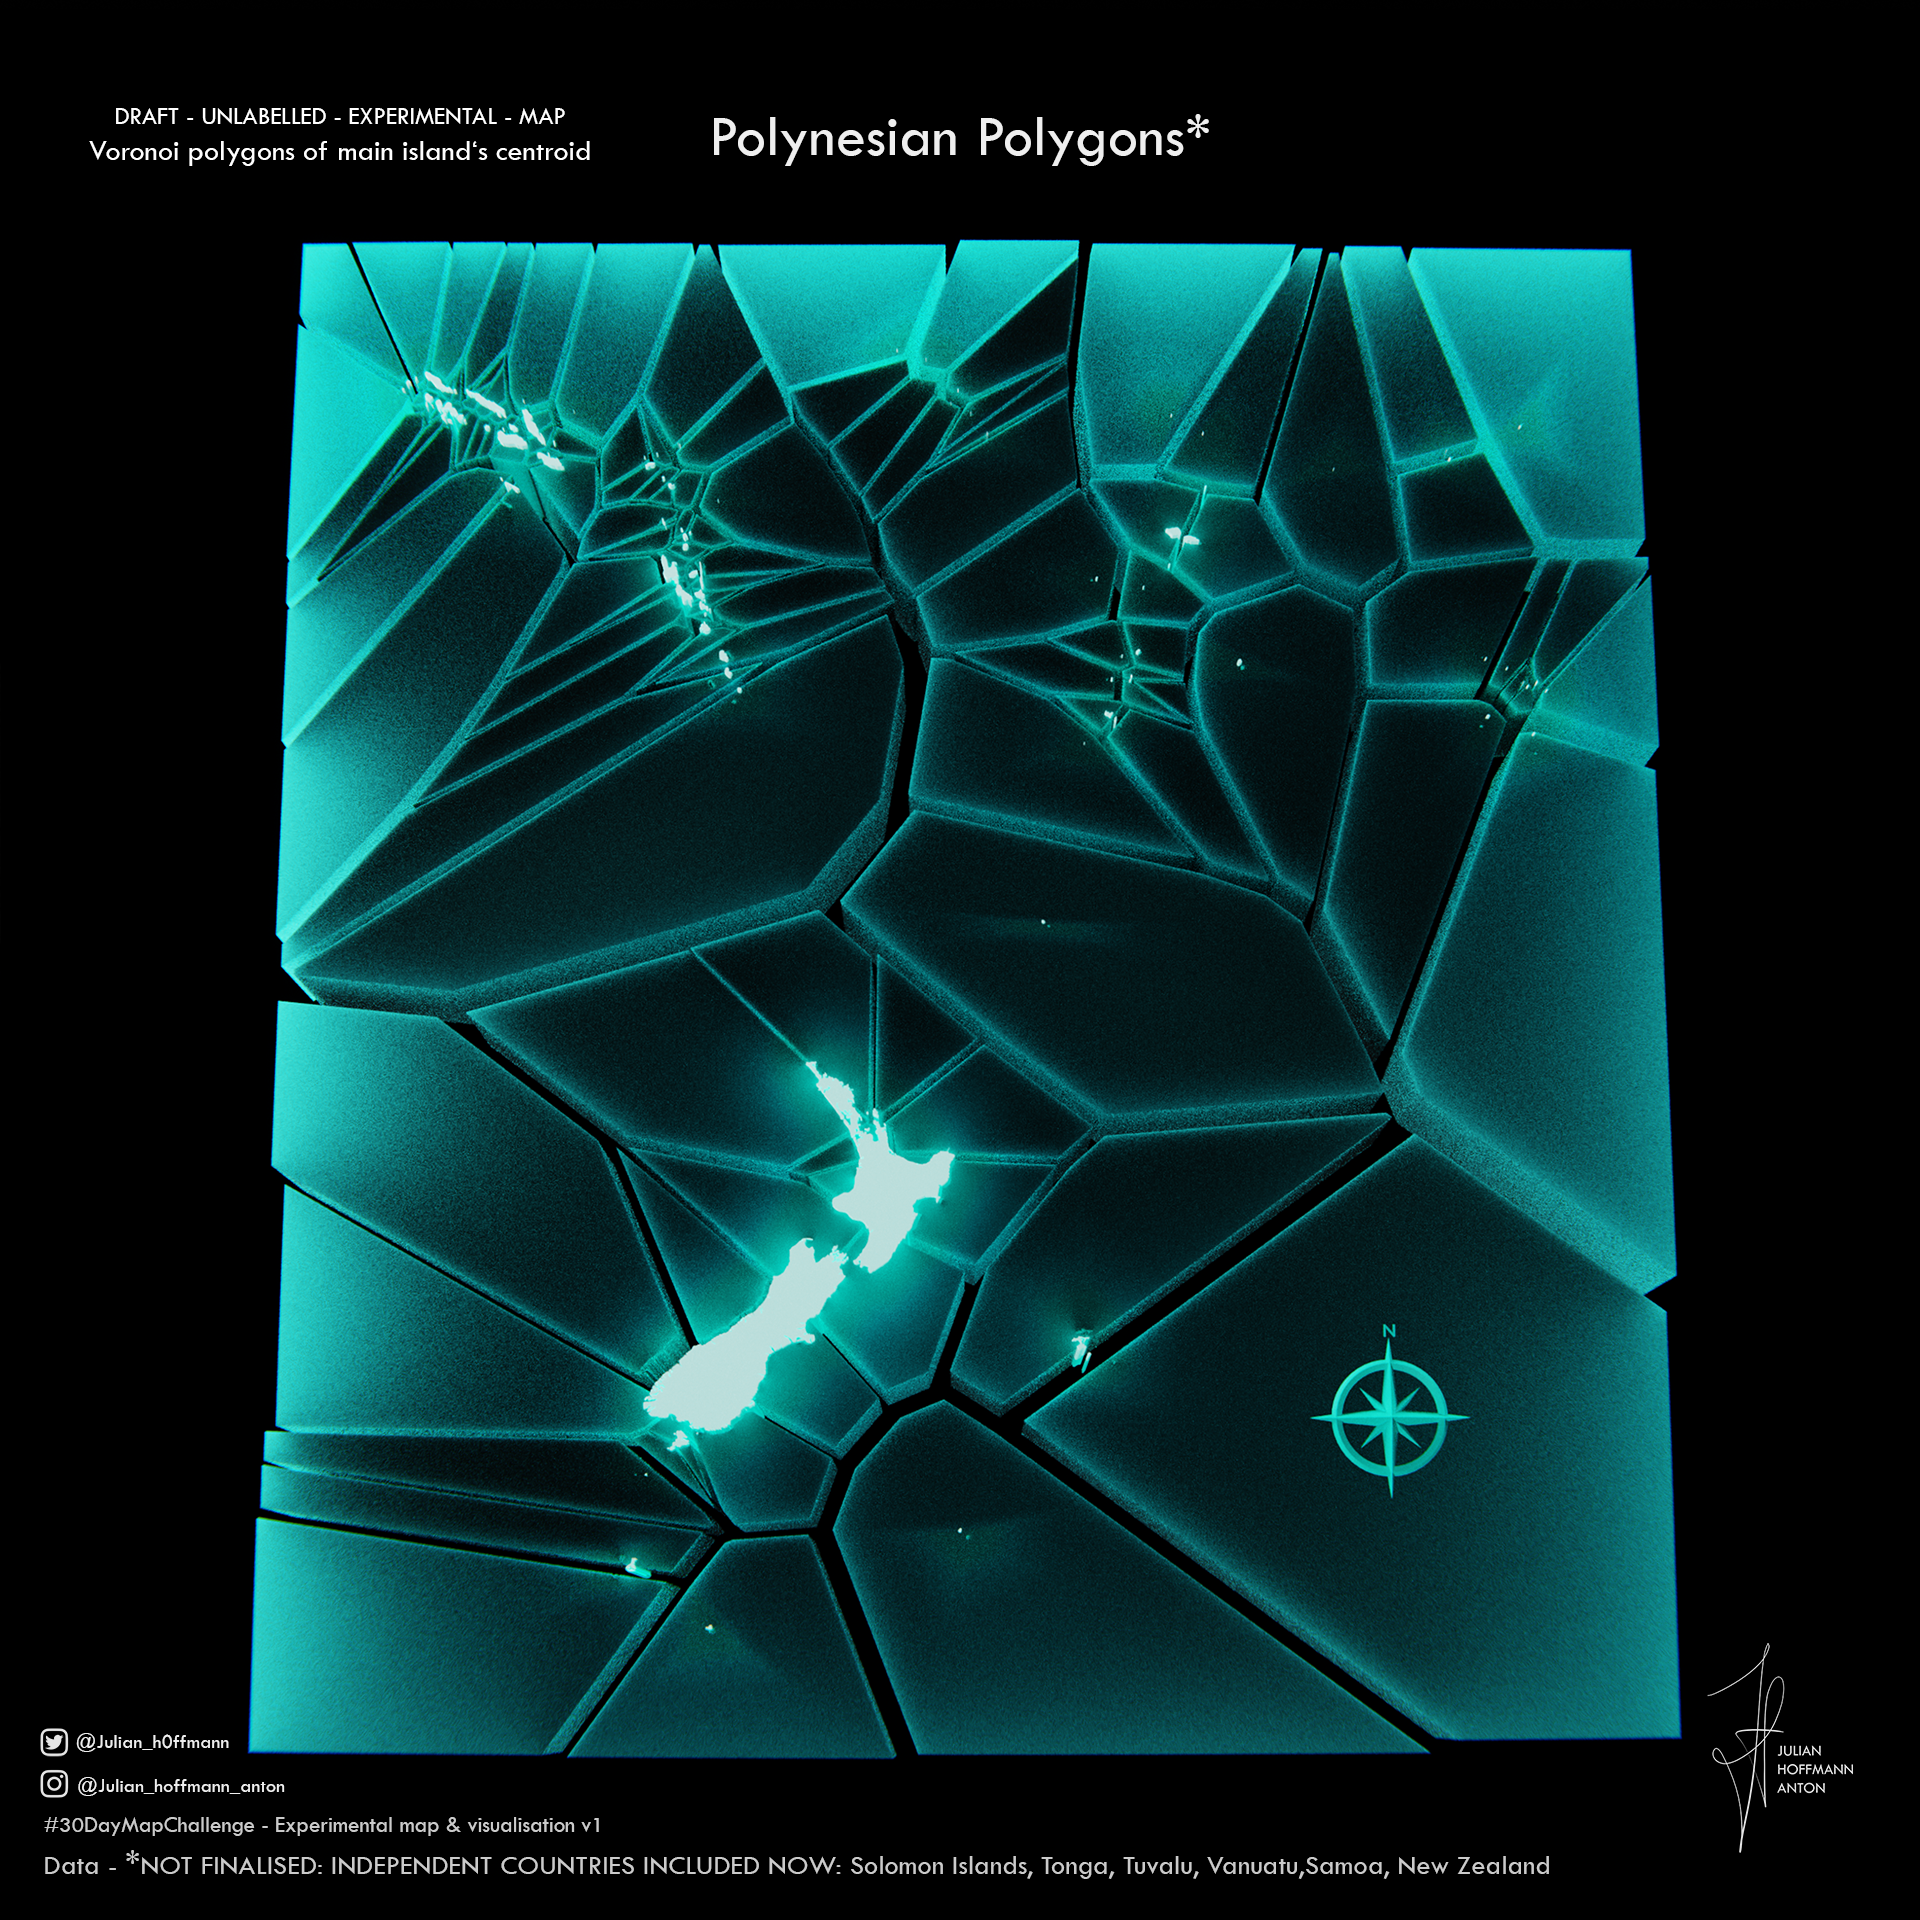
Polynesian Polygons

London in 3D LiDAR


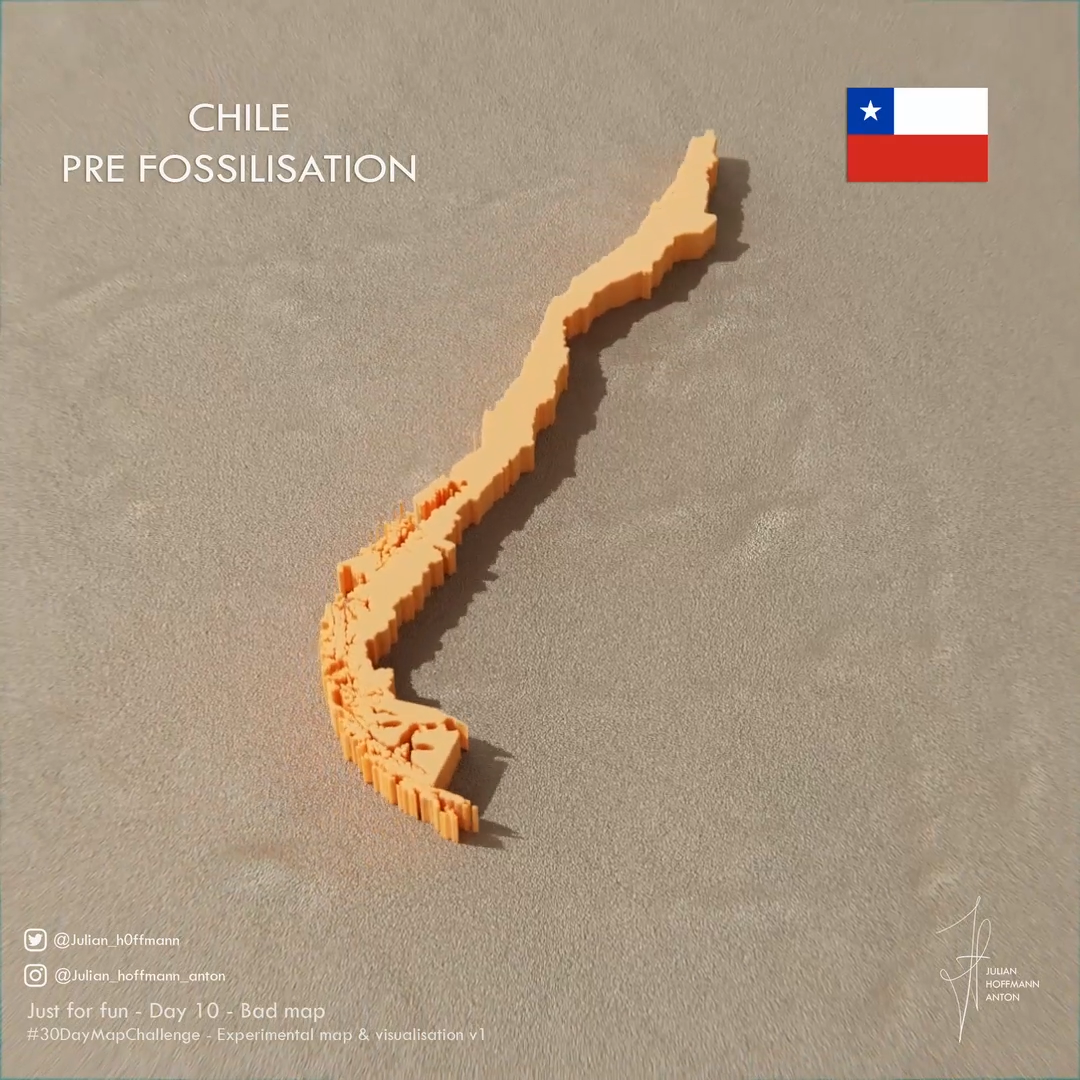
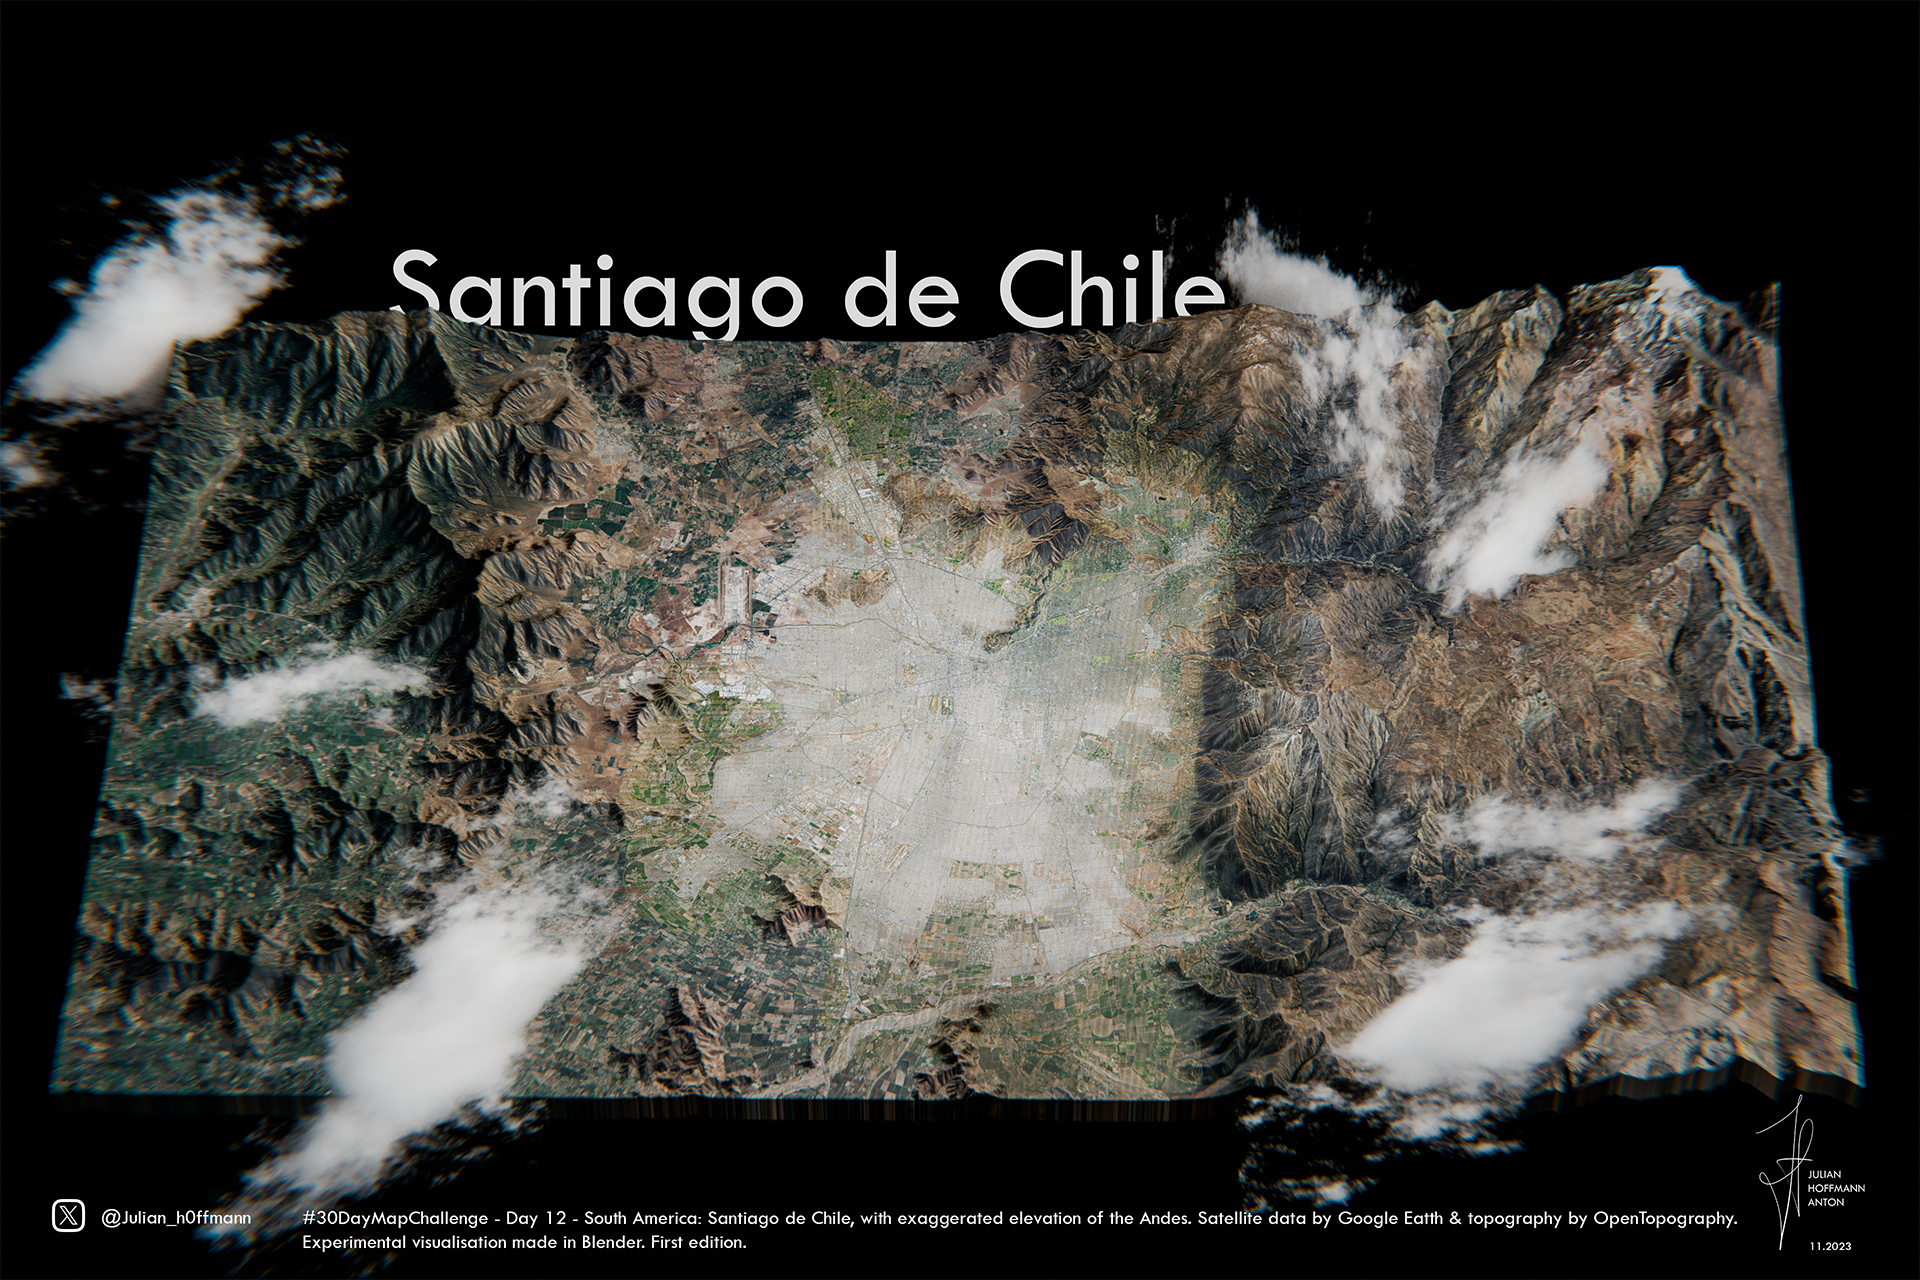
Chile Pre Fossilisation
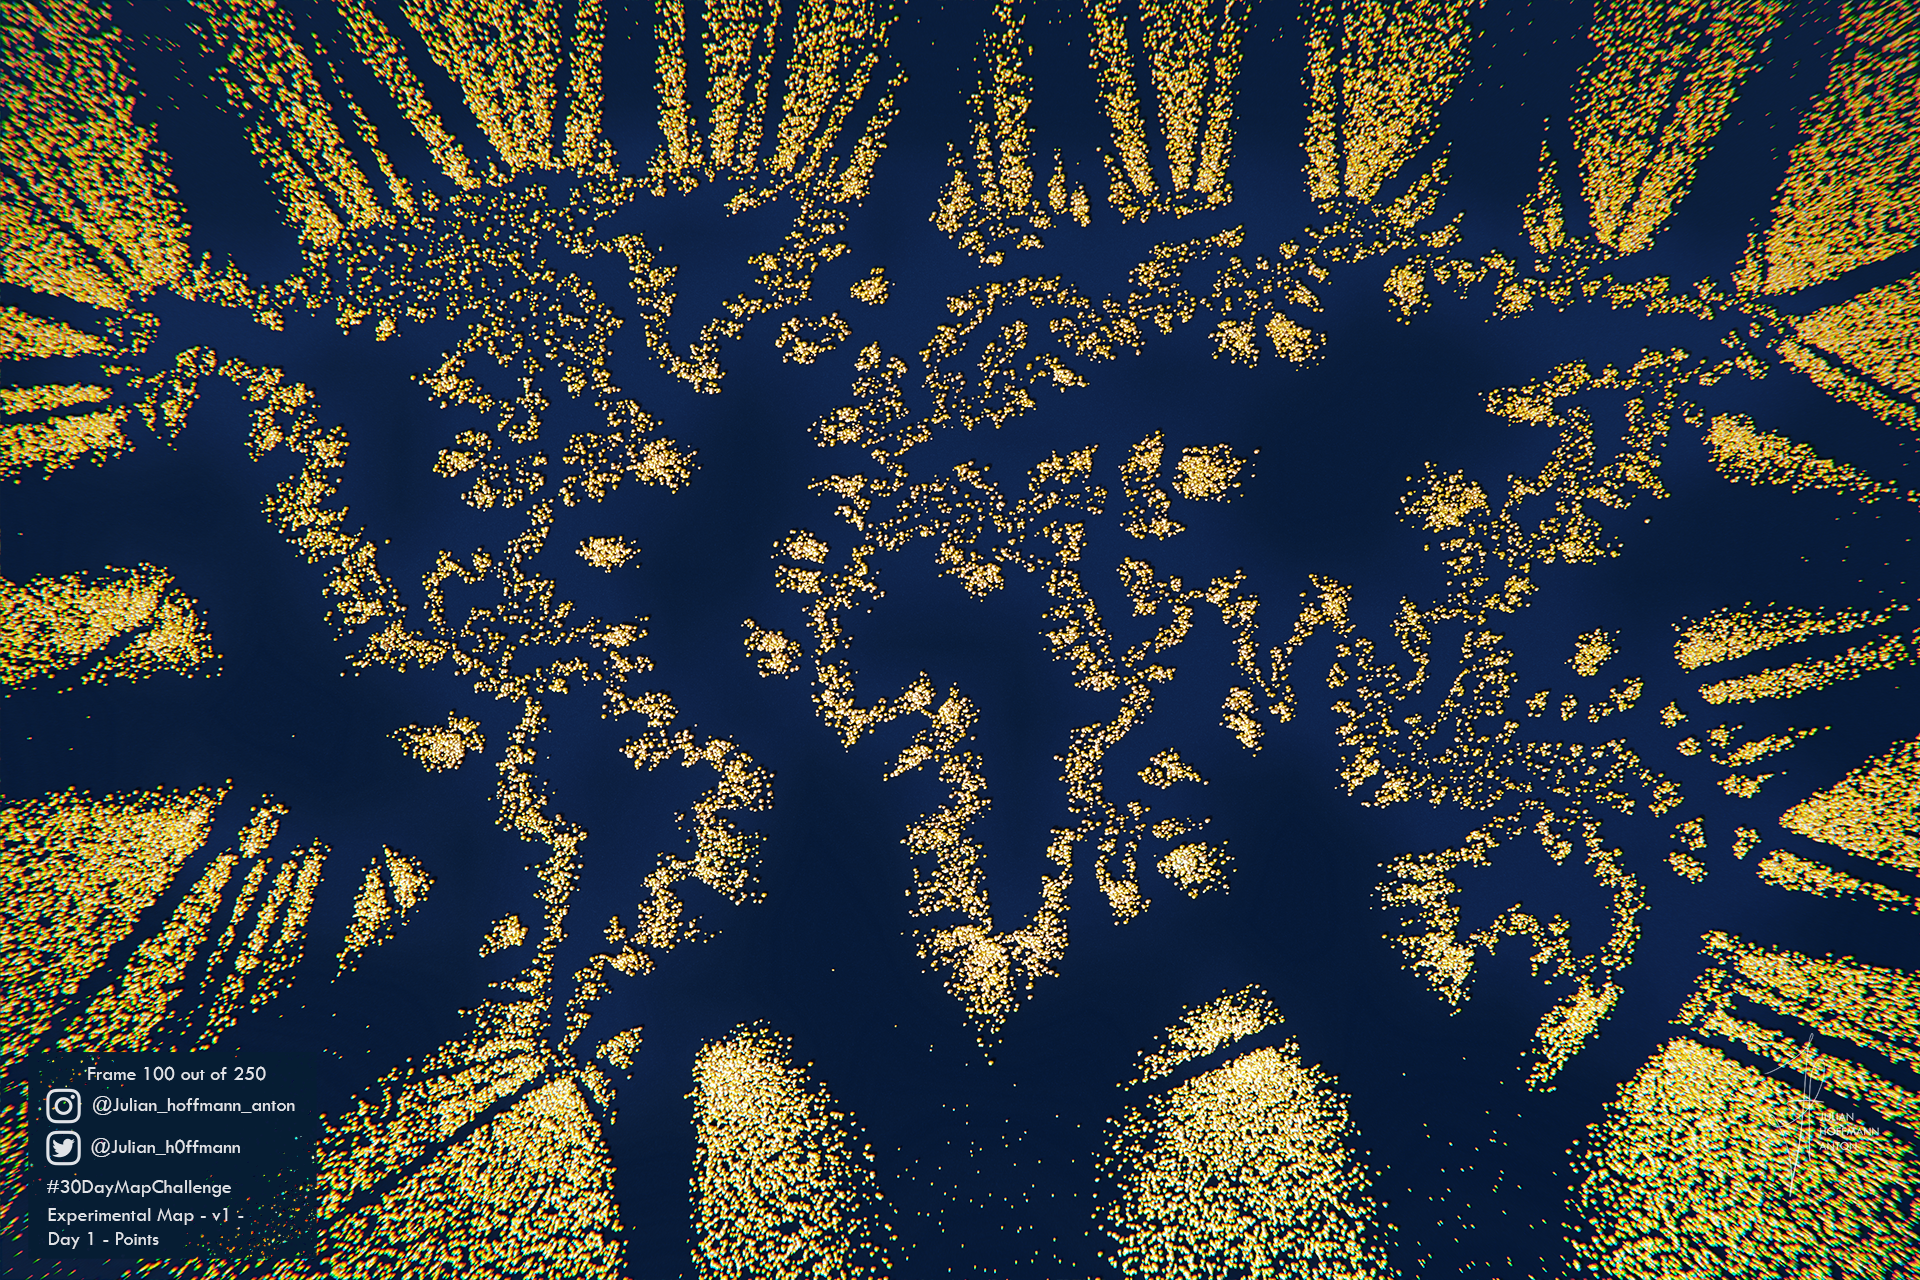
From points to map

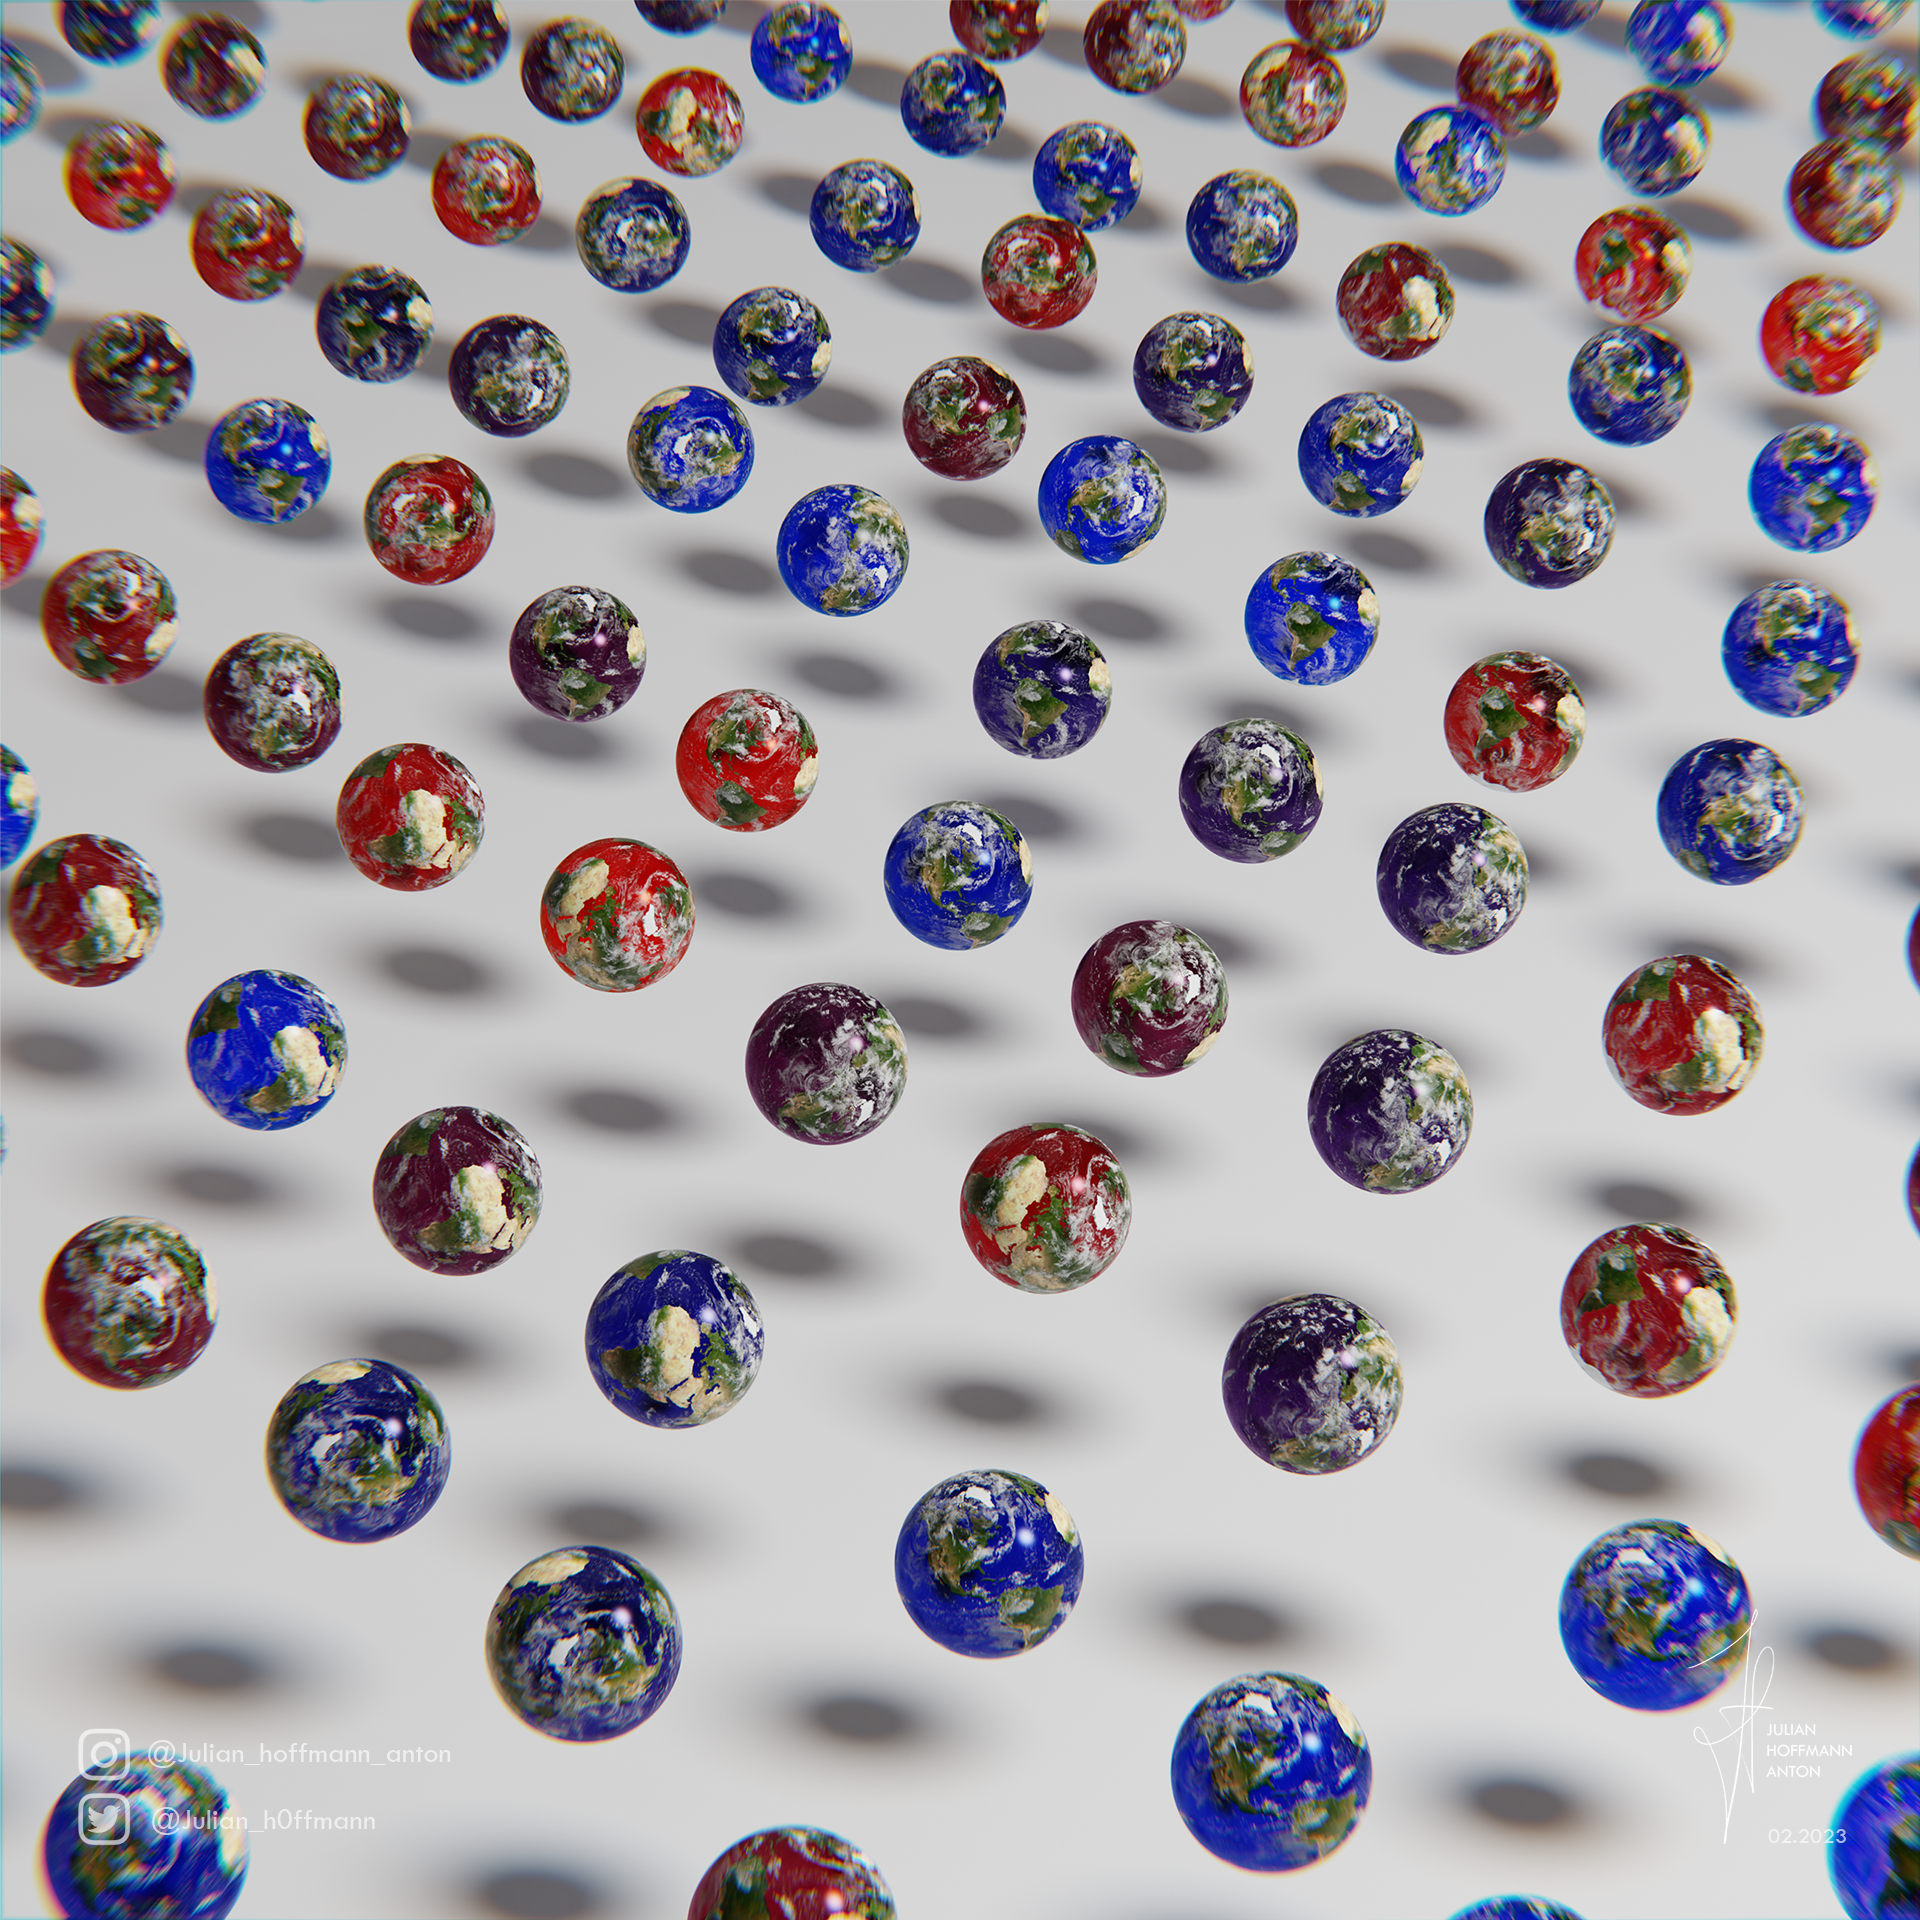
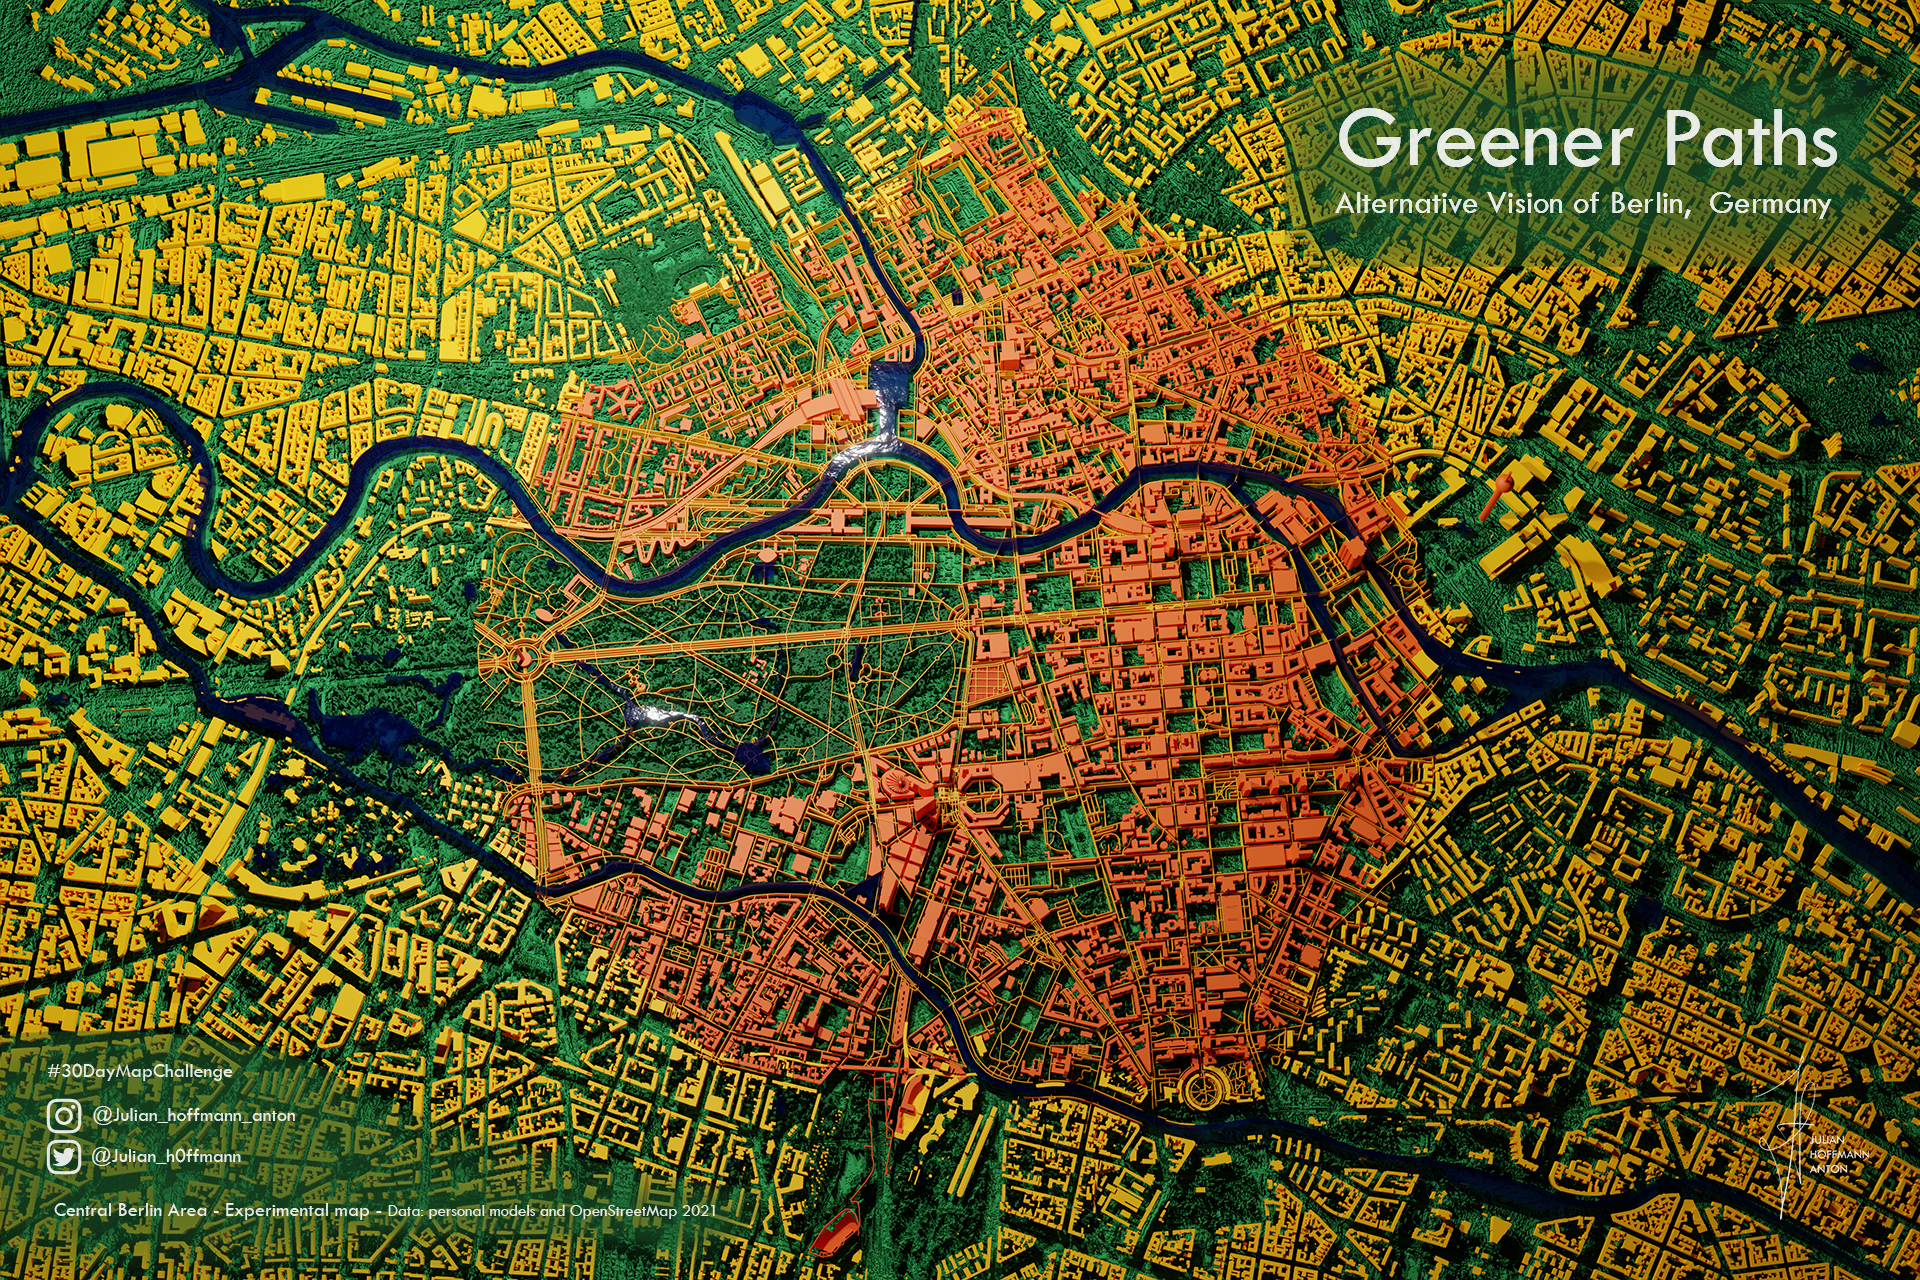
Testing Greener Worlds
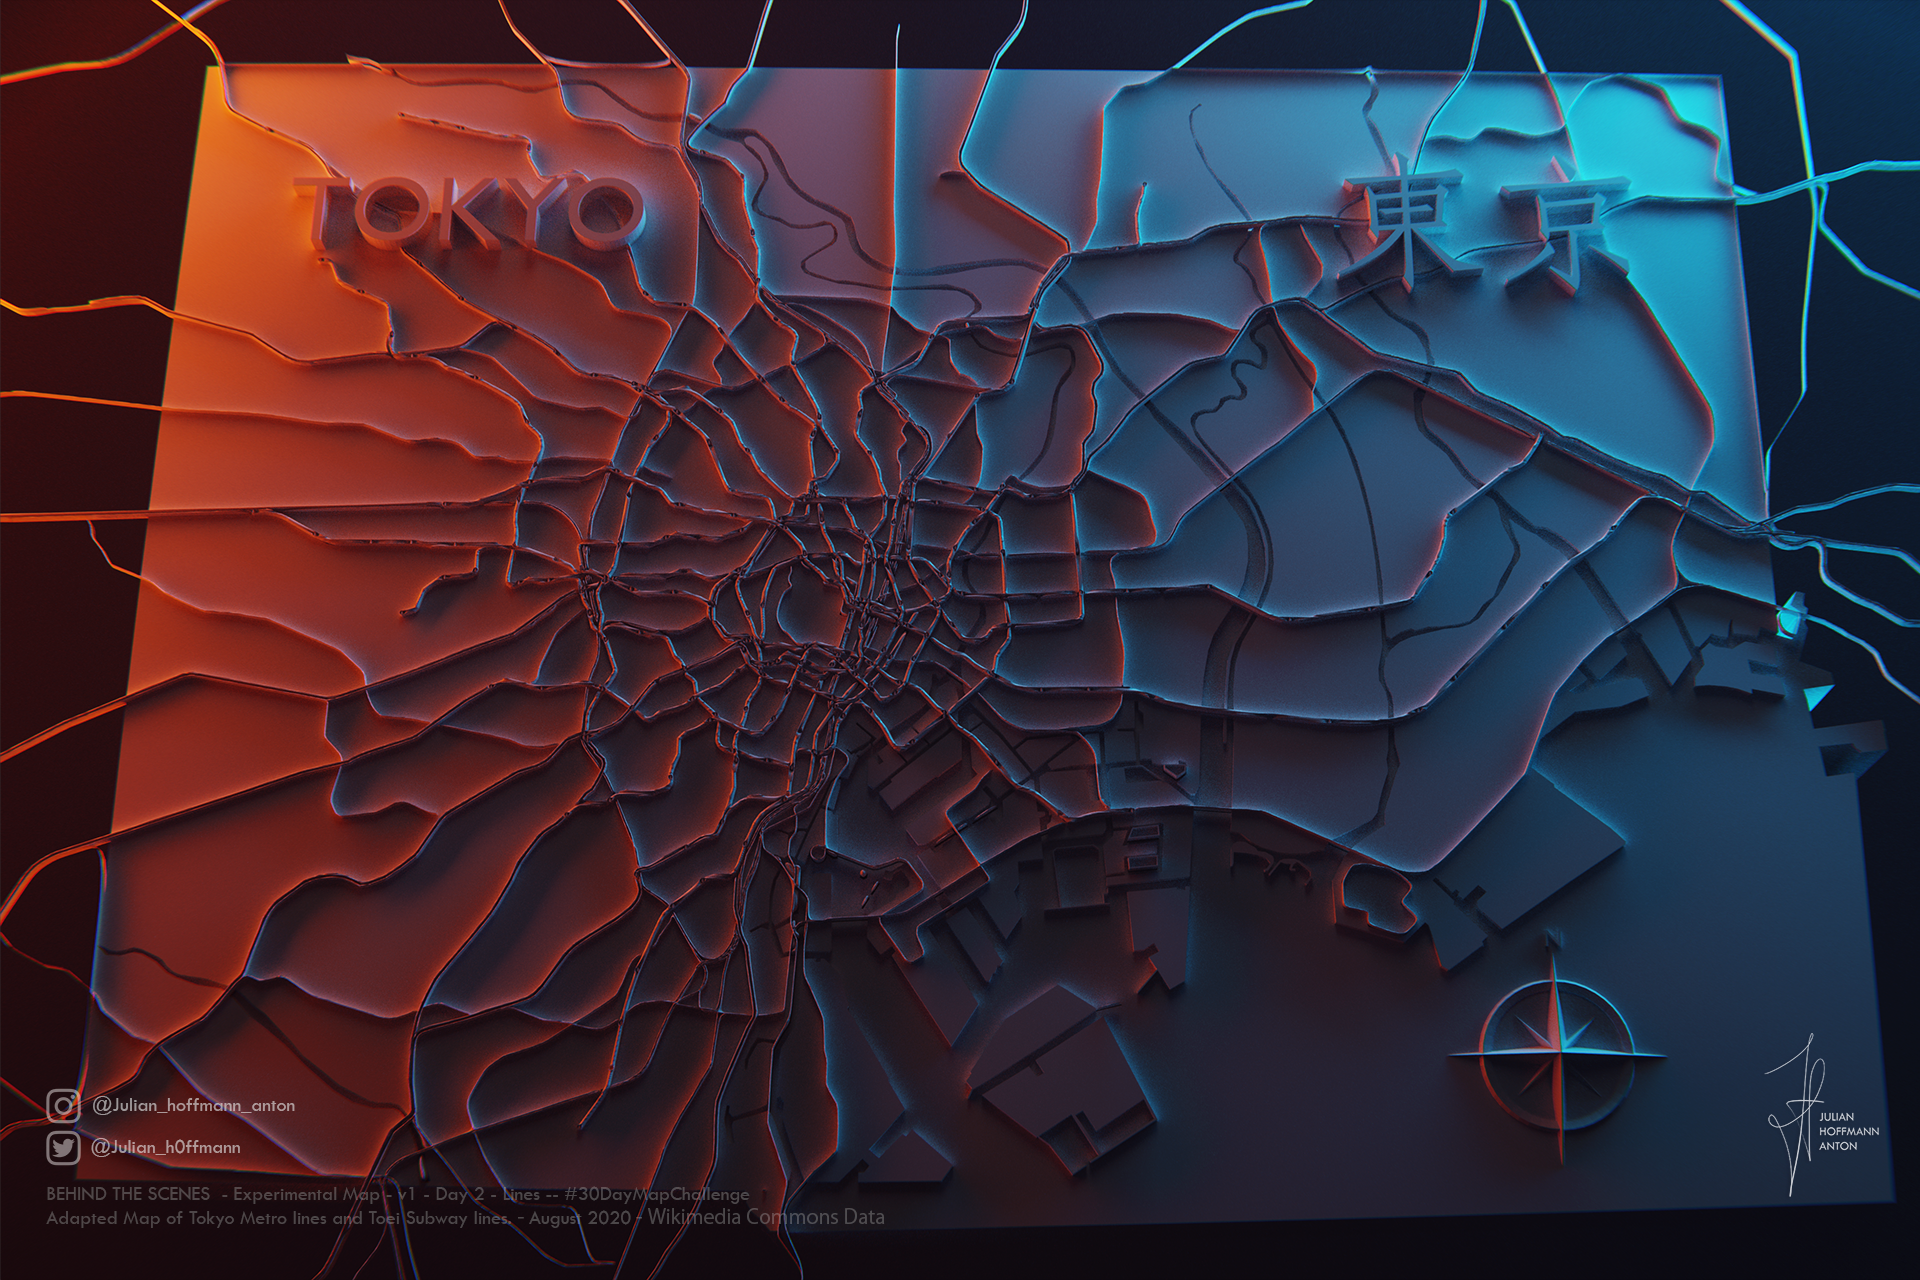
Tokyo Lines (BTS)
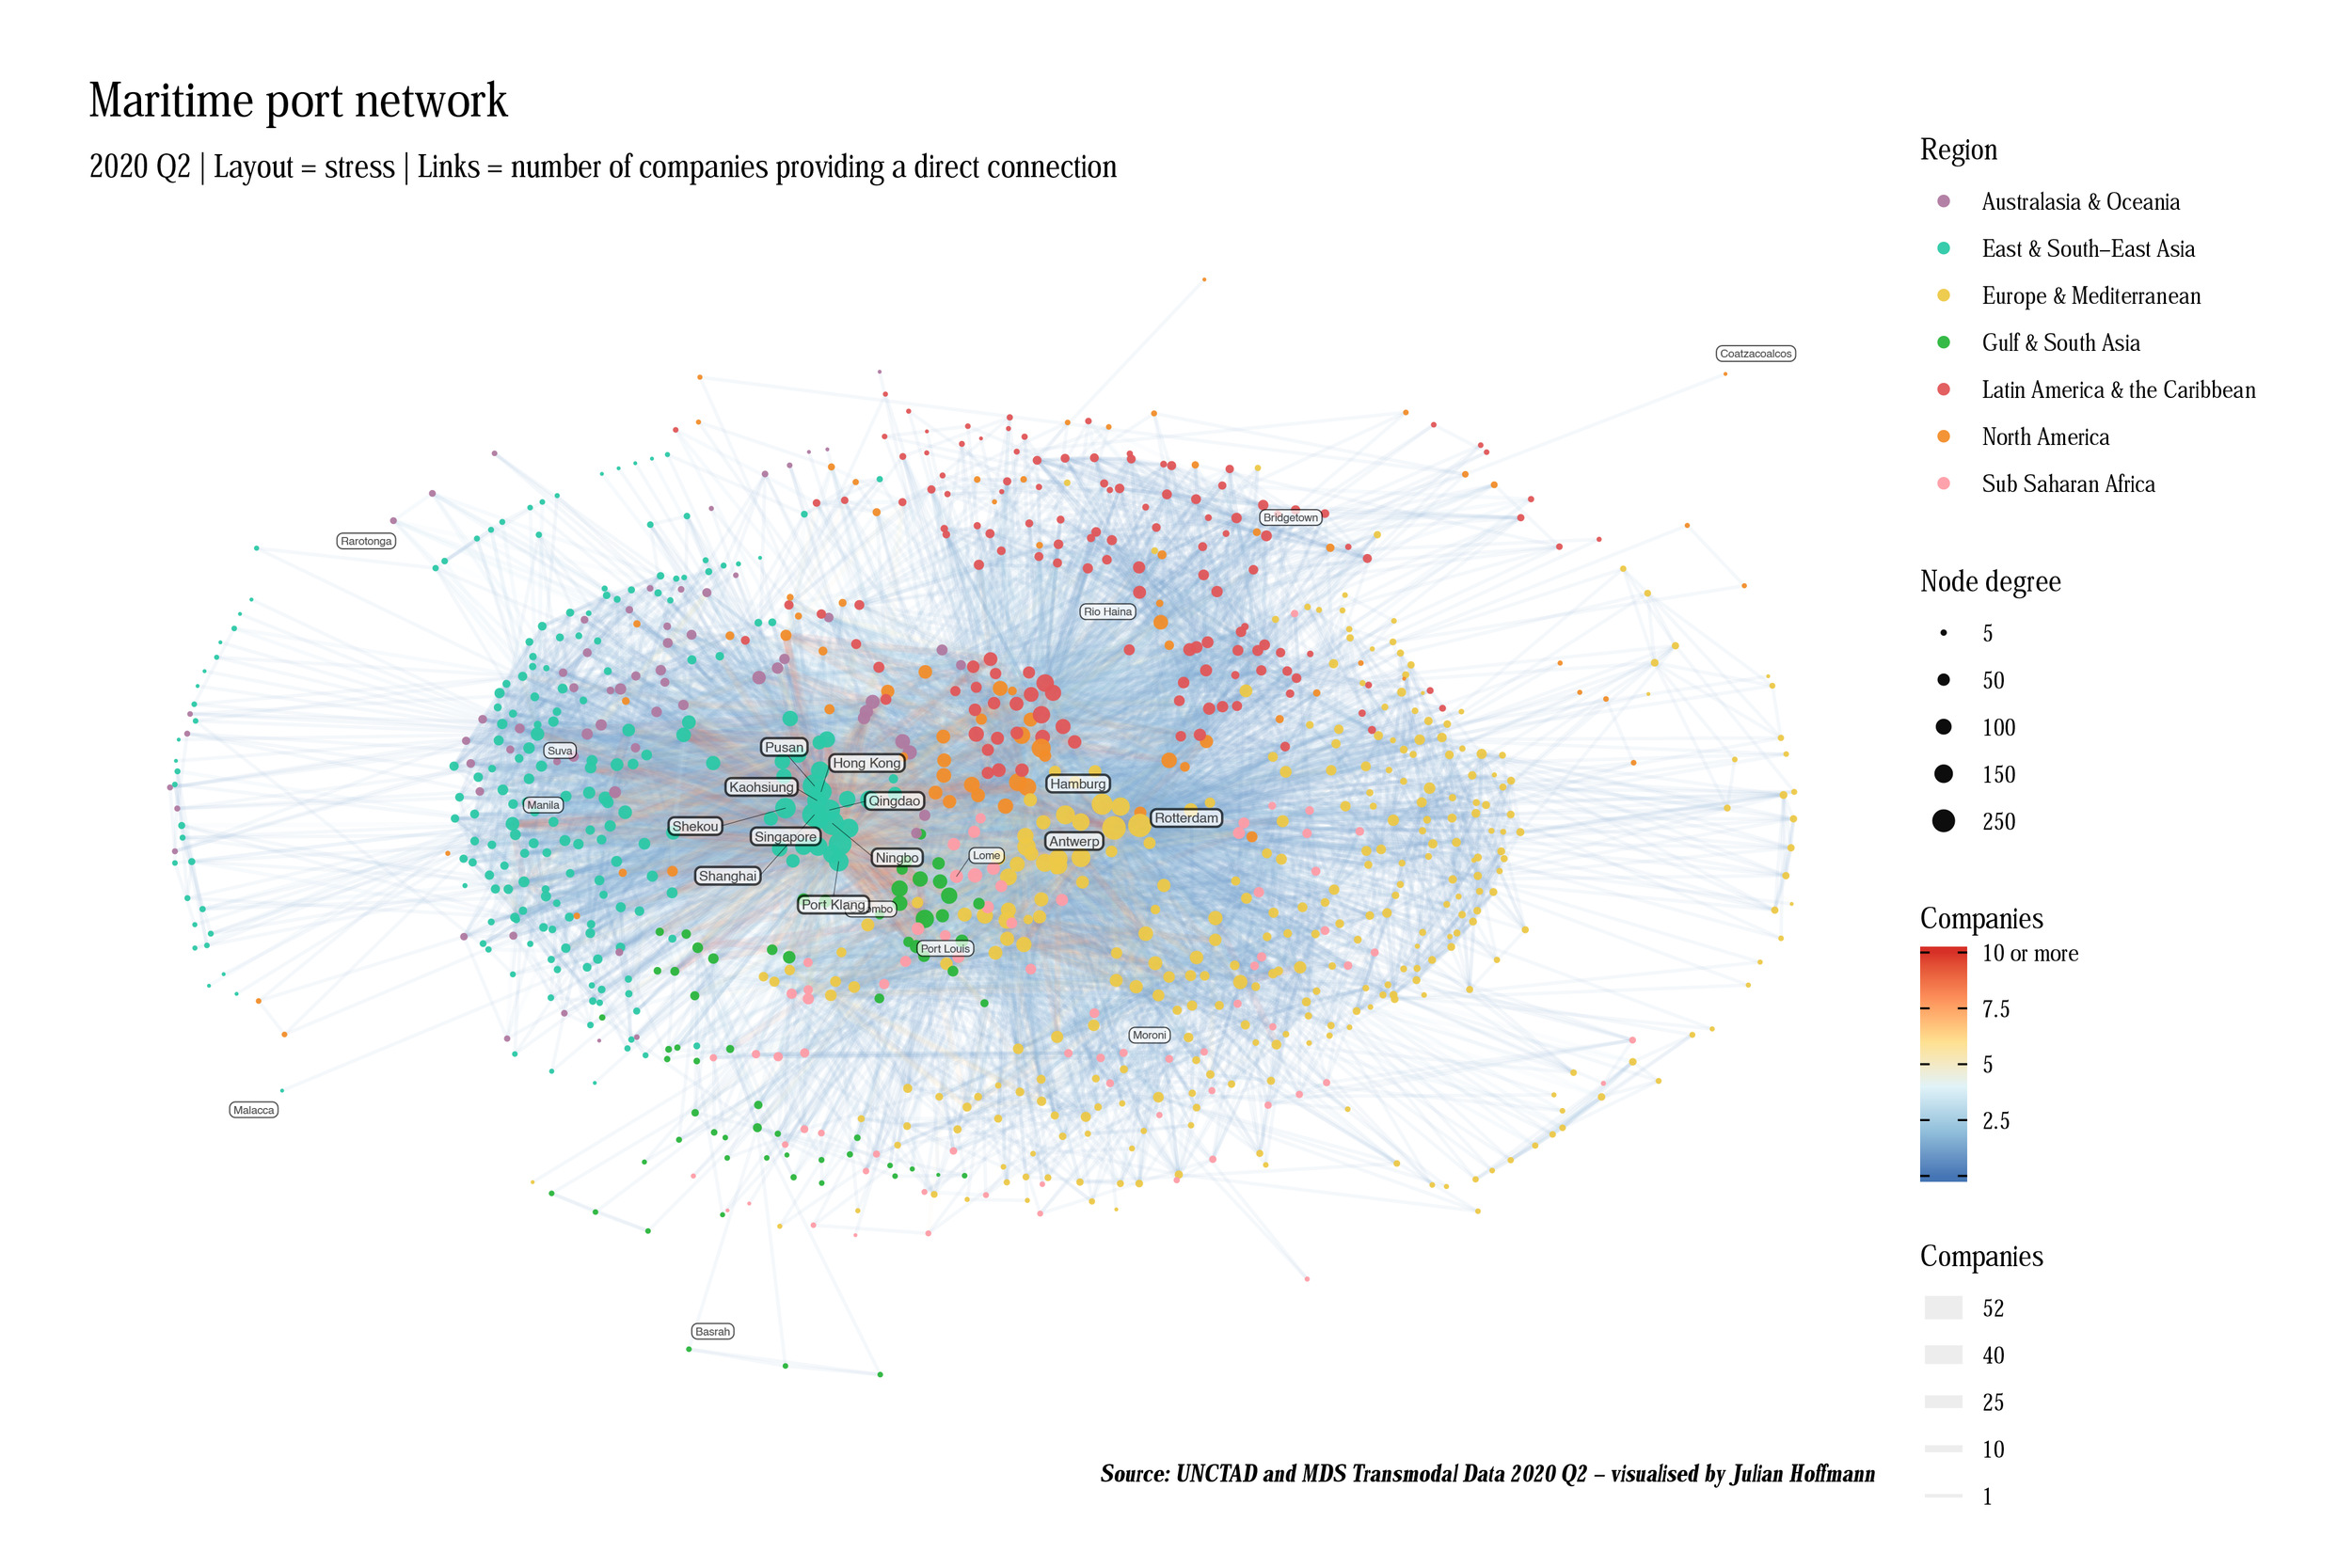
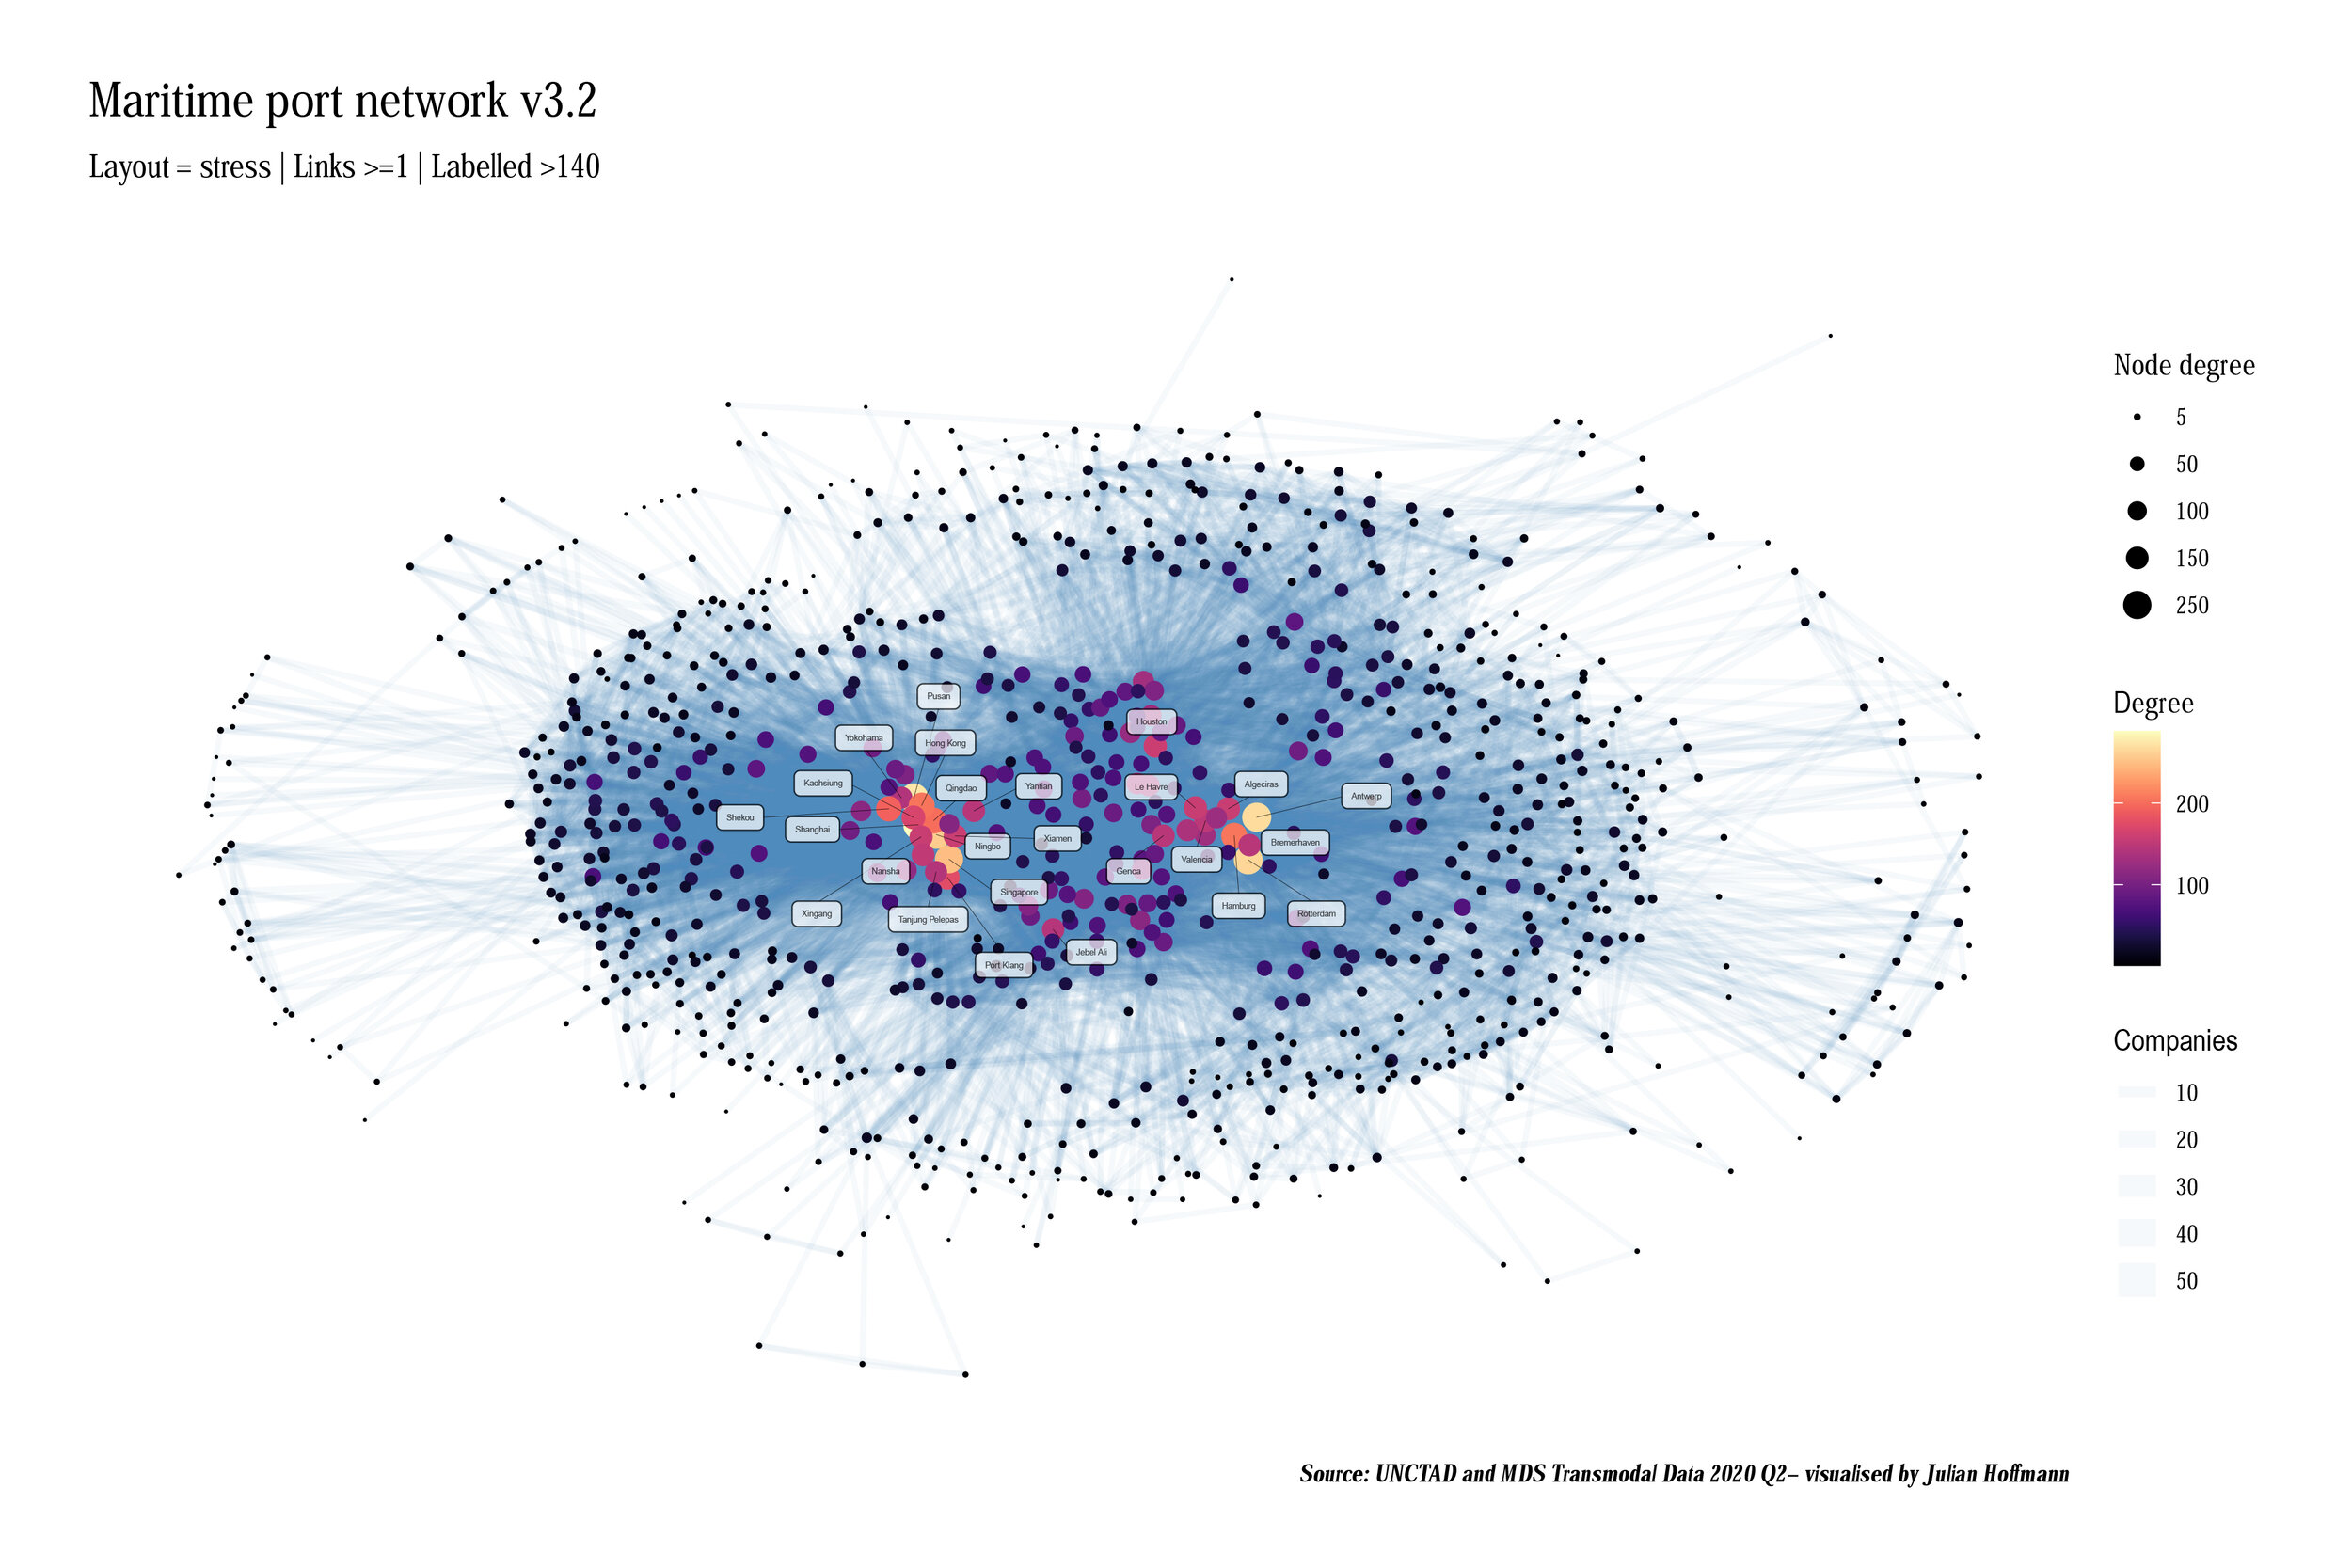
Ports in the global liner shipping network

Café à Paris
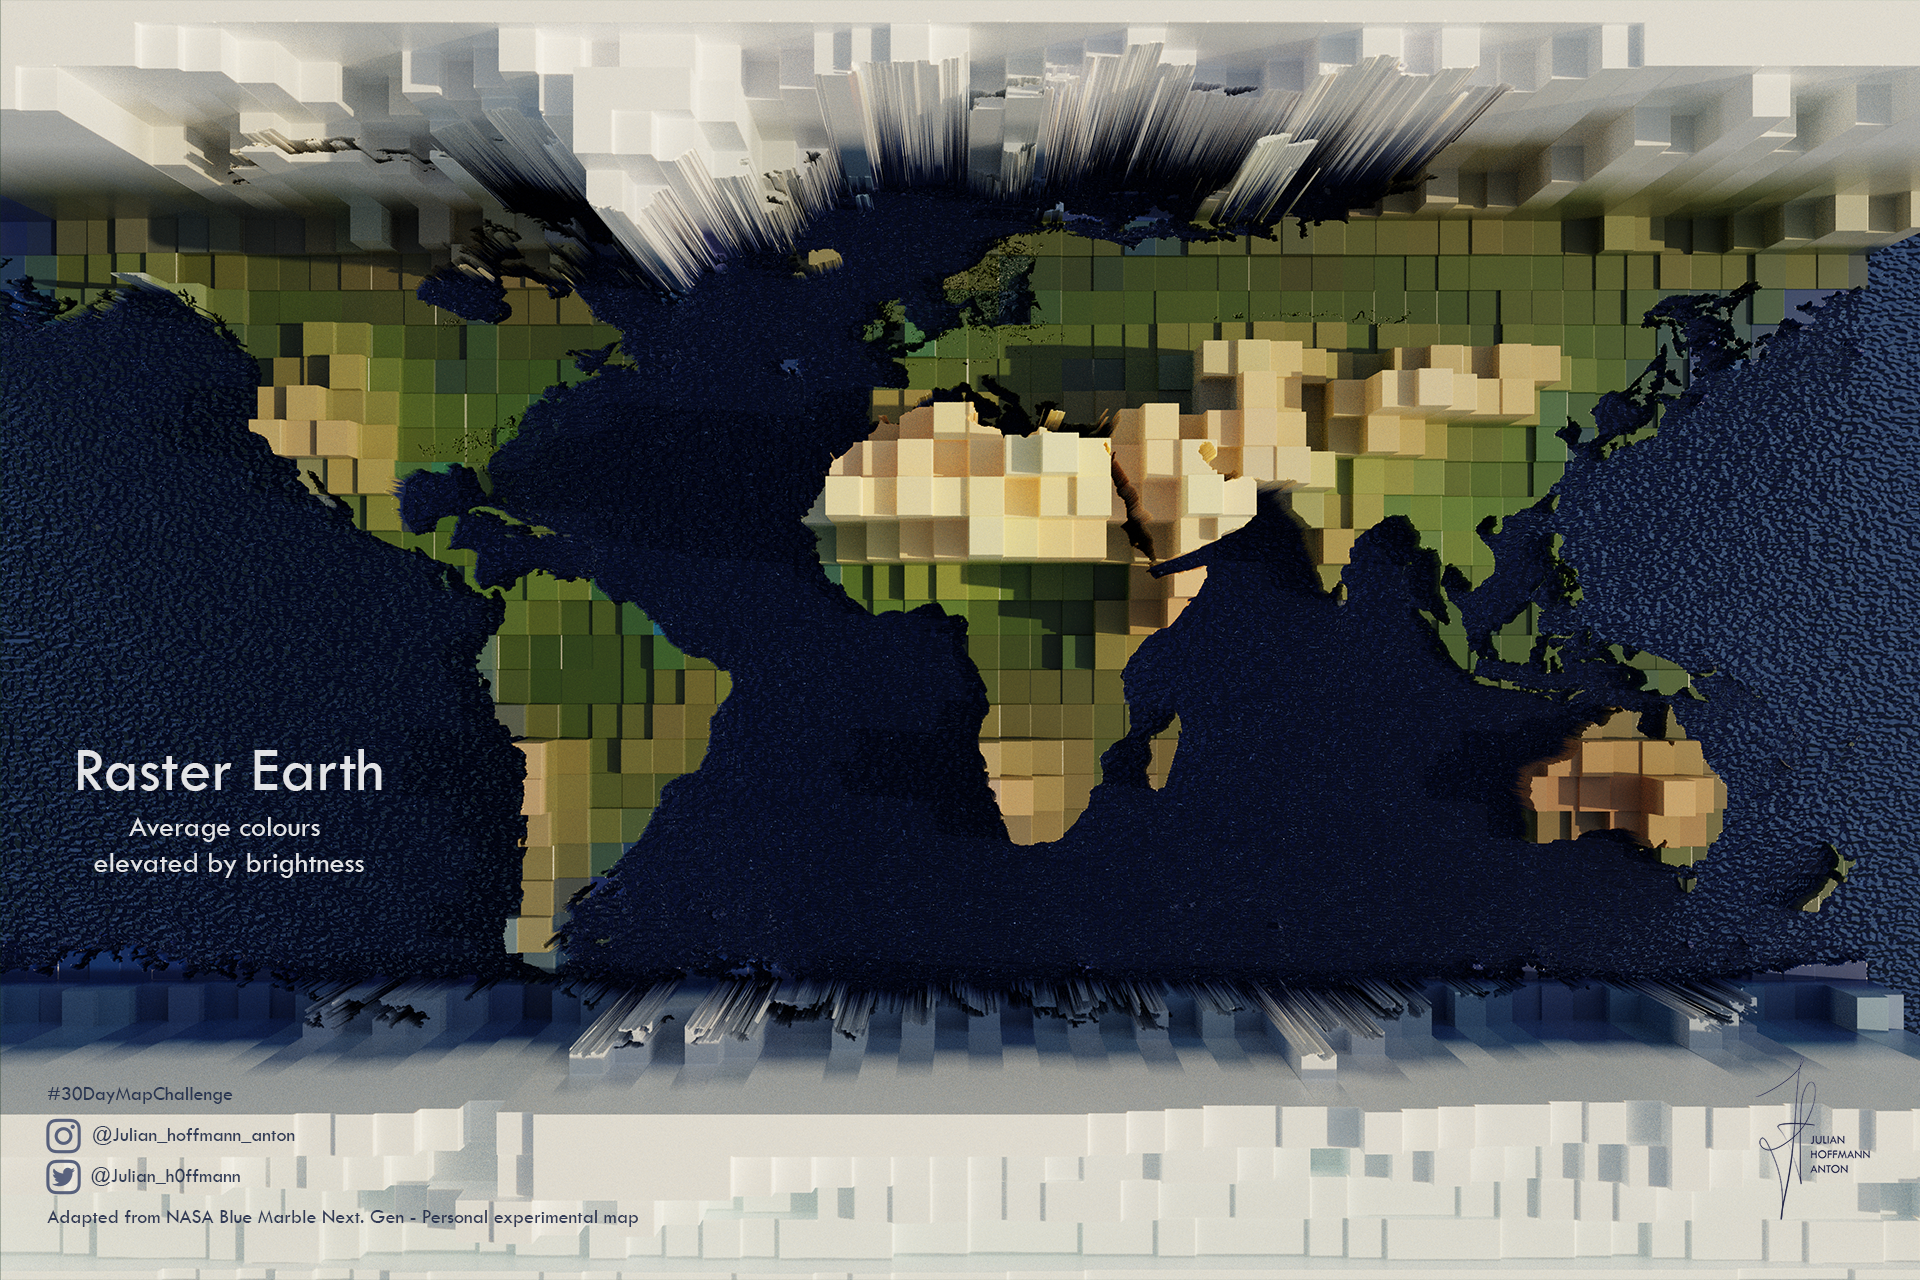
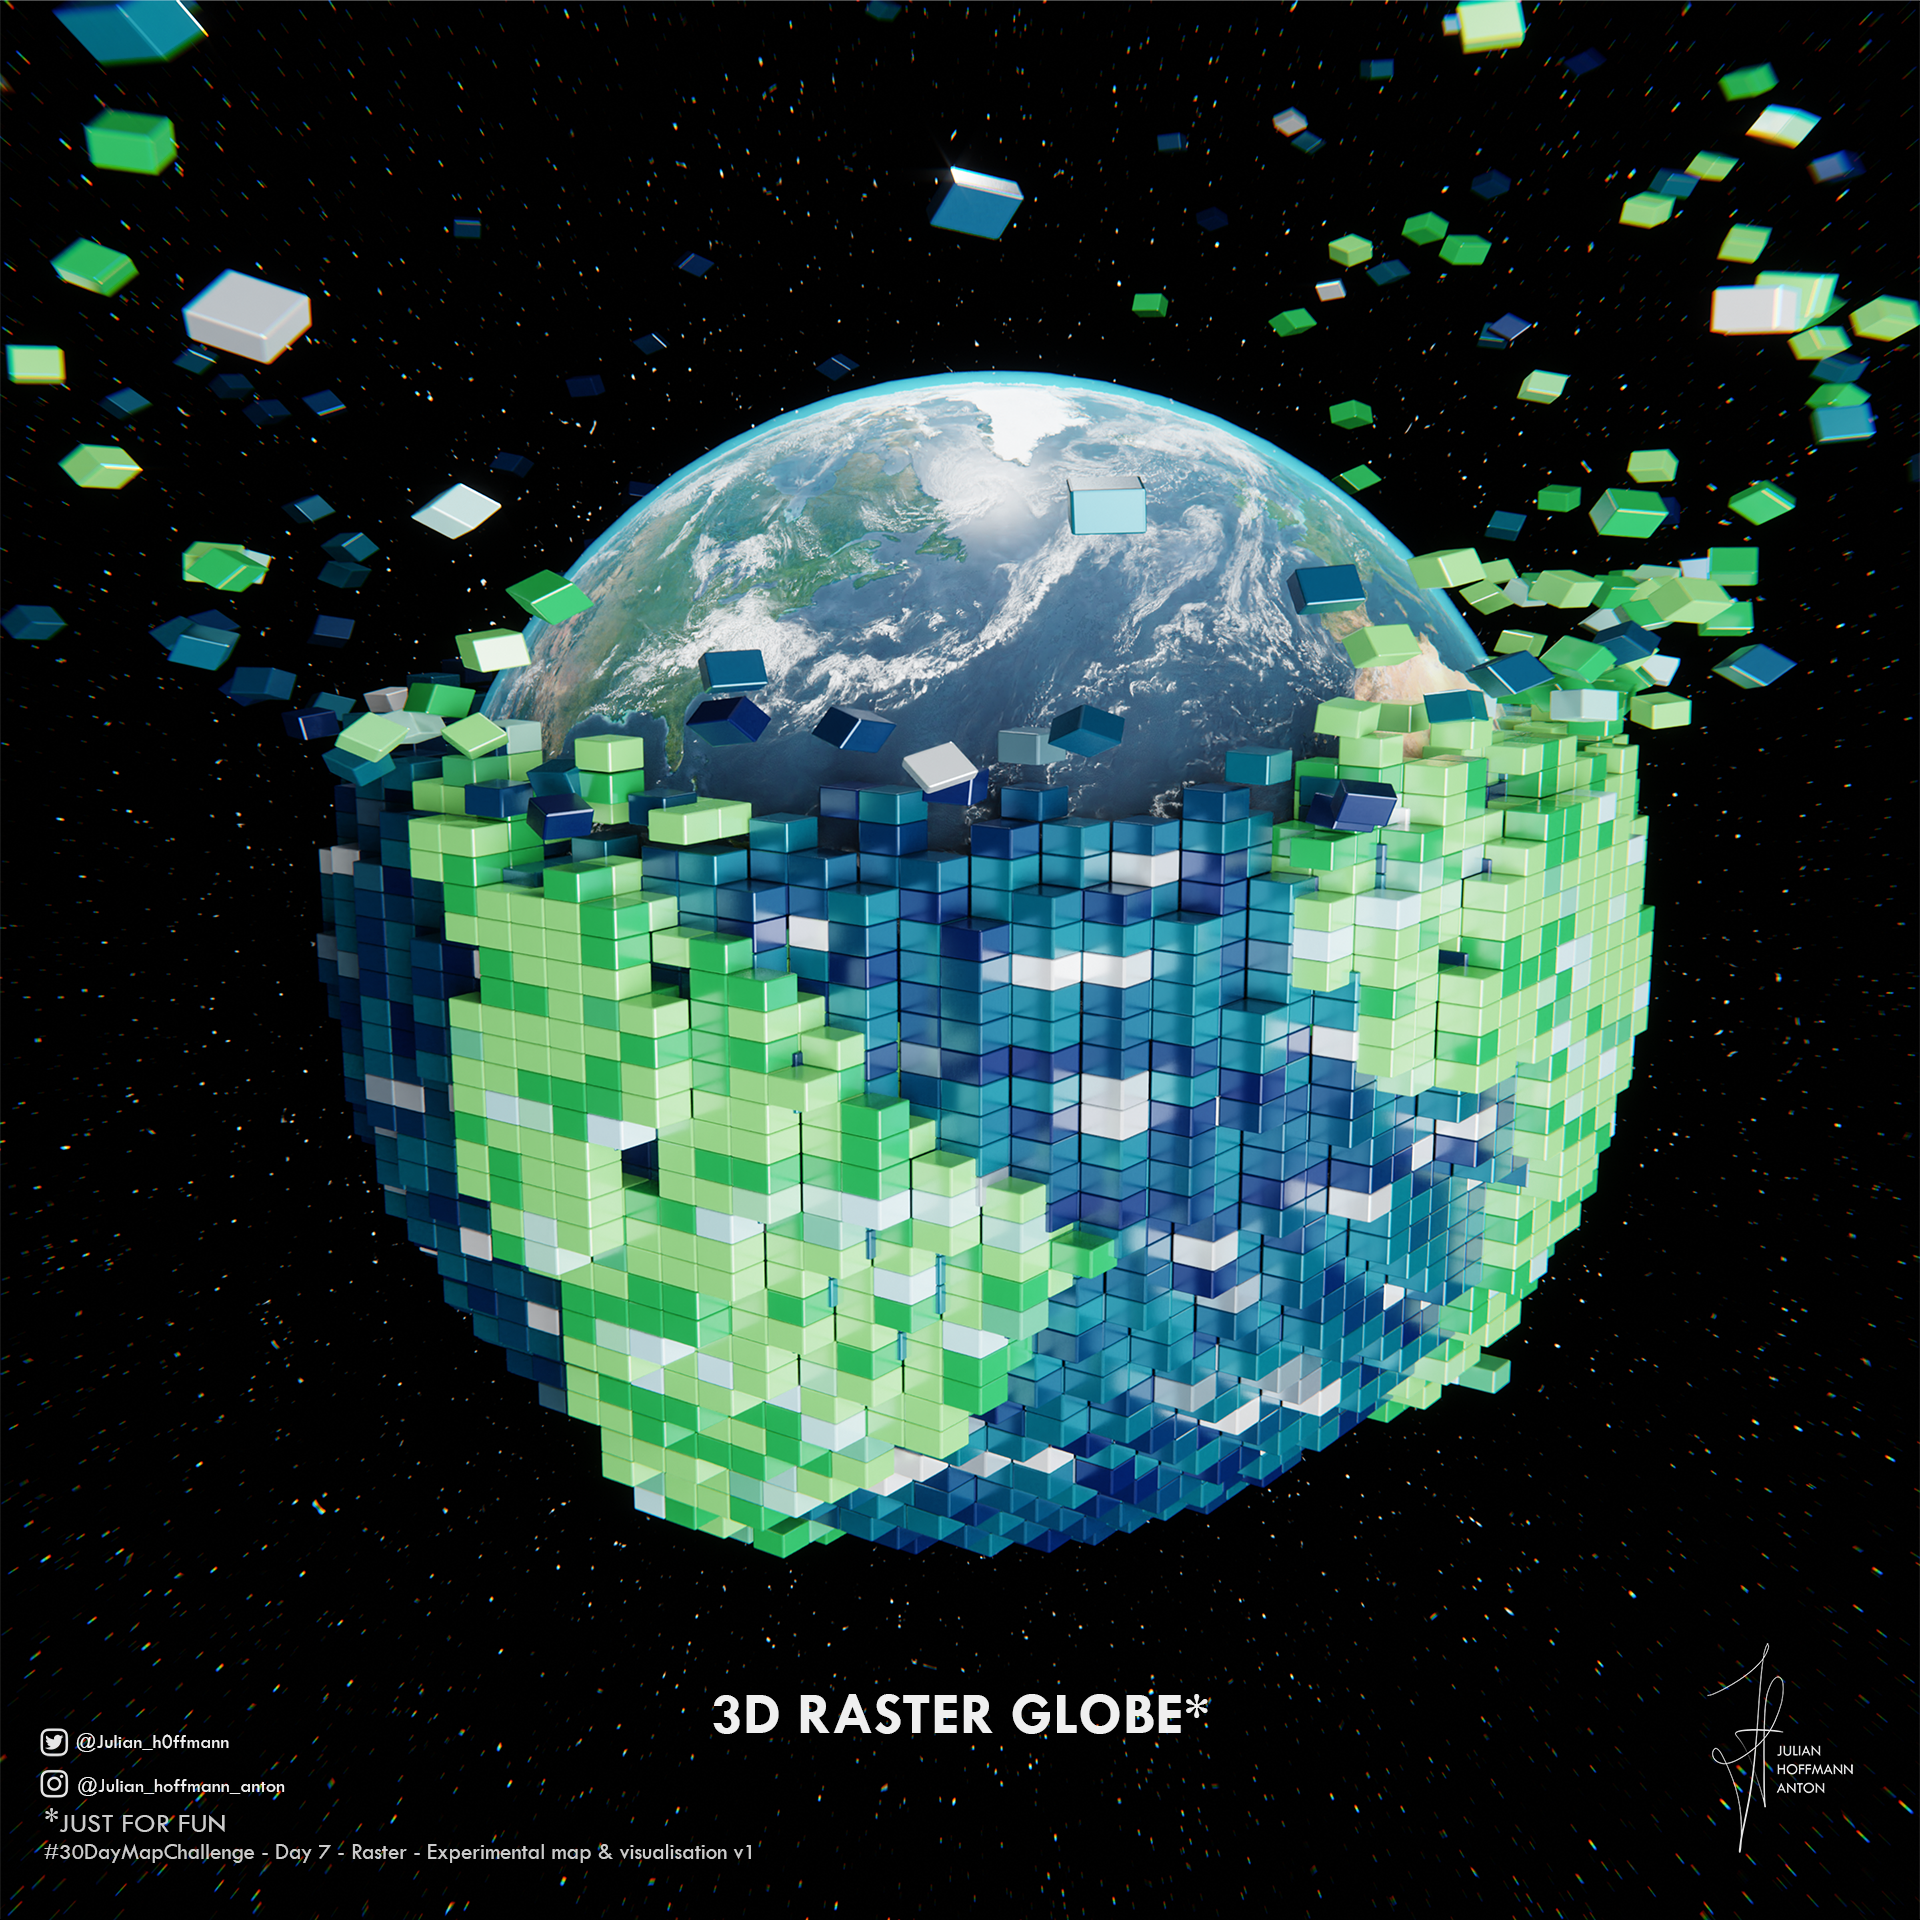
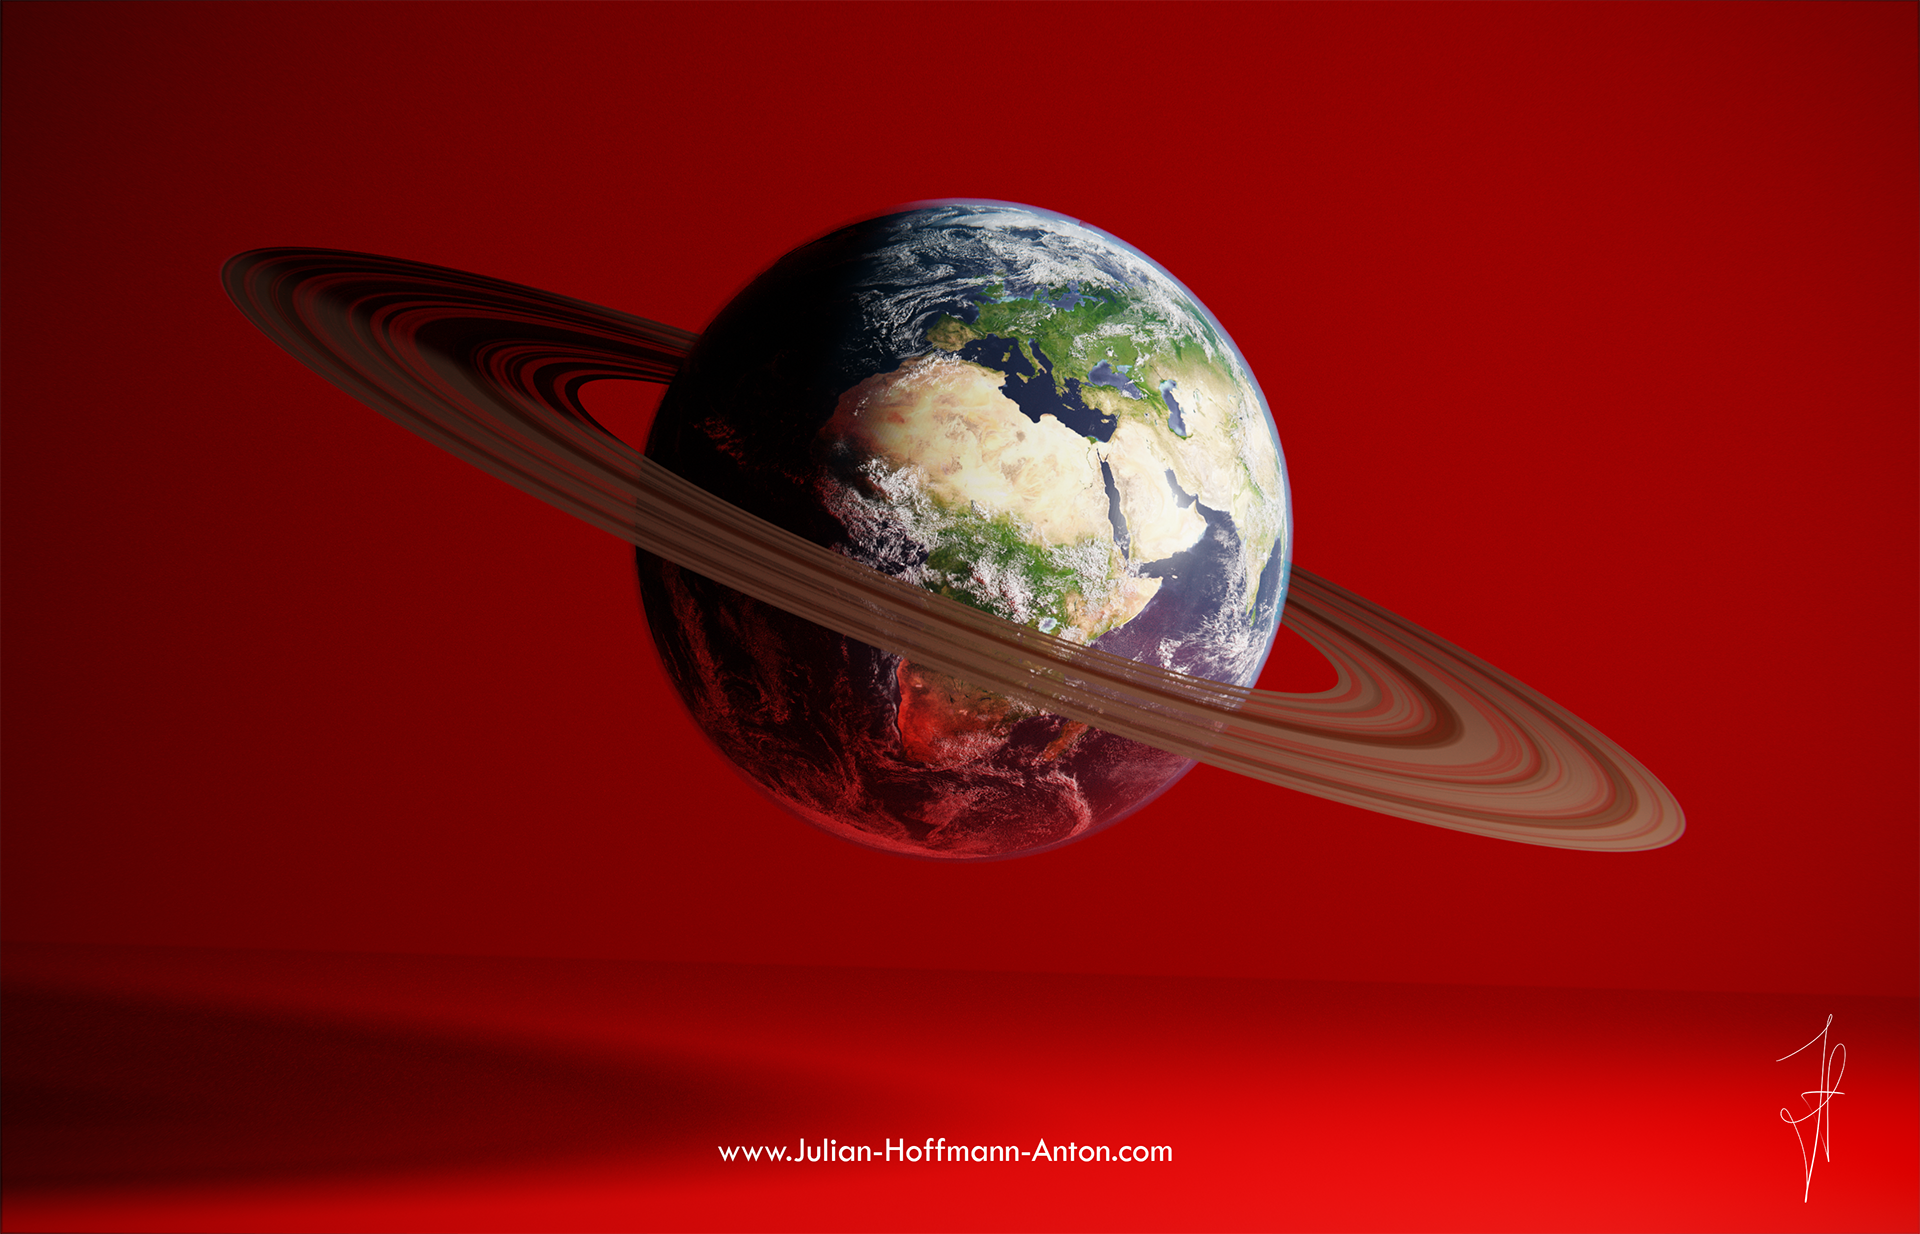
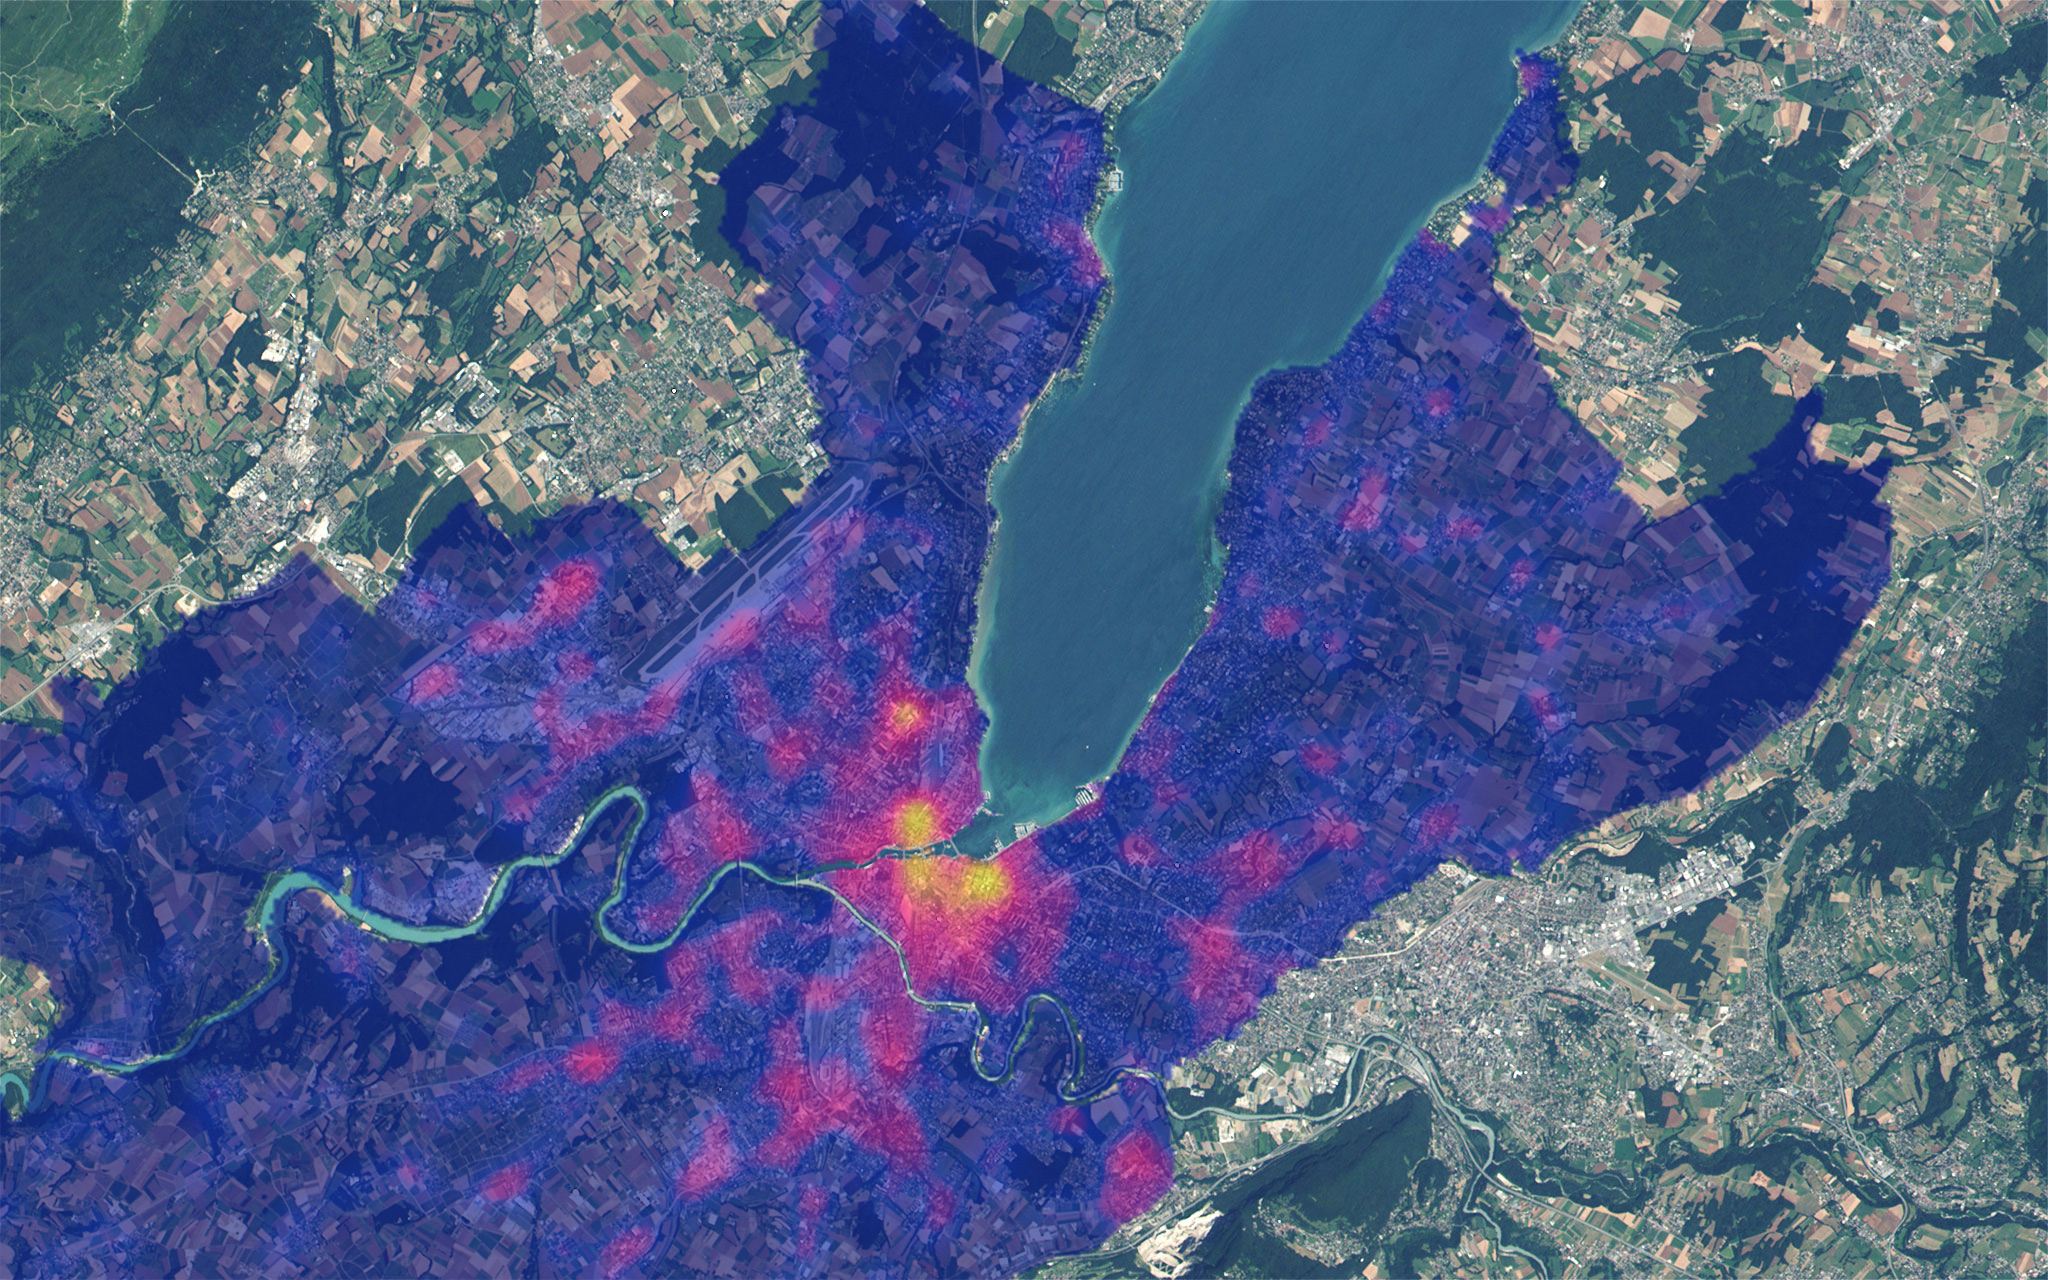
Raster Earth
Behind the Scenes
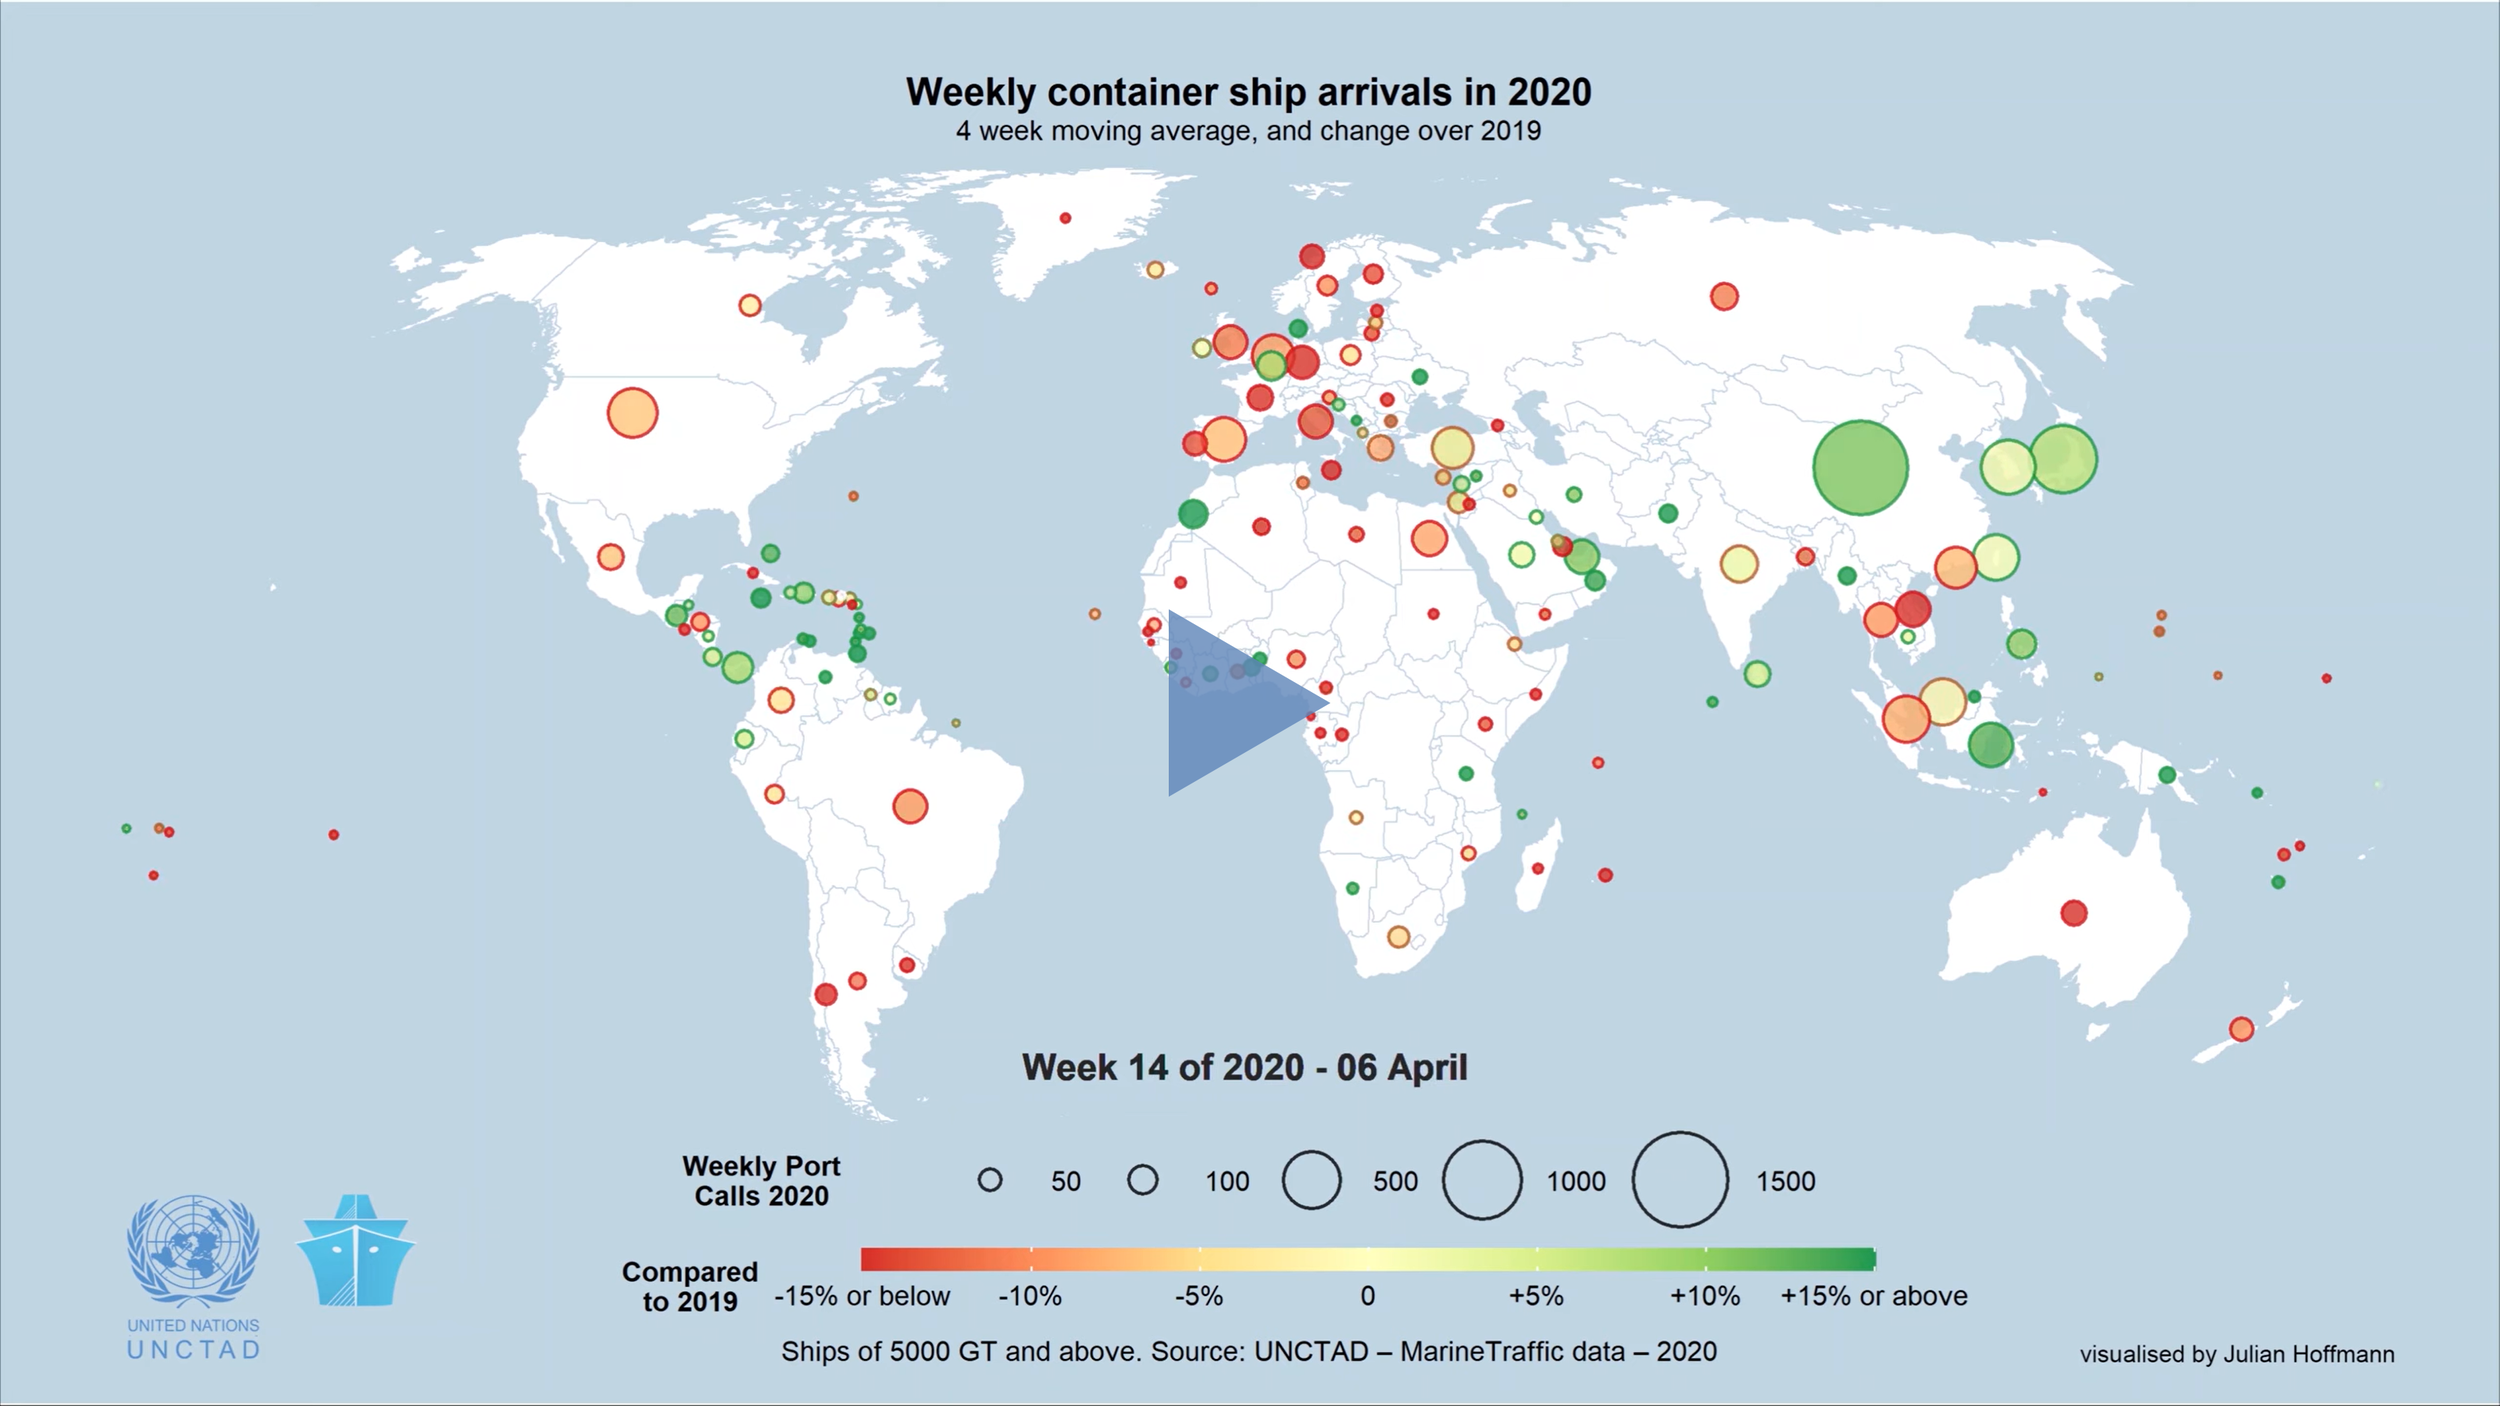
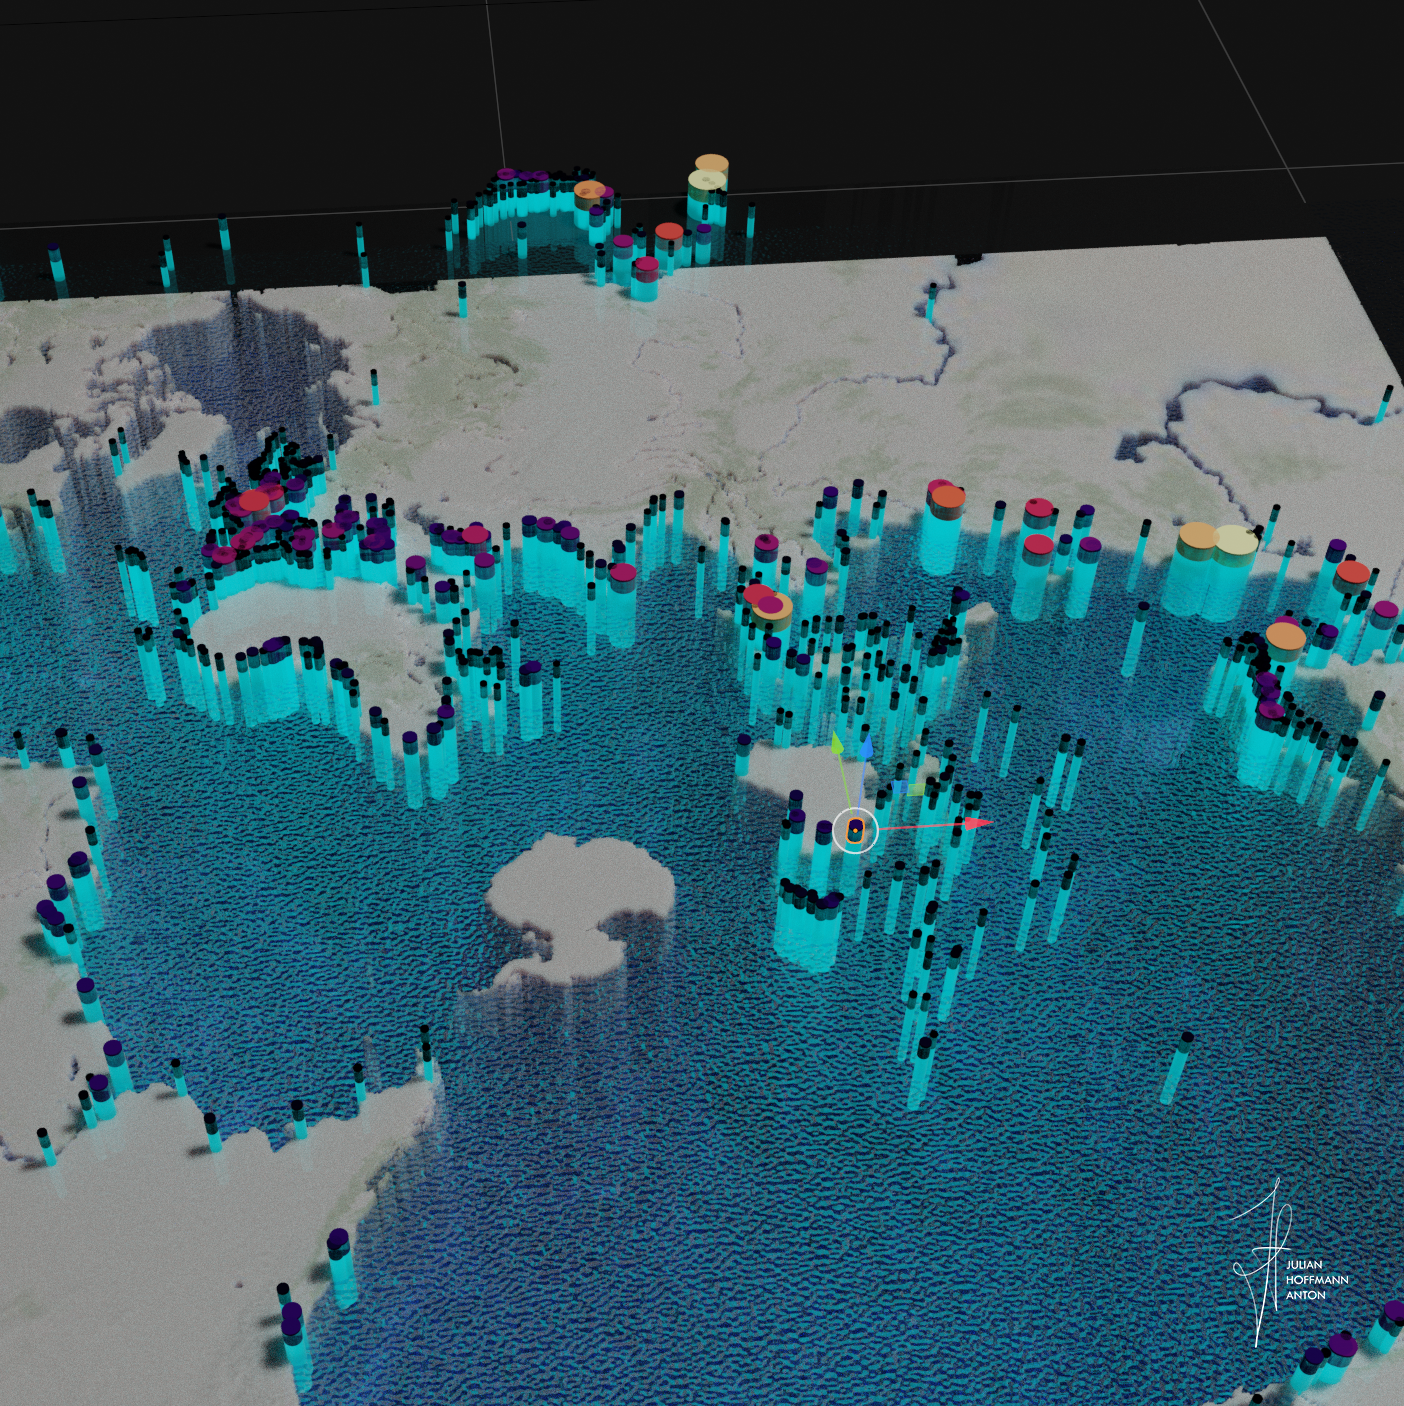
Containership port calls during the first 31 weeks of 2020 compared to the same period in 2019
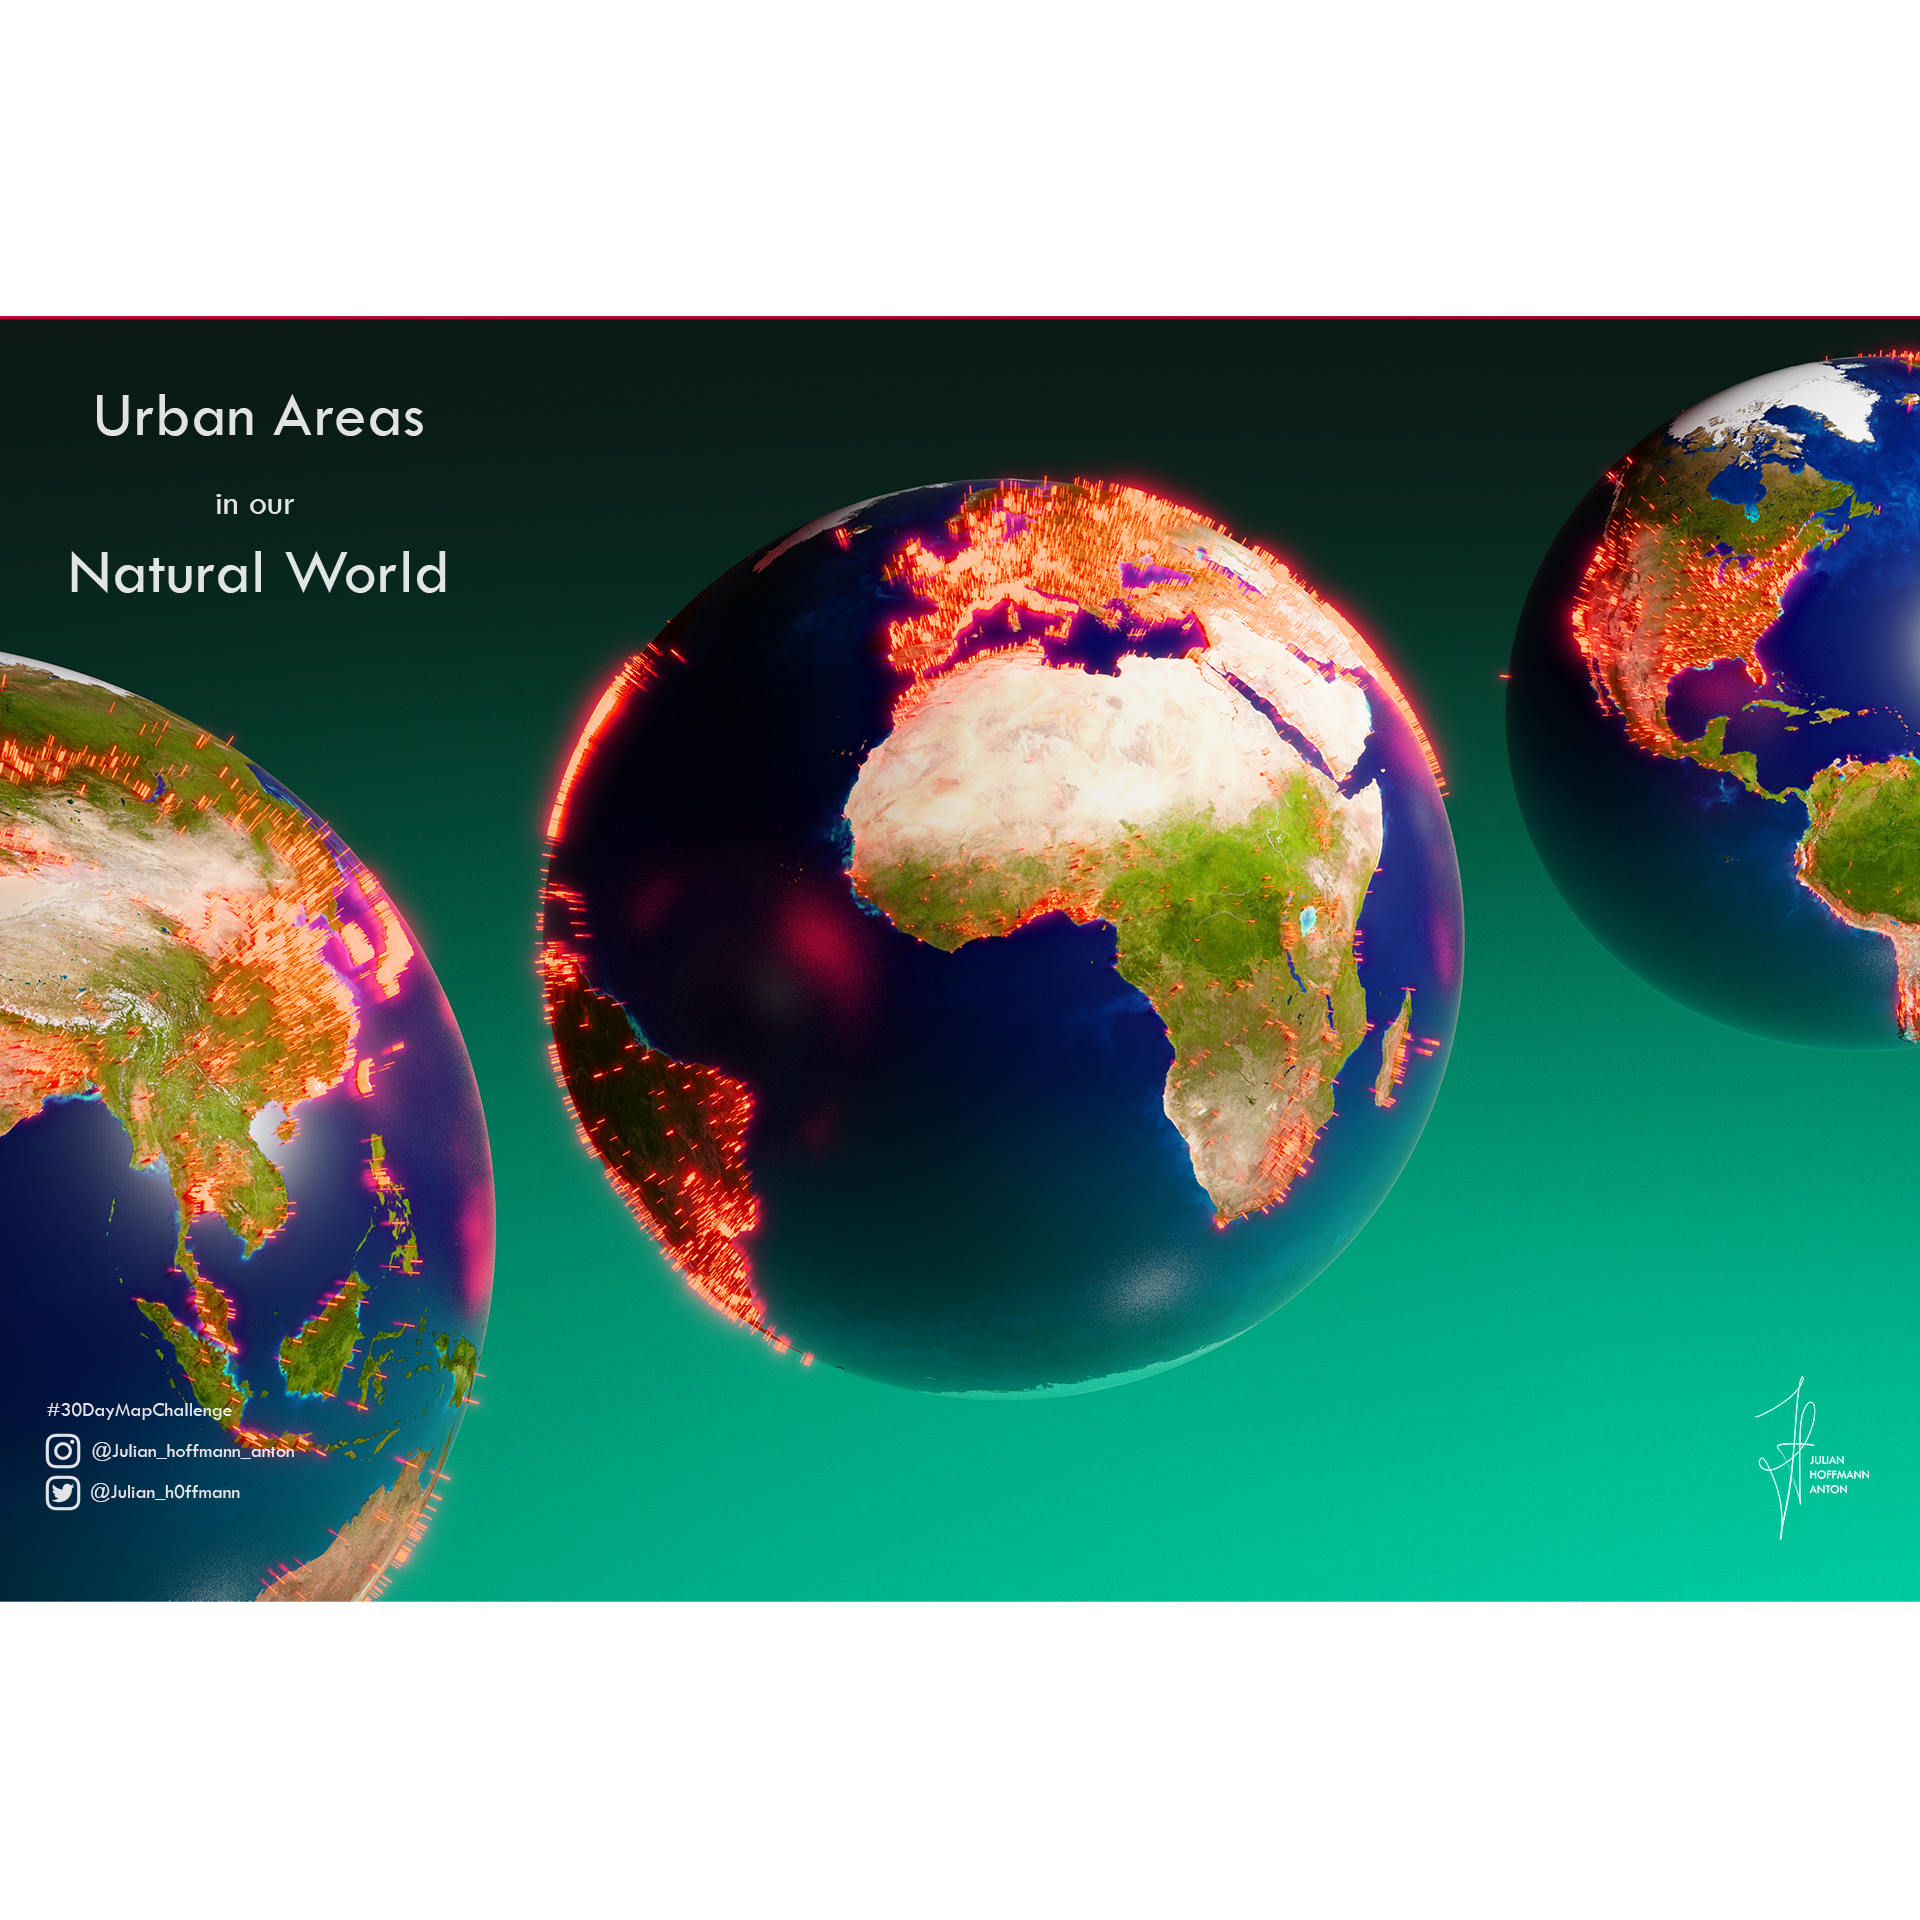
Urban World

Spatial Dish I.


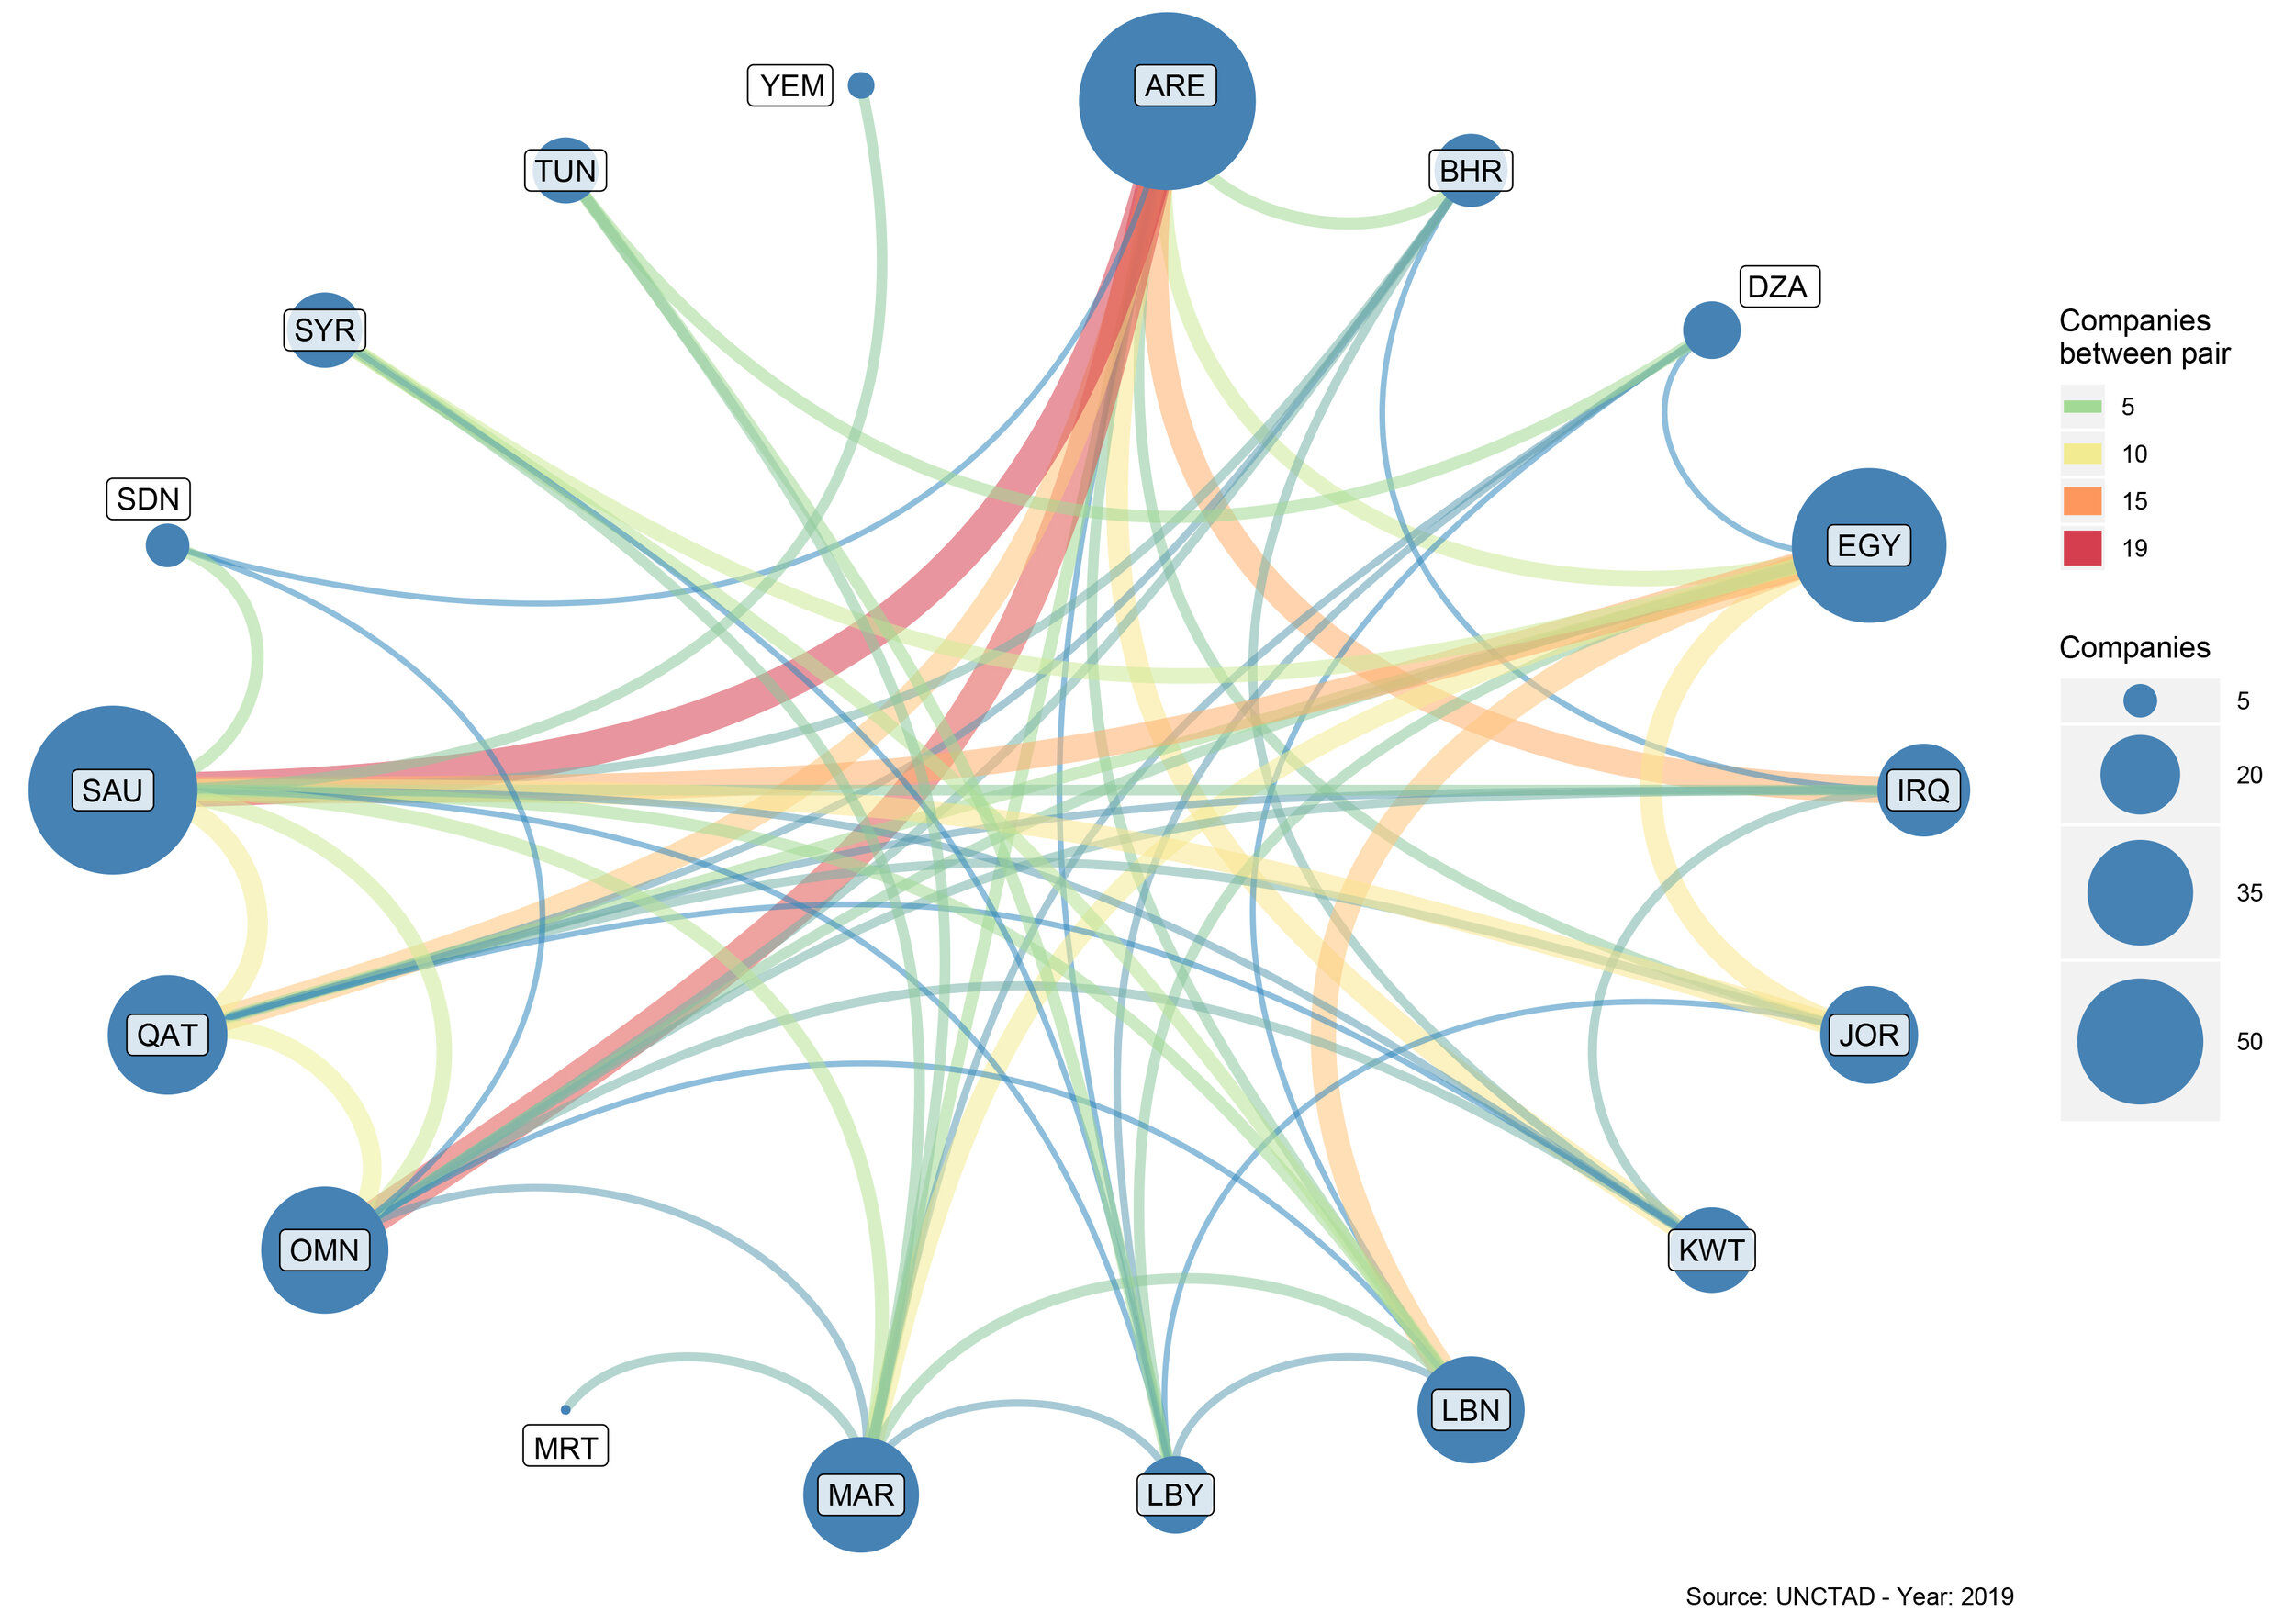
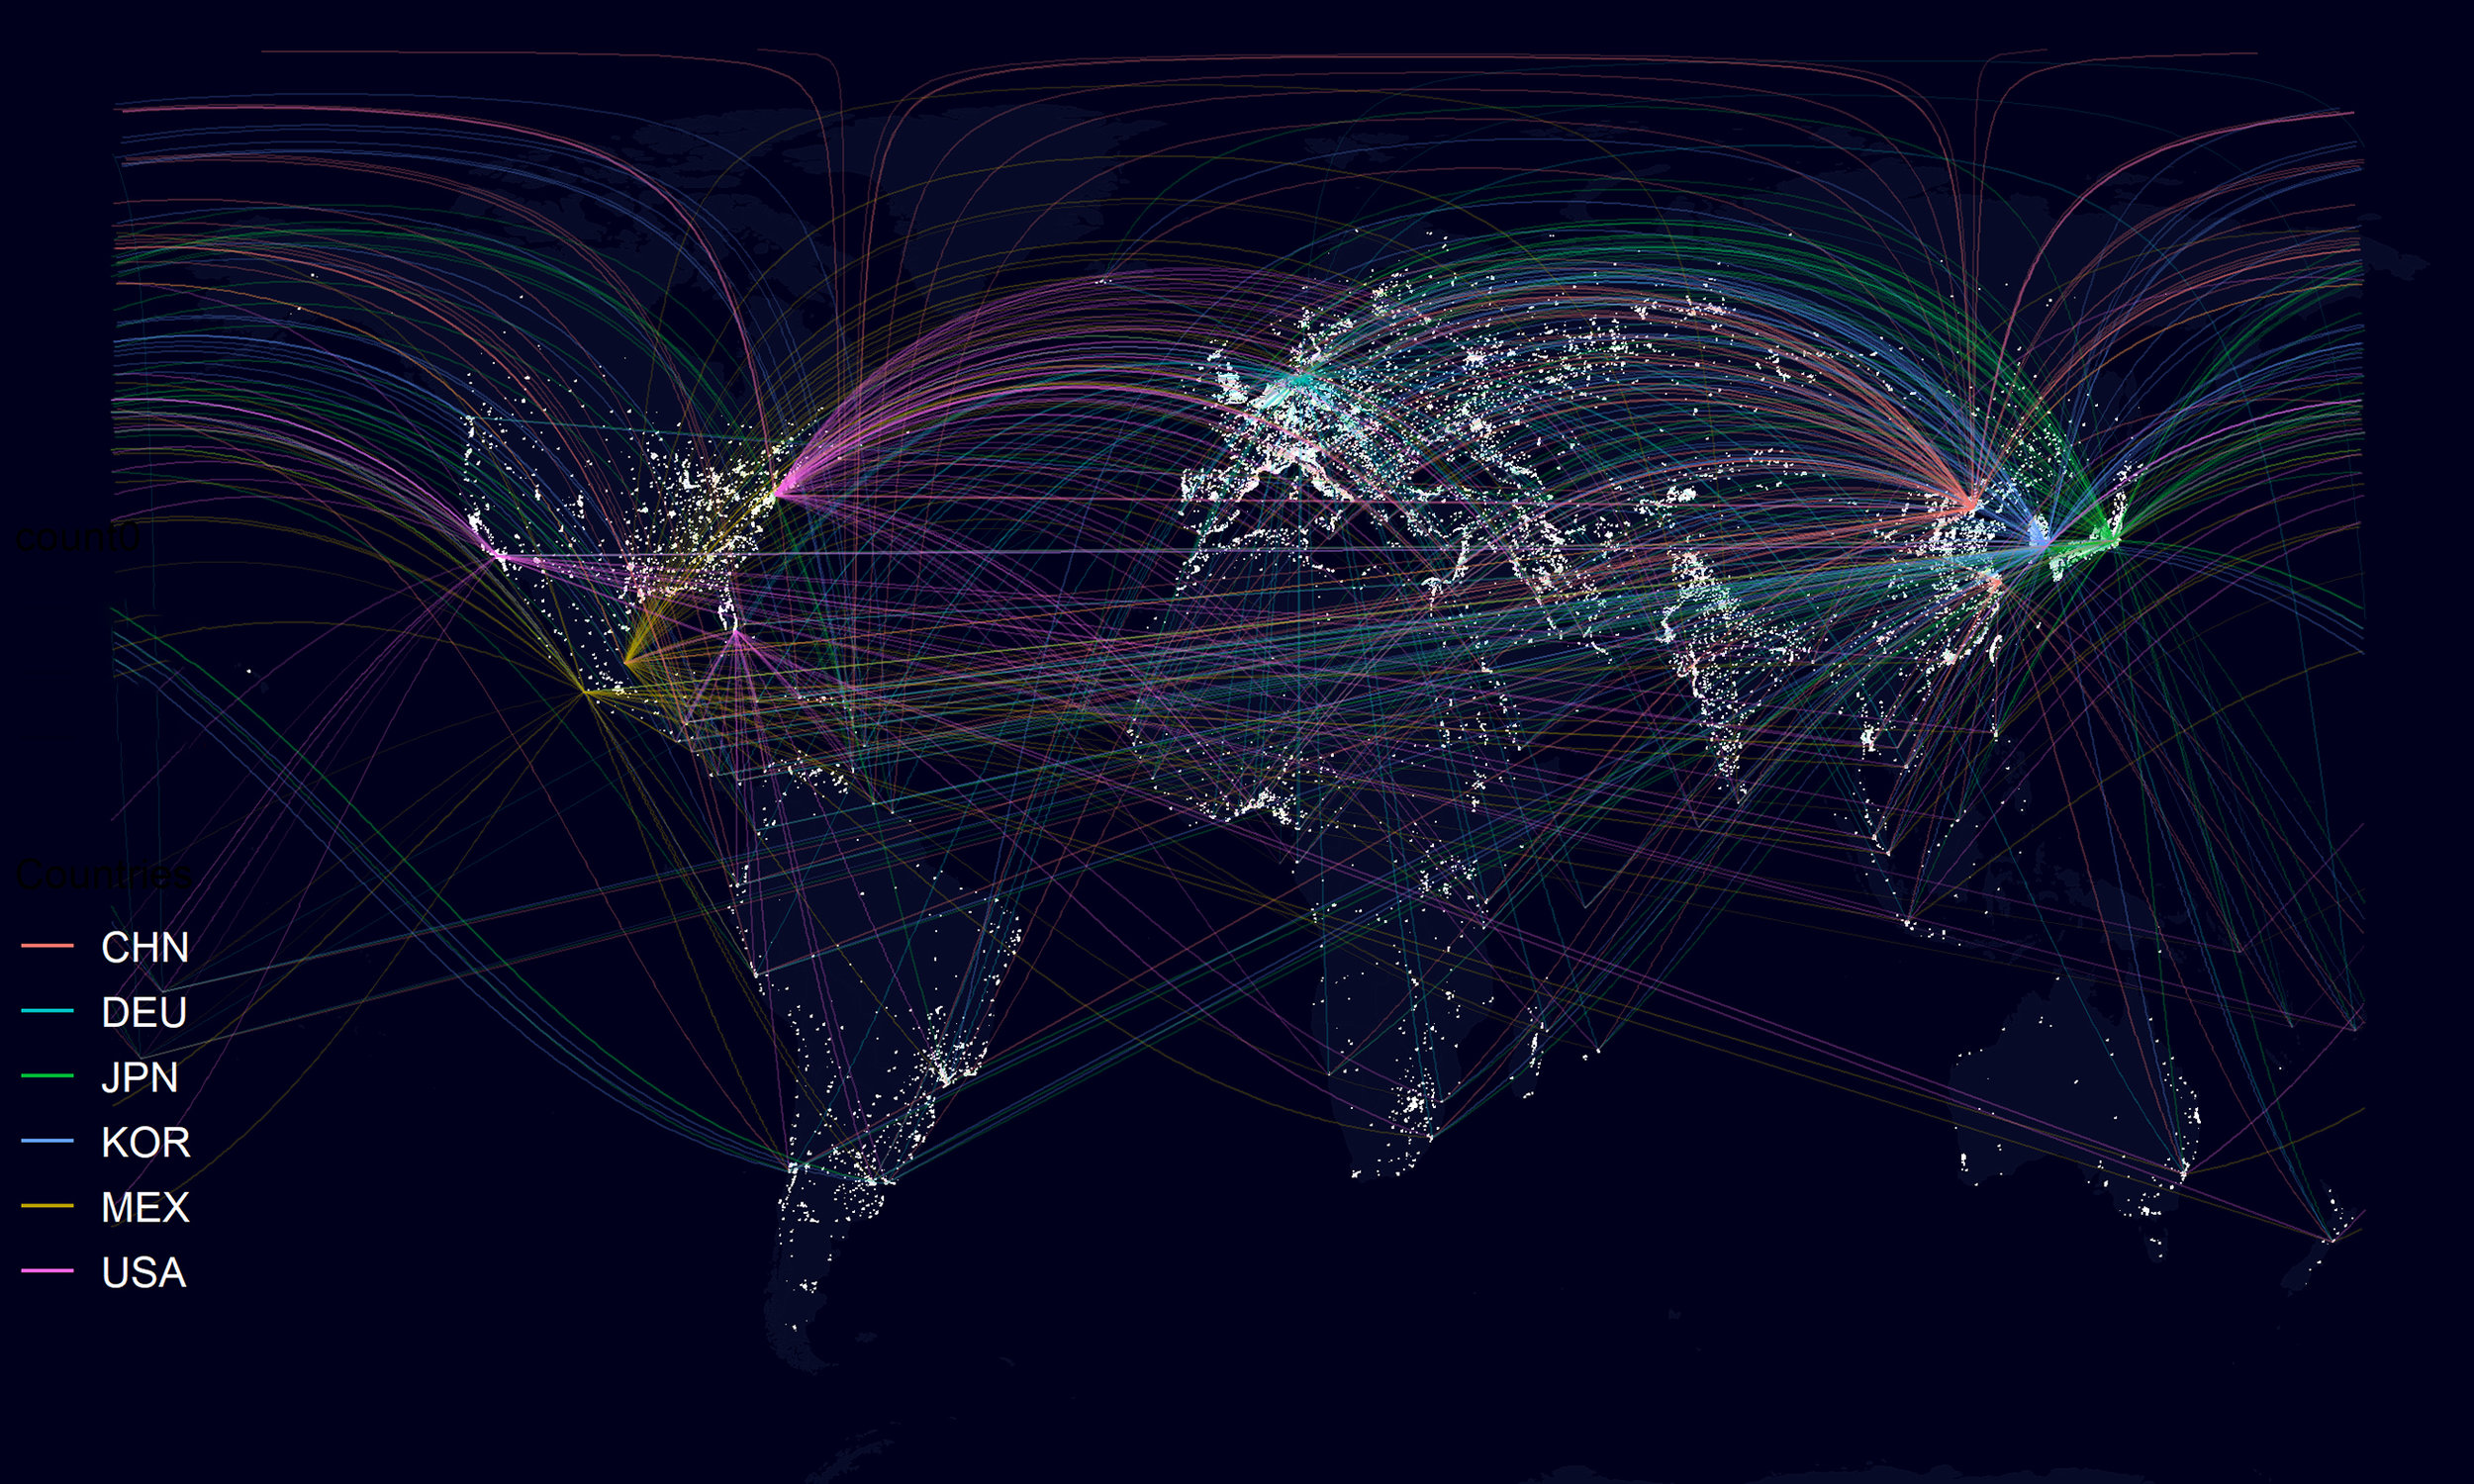
Connected Countries in MENA
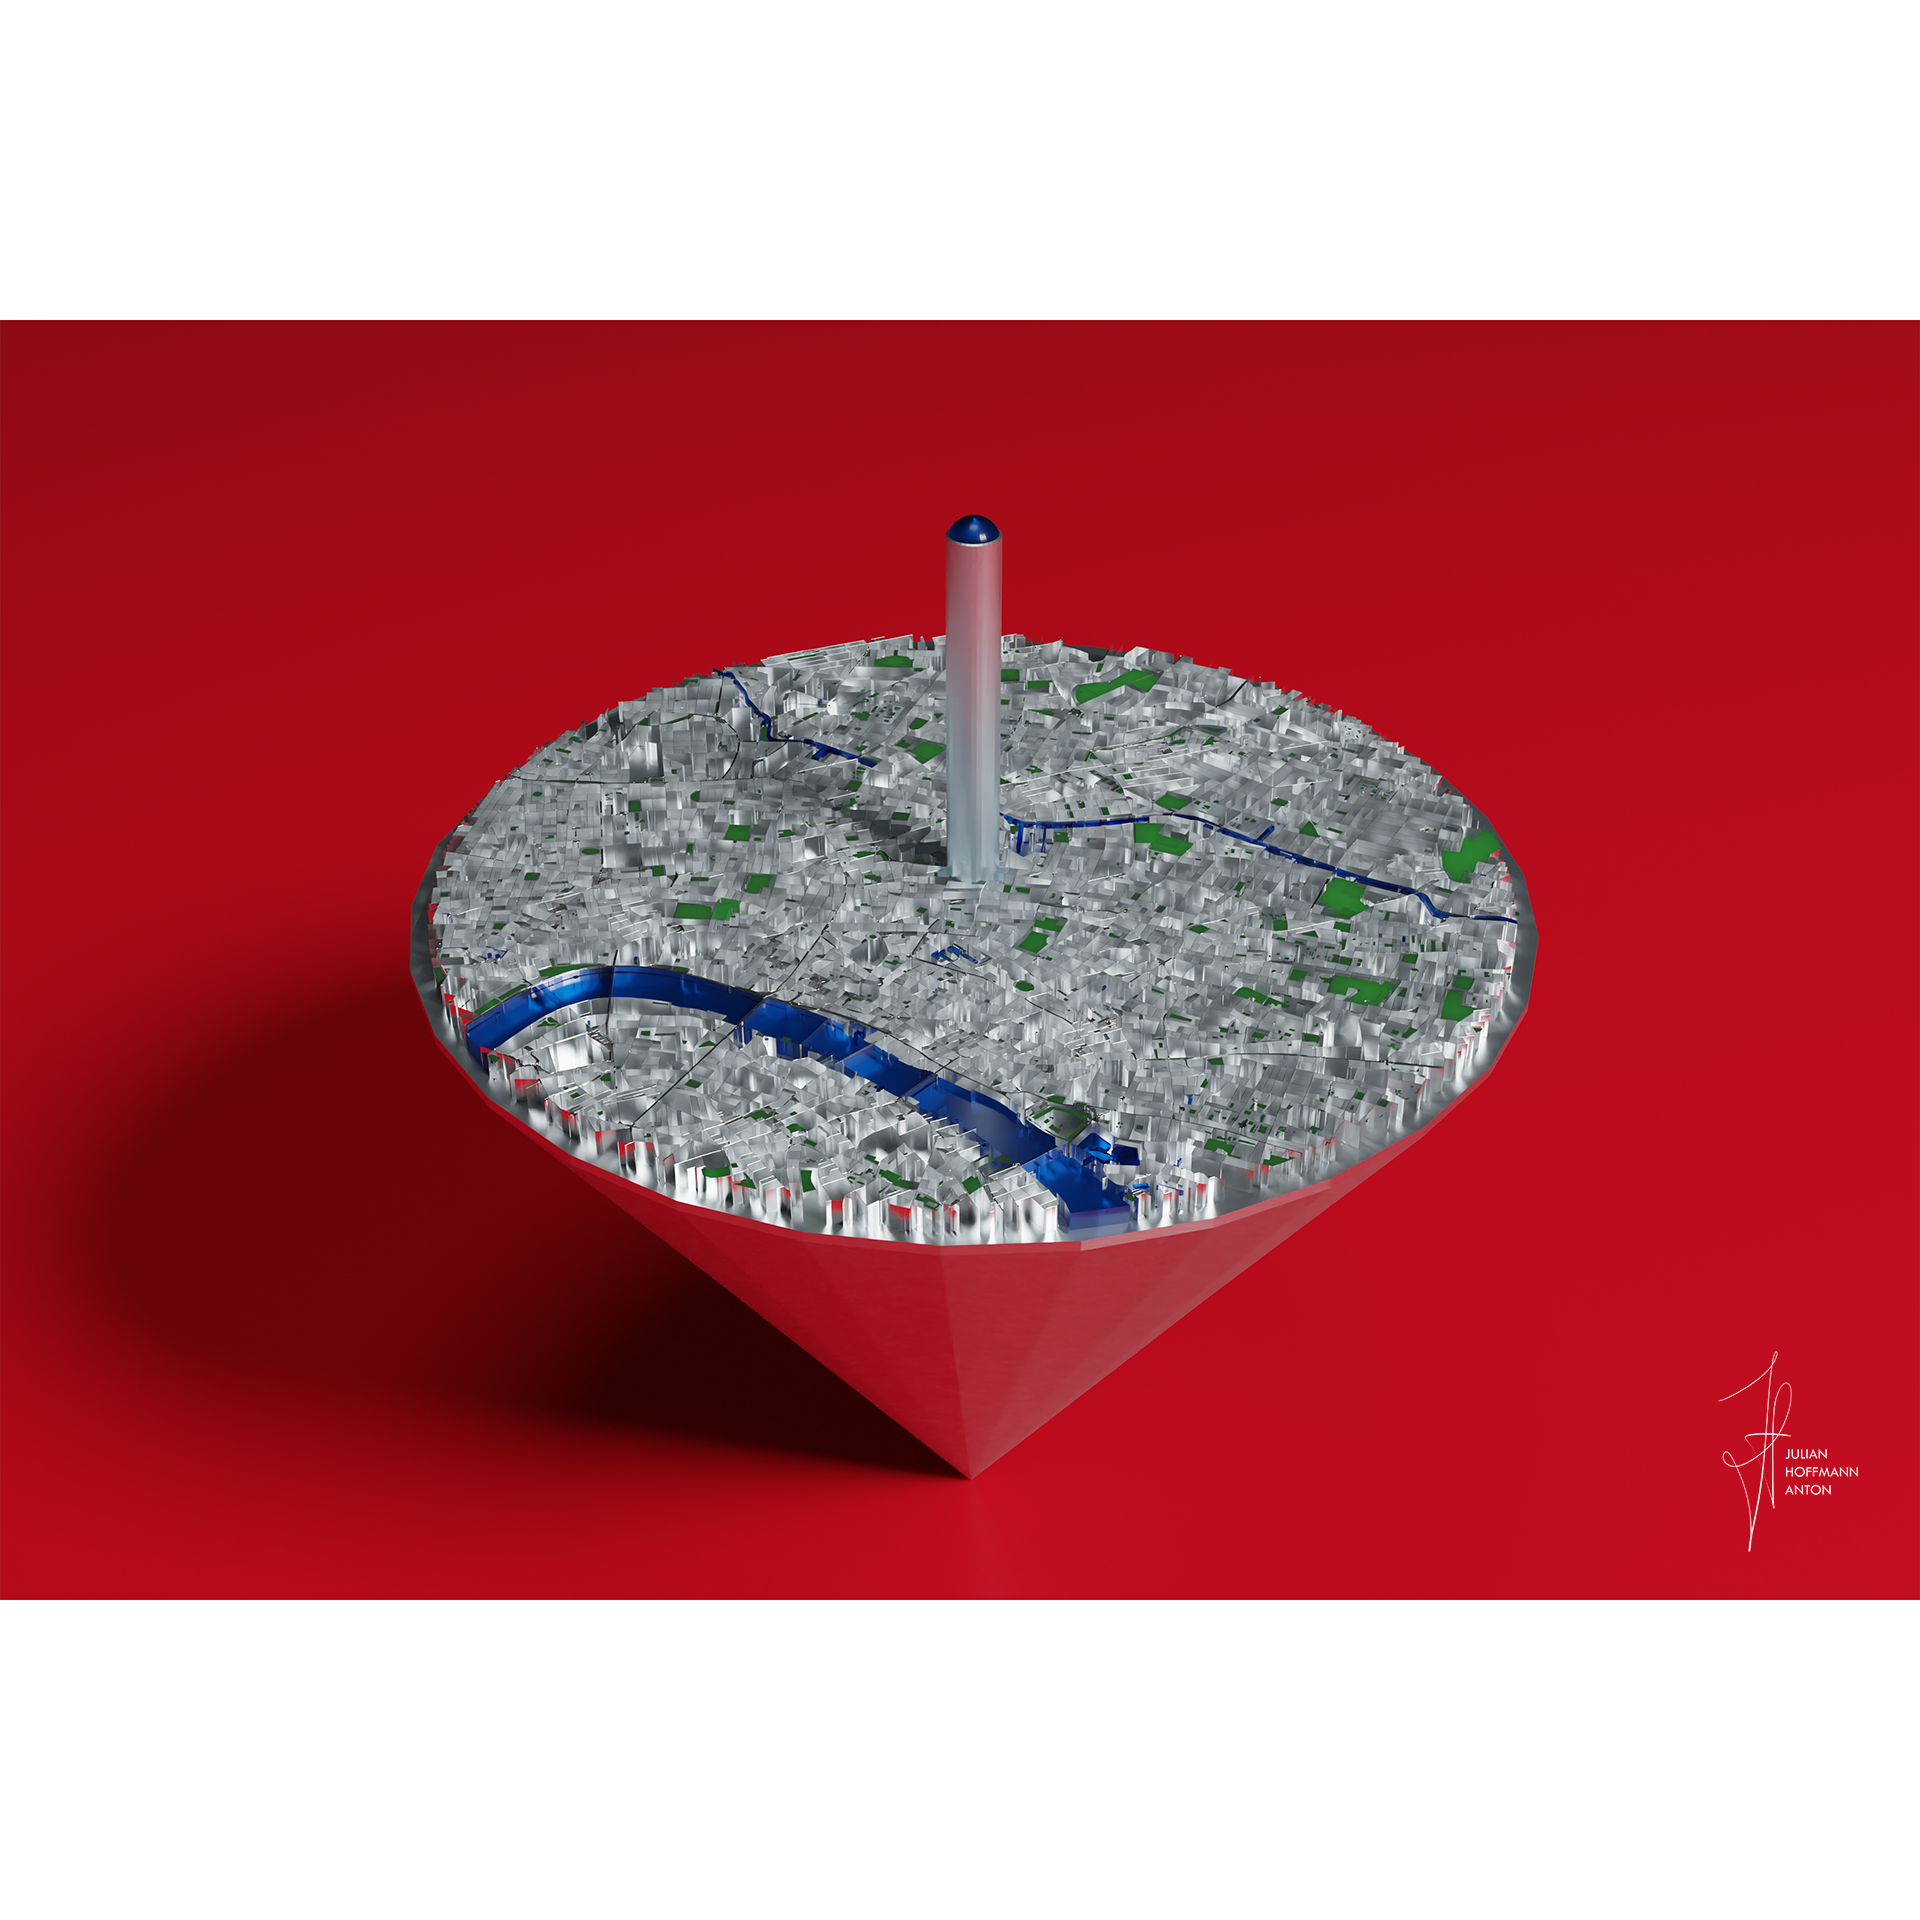
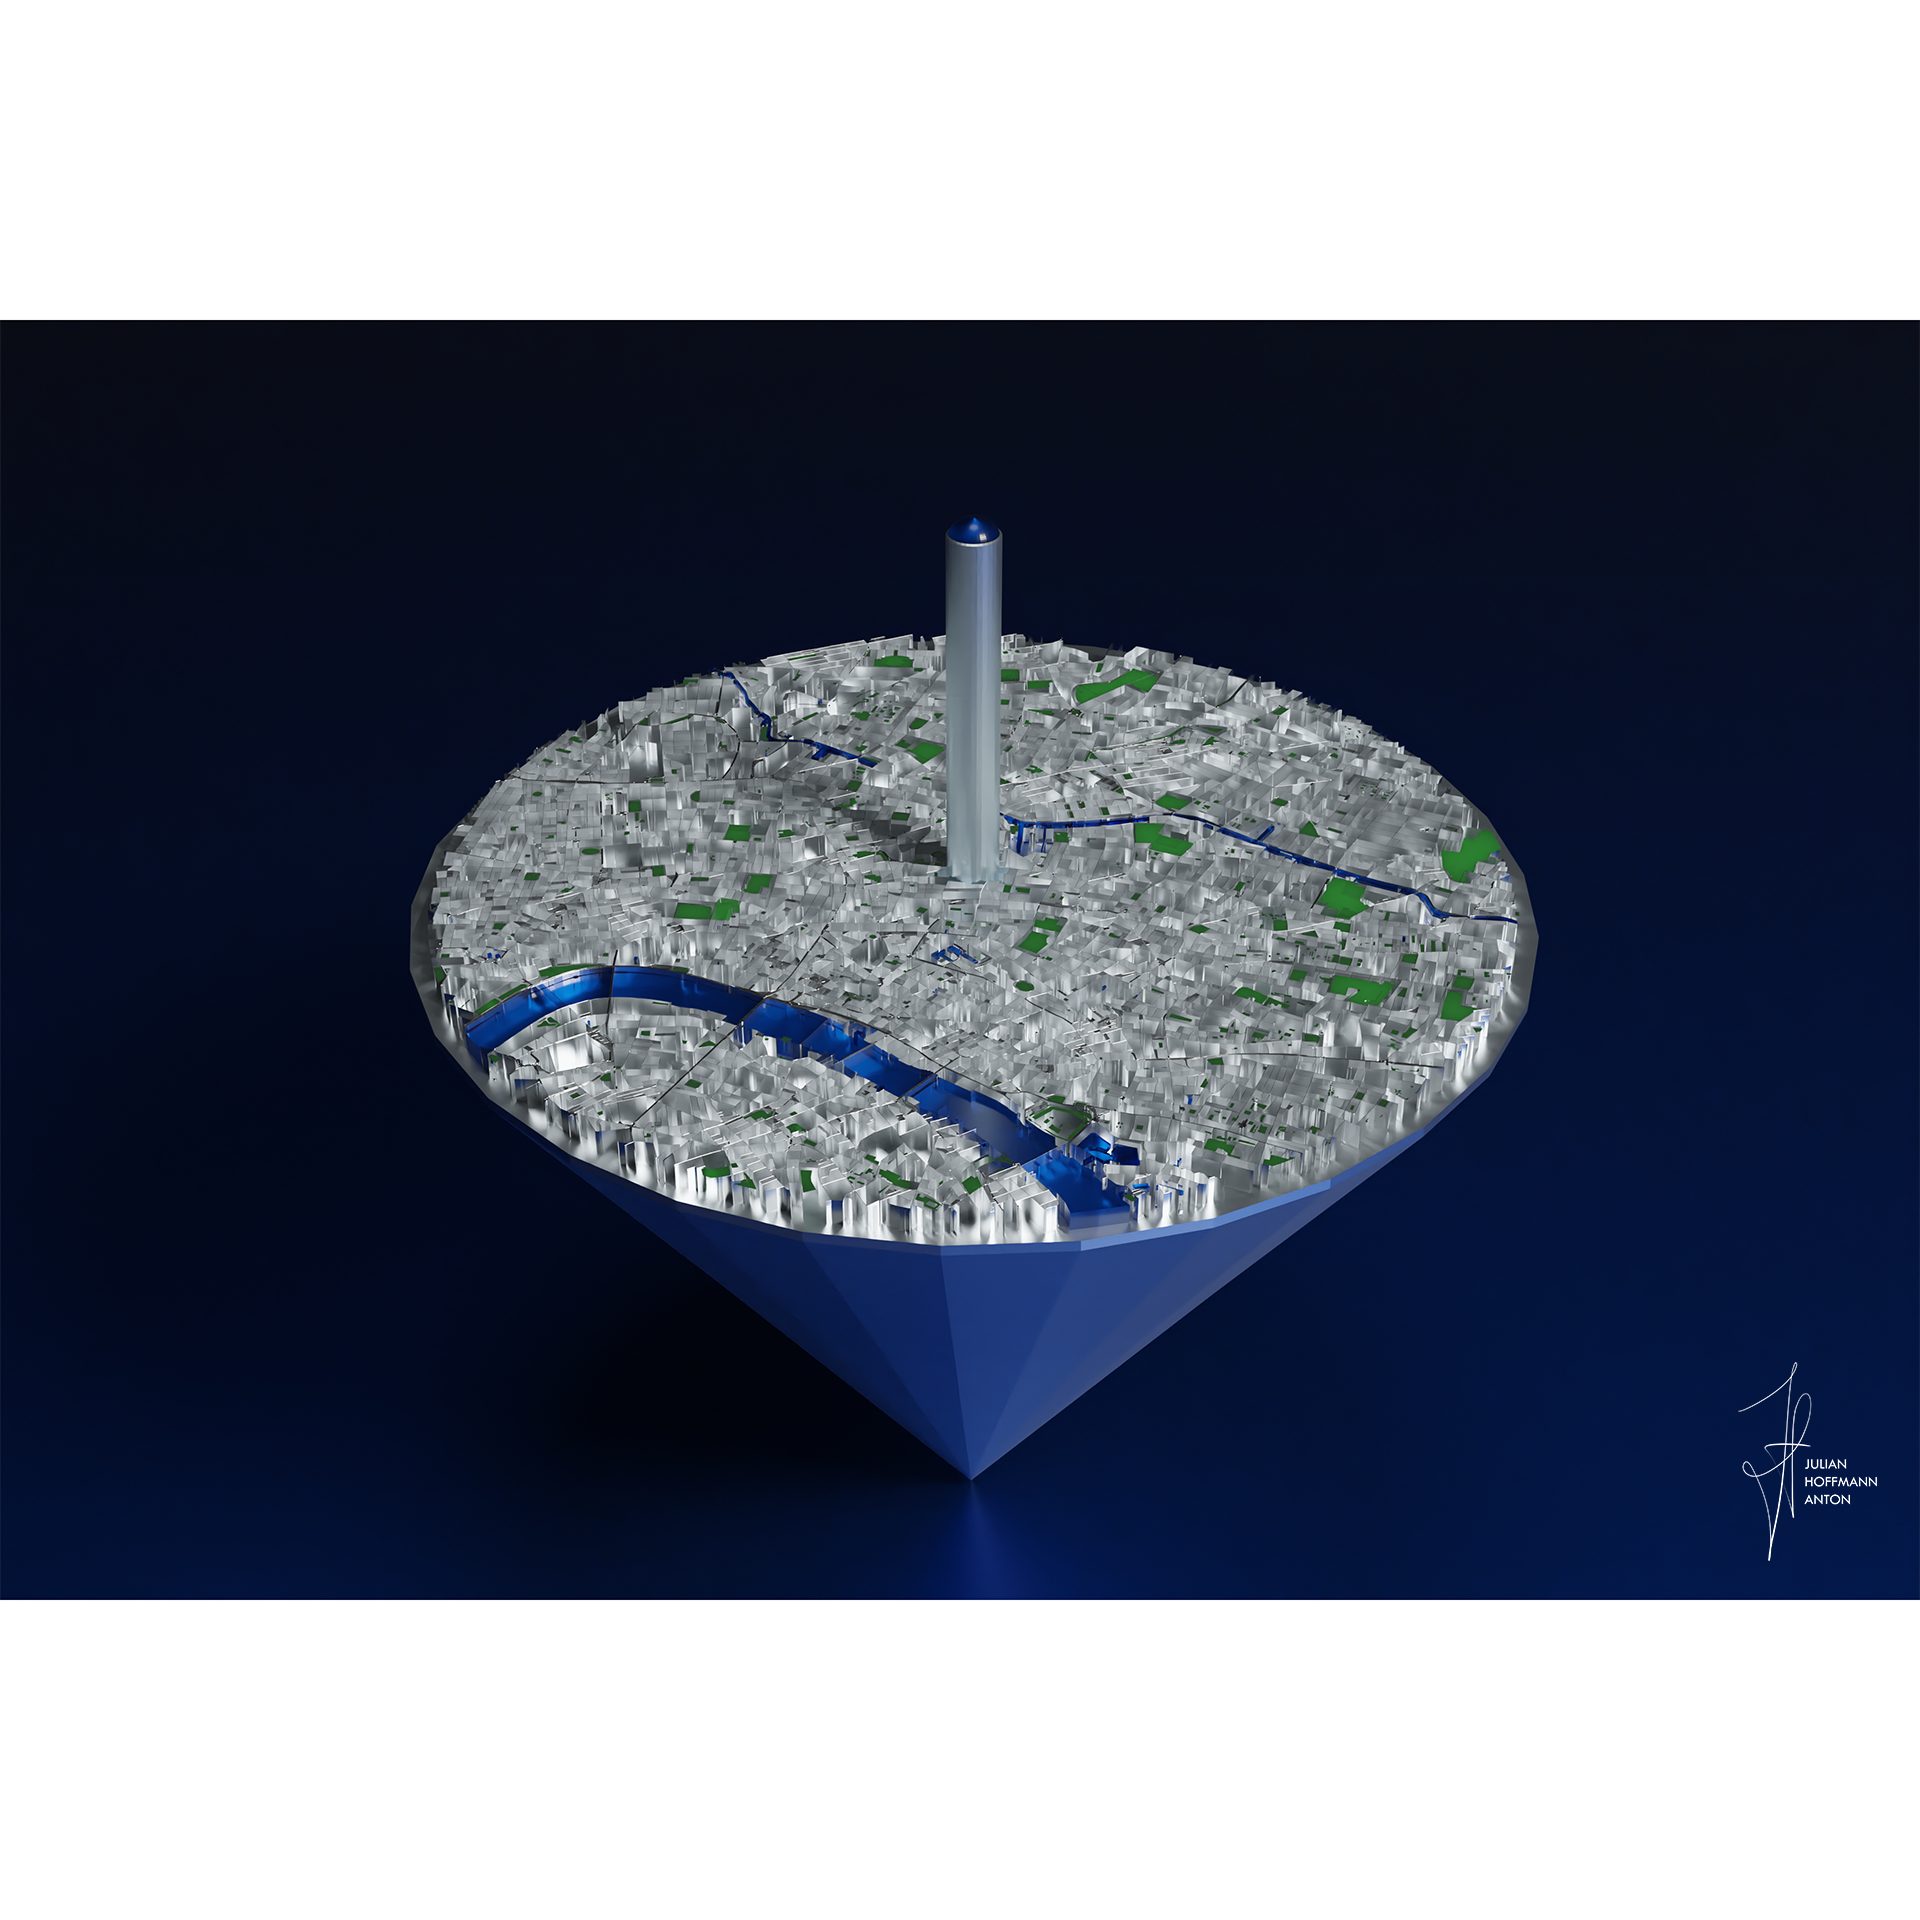
London: Spinning my Labytinth I.
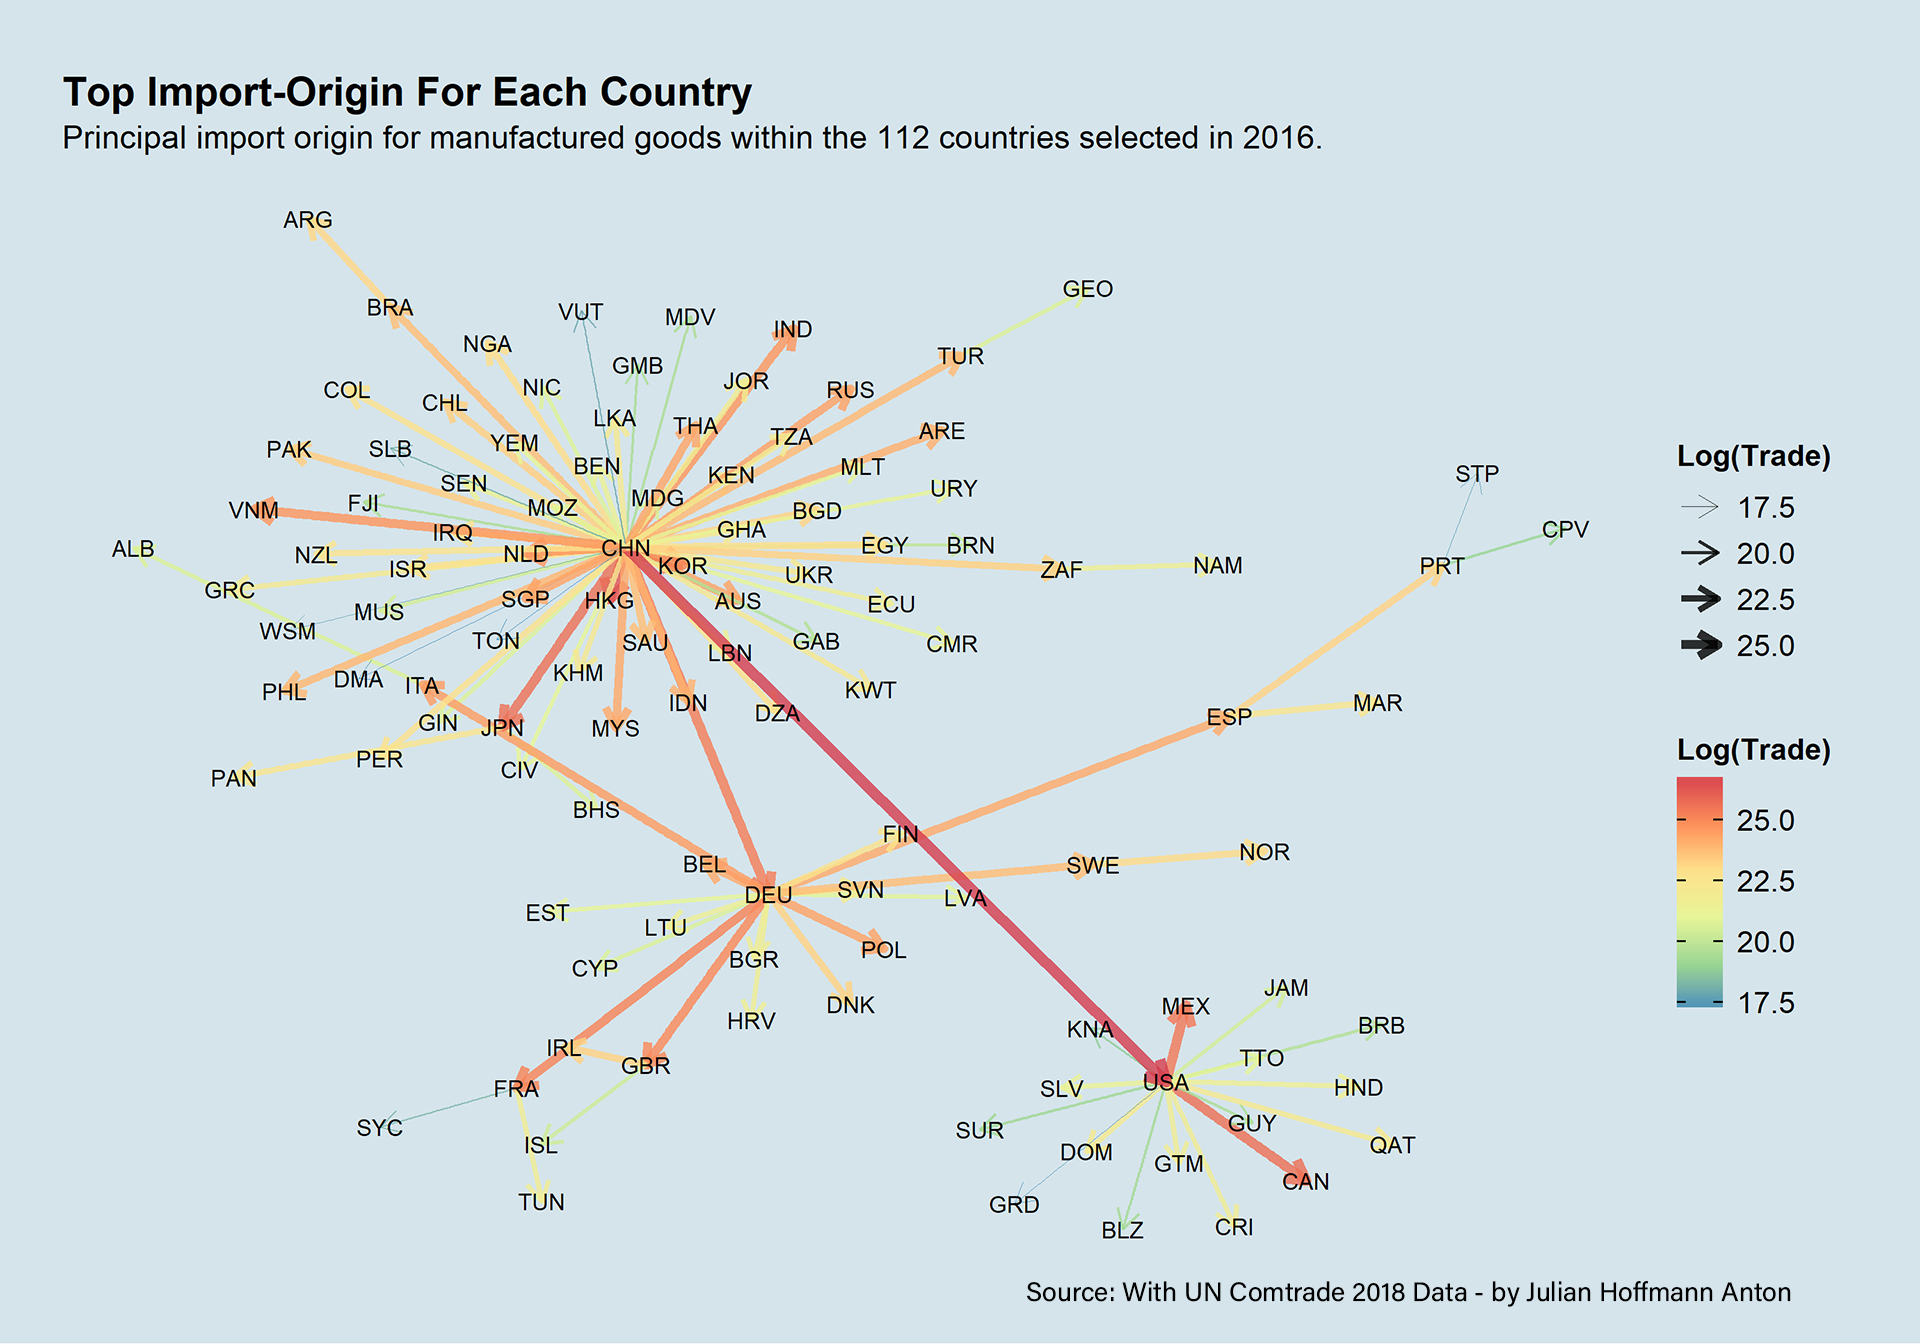
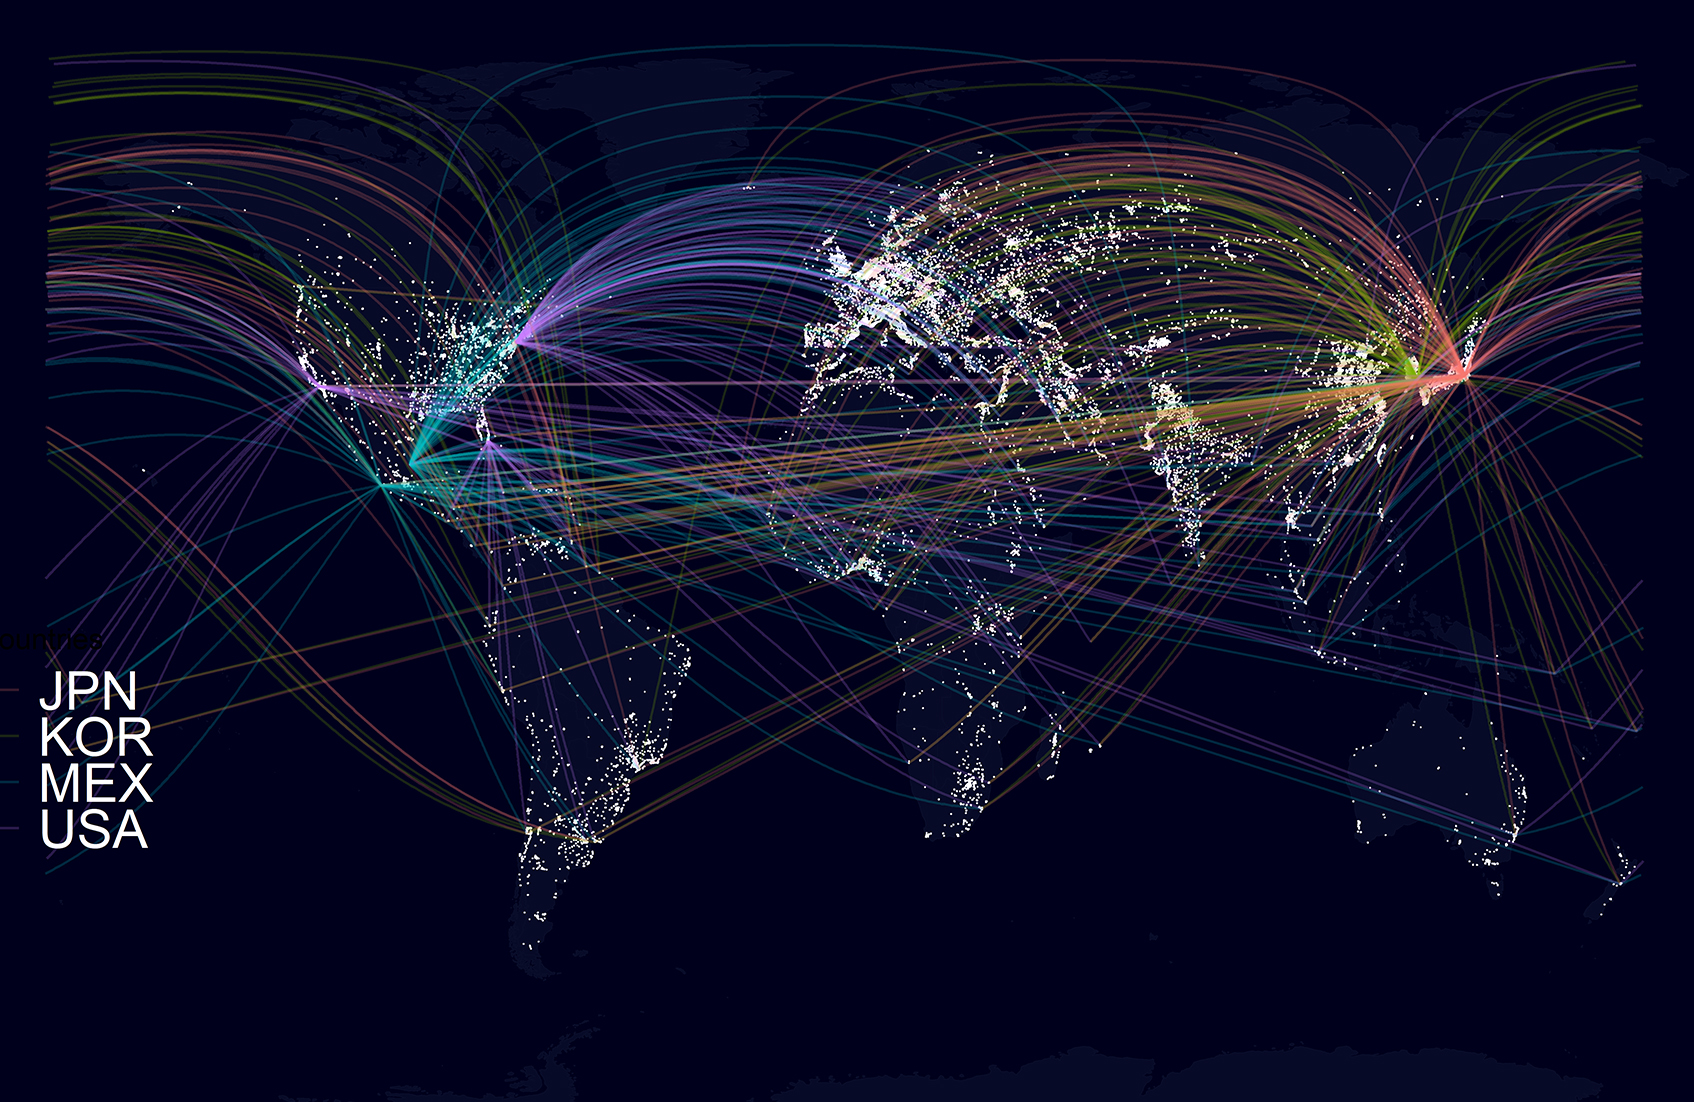
Top Import-Origin
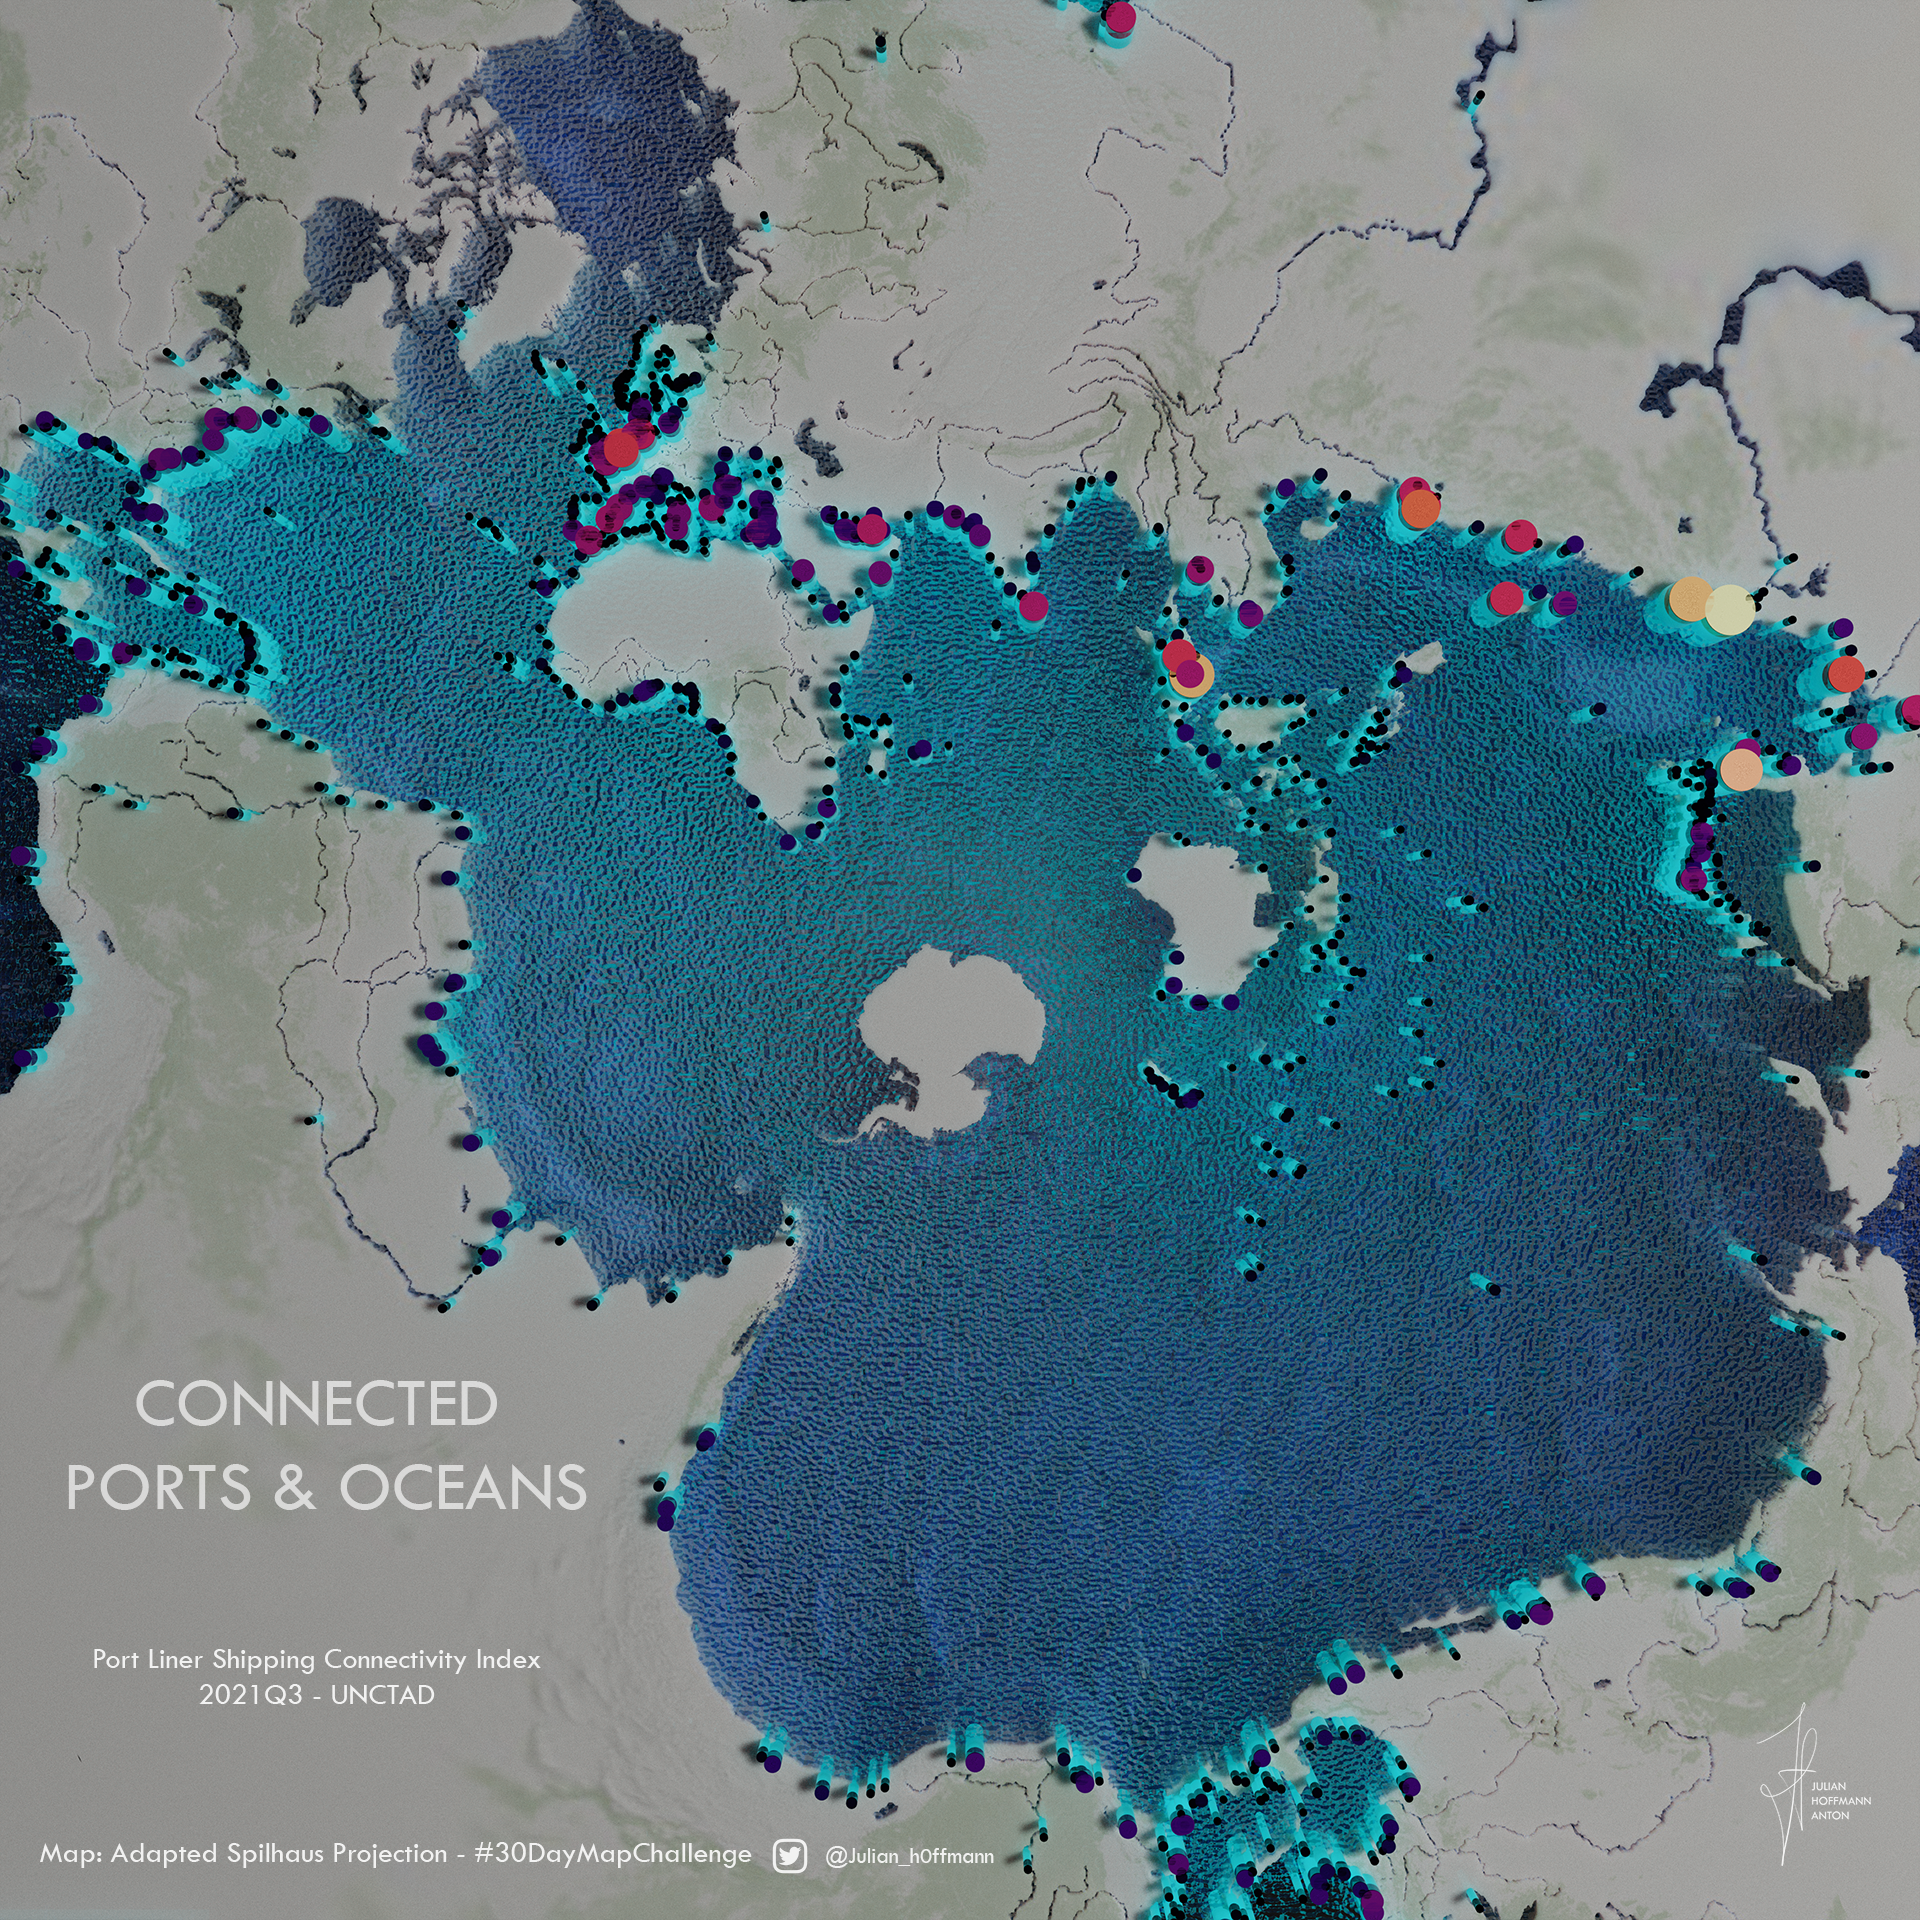
Connected Ports & Oceans
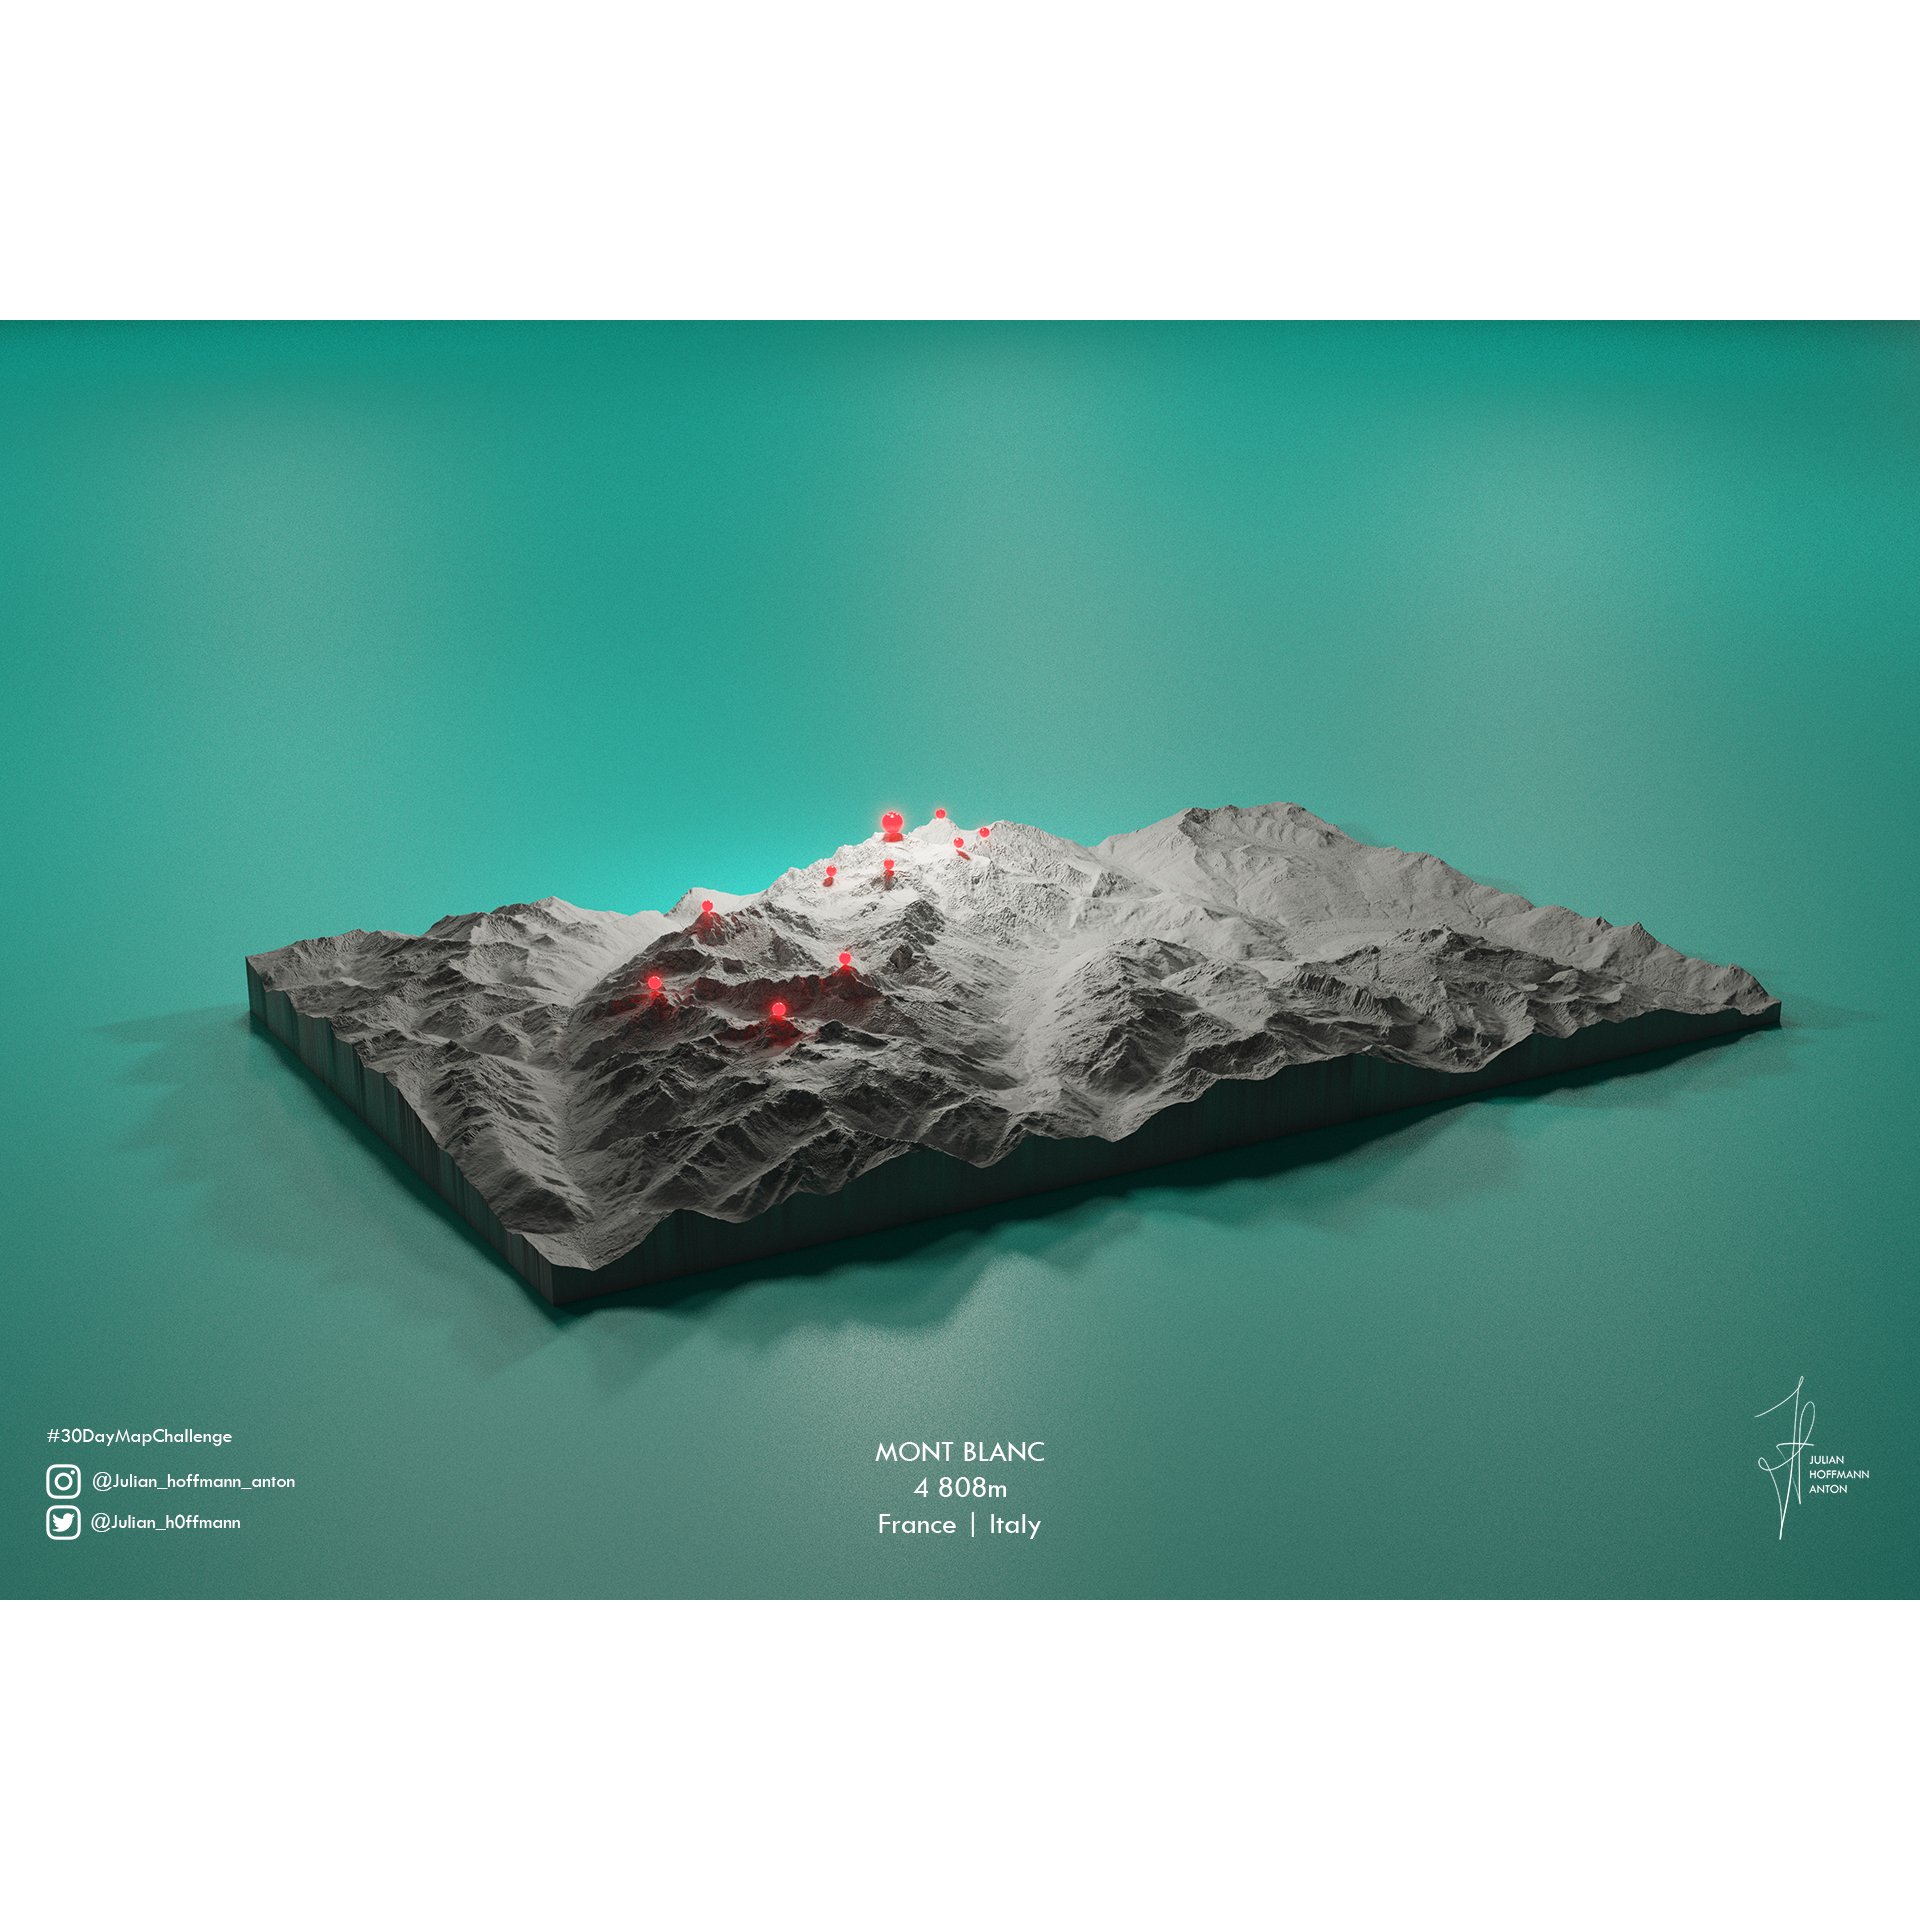
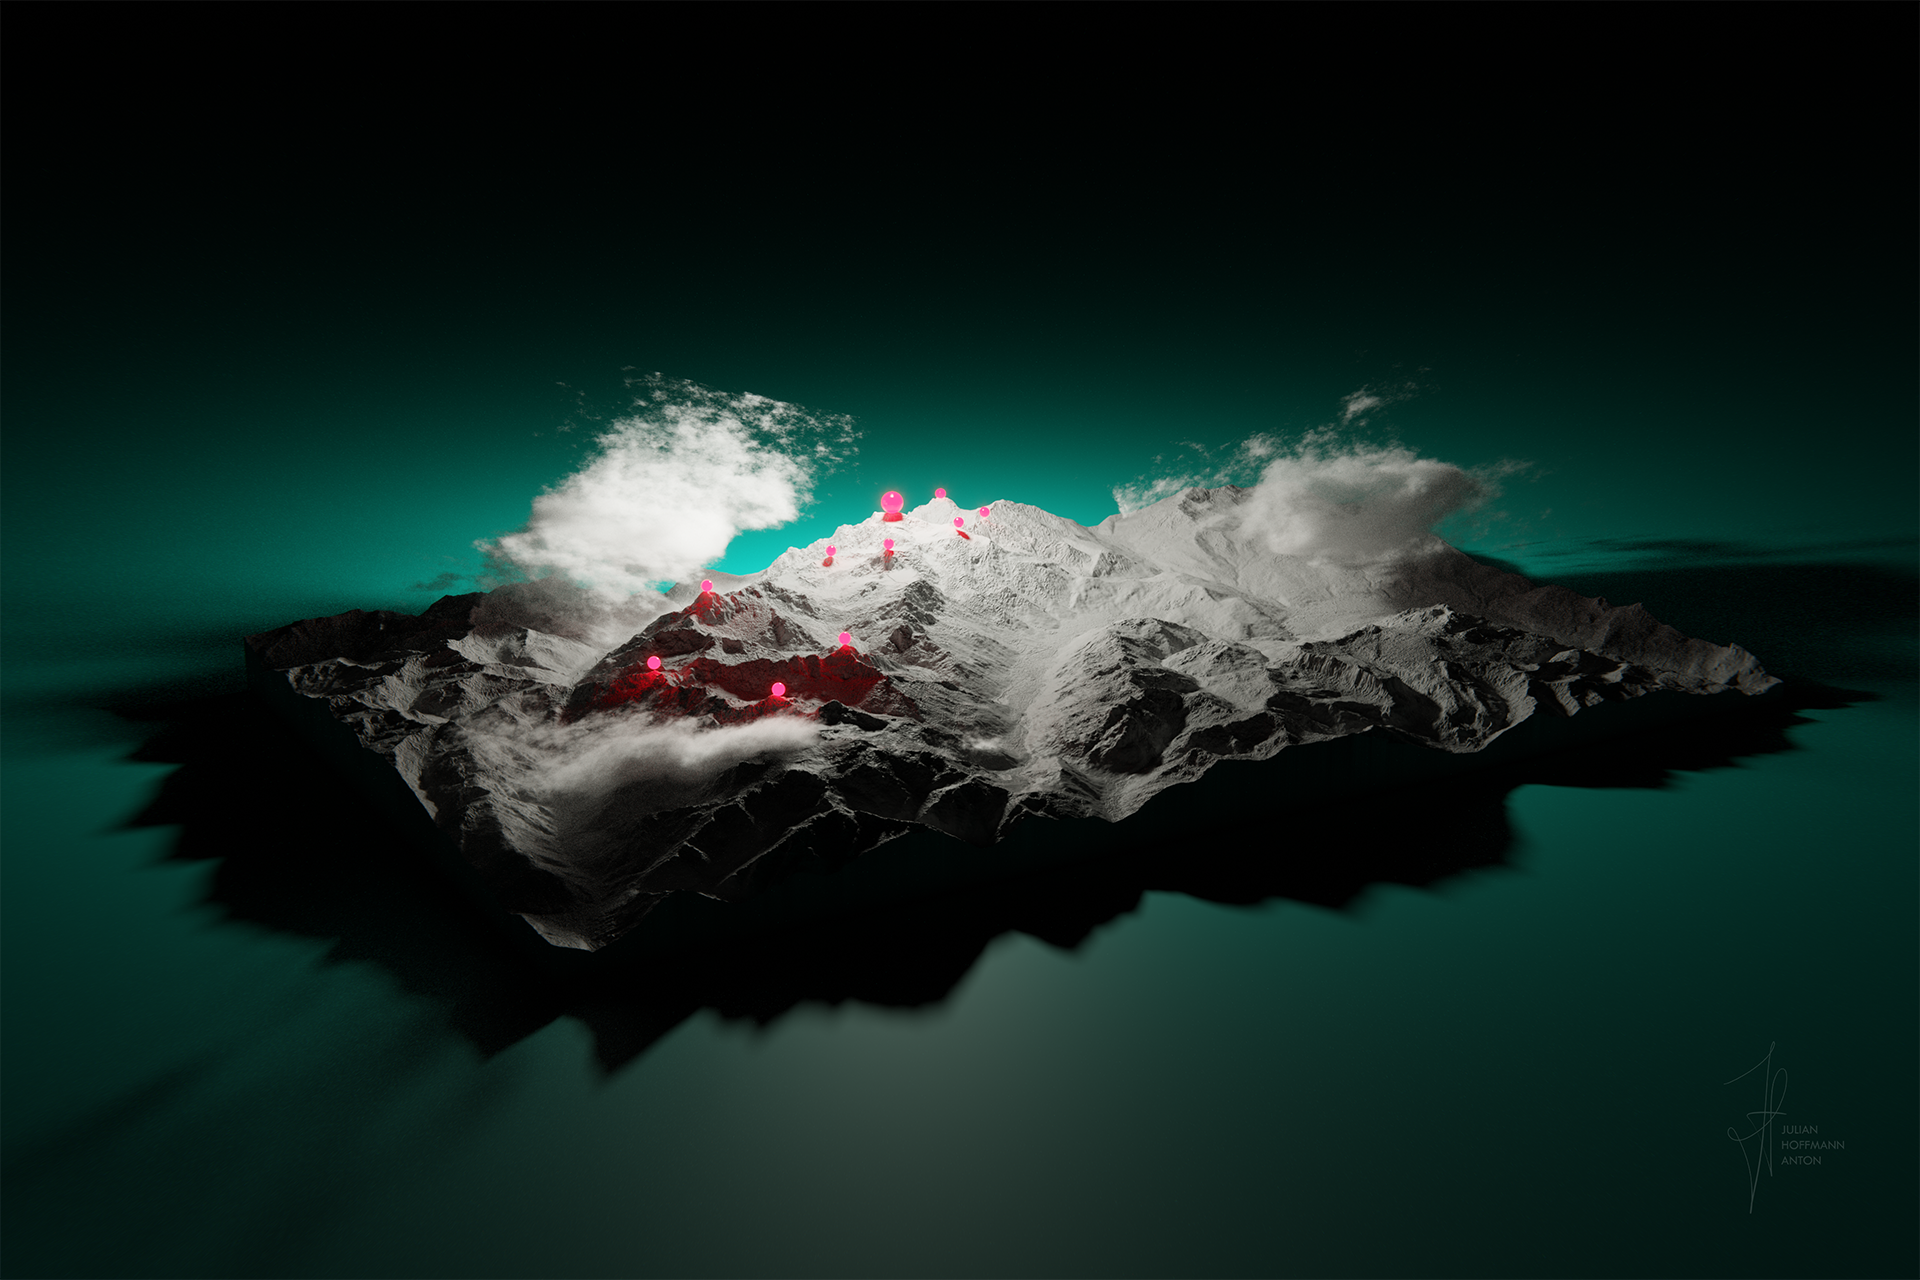
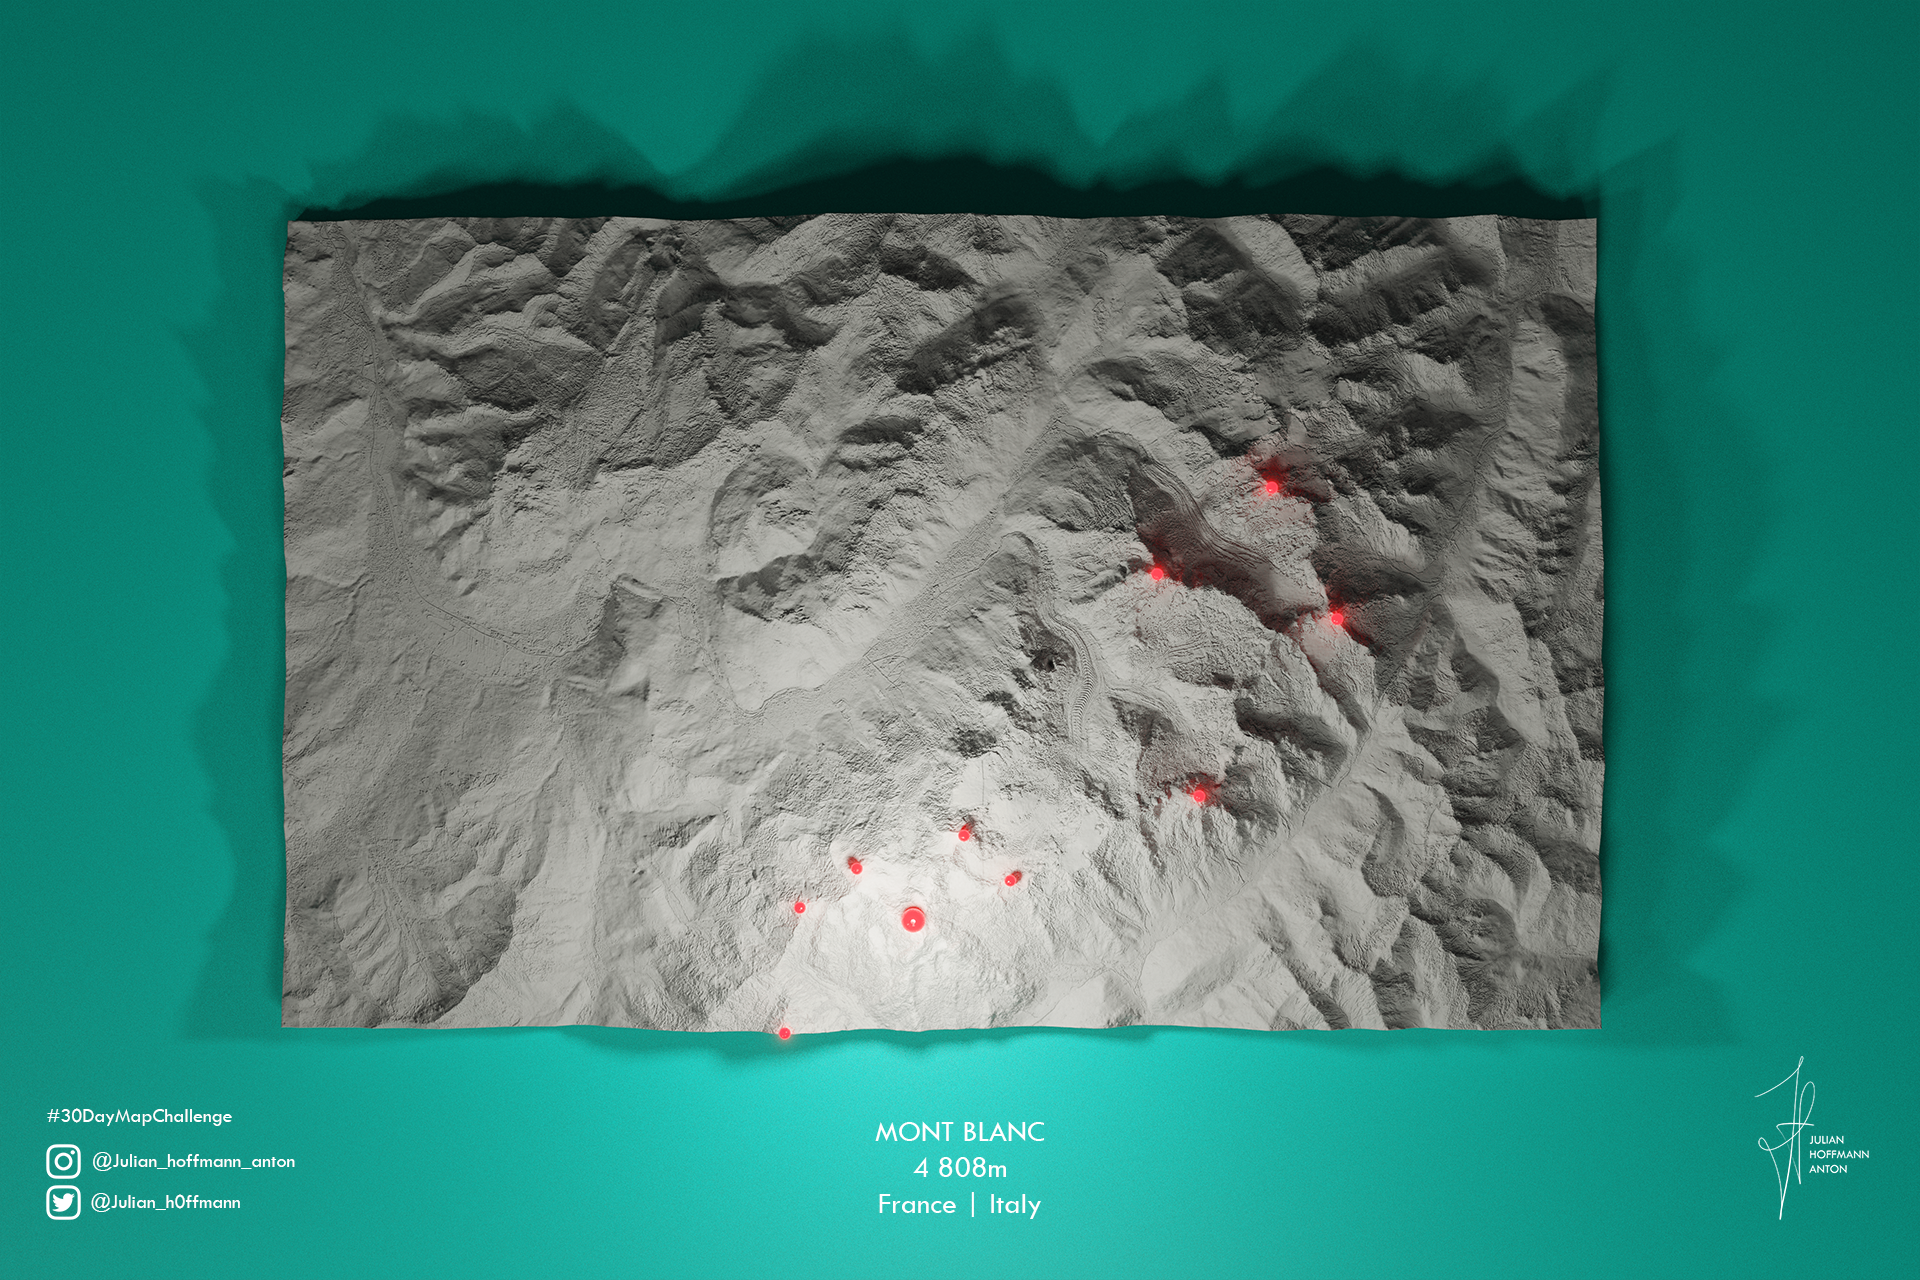
Mont Blanc
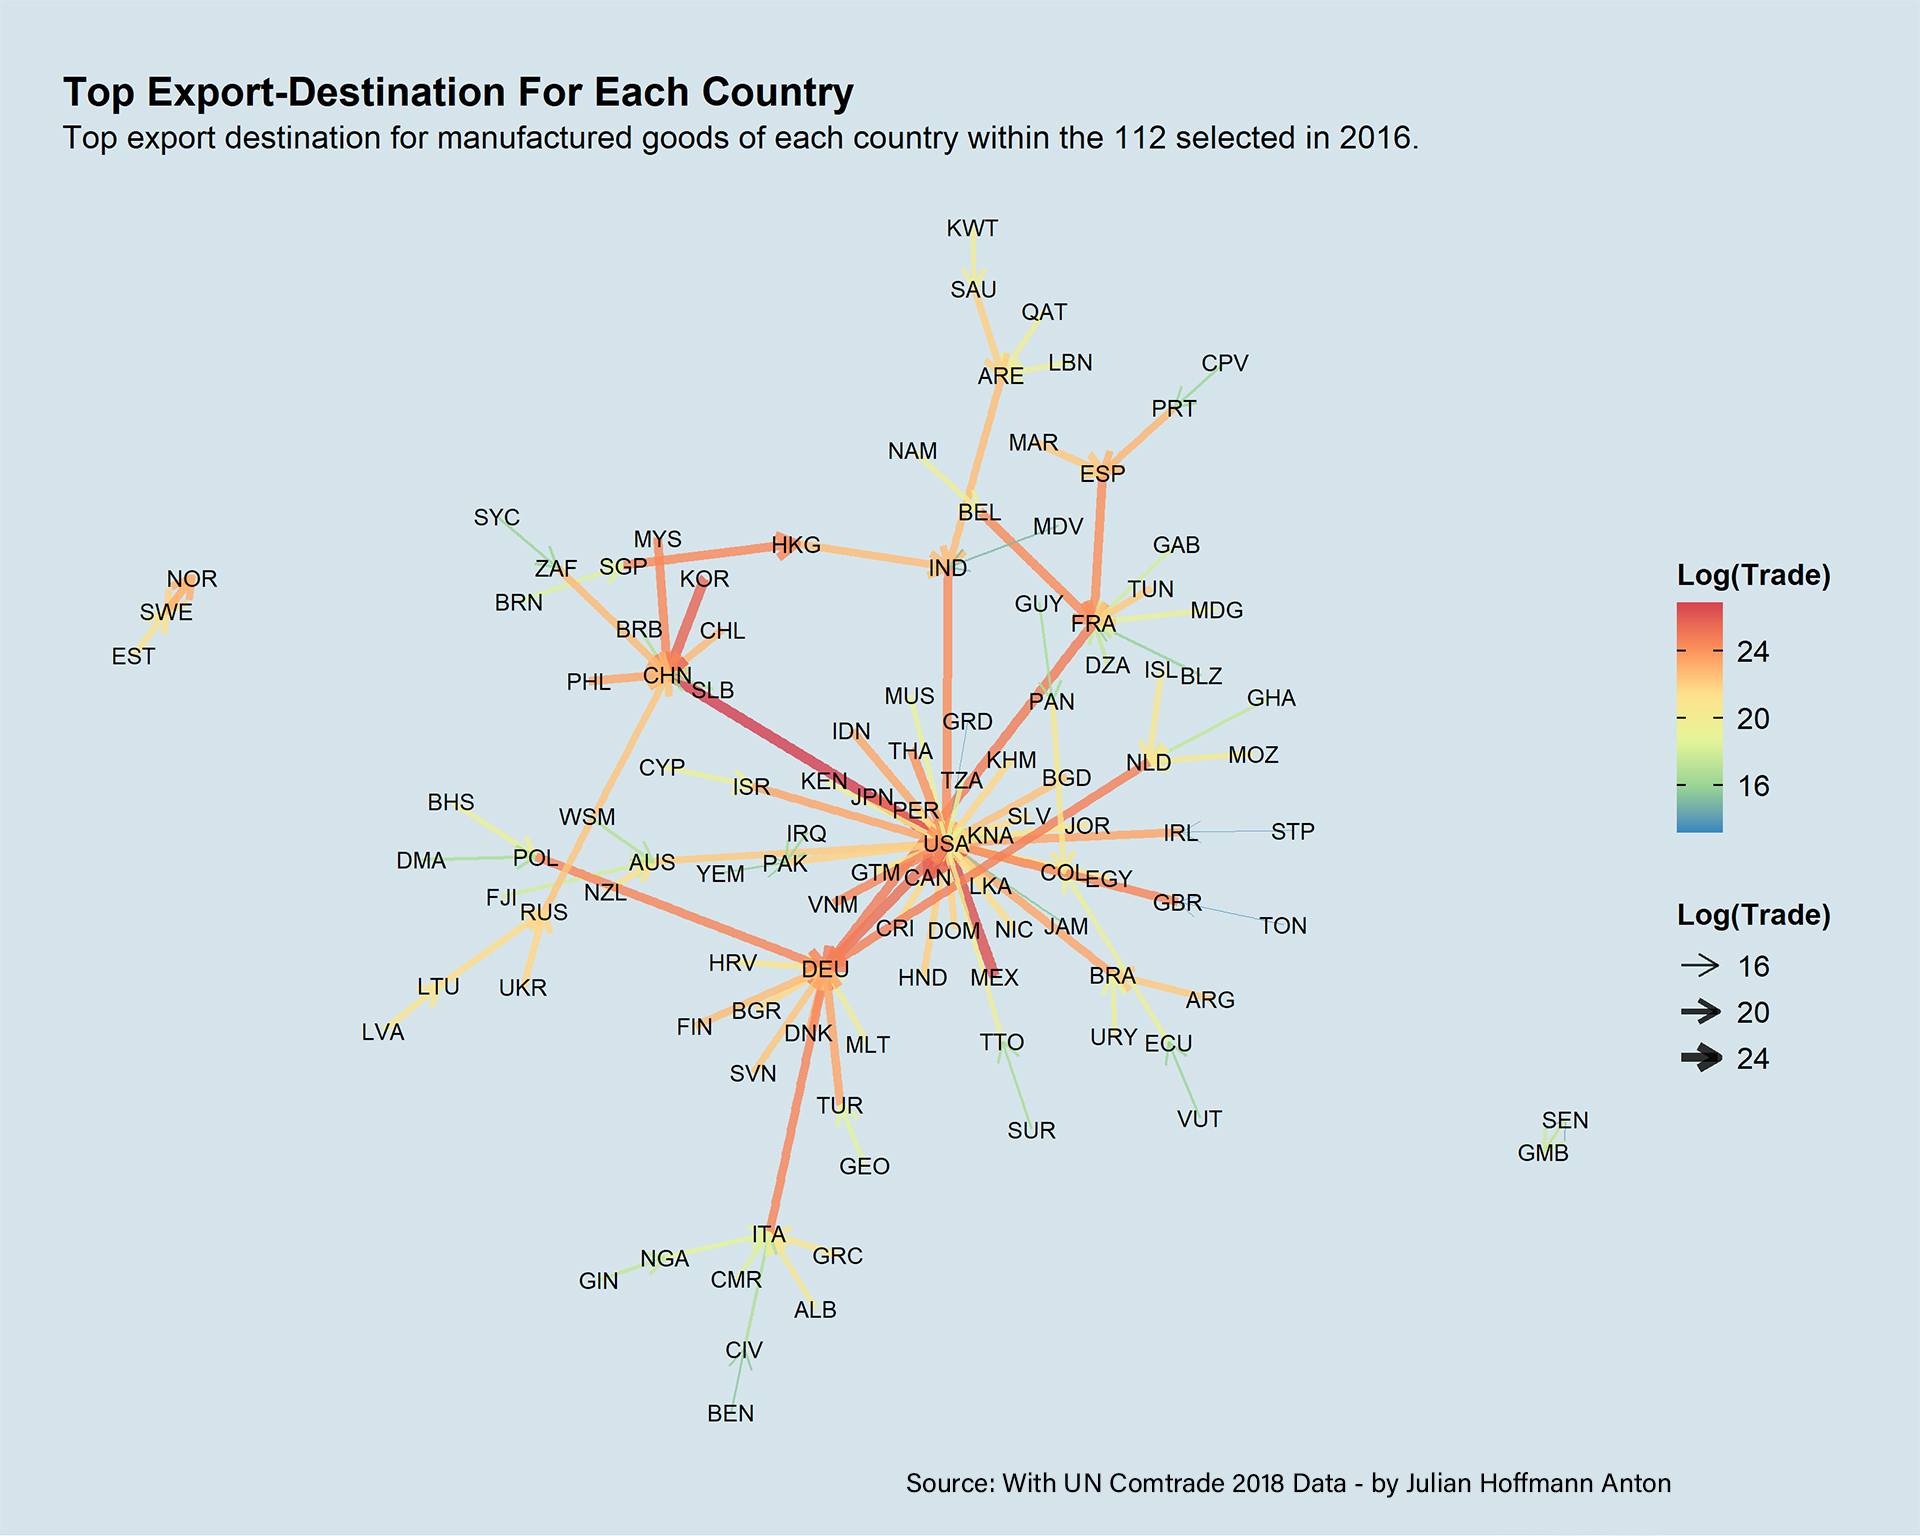
Top Export-Destinations
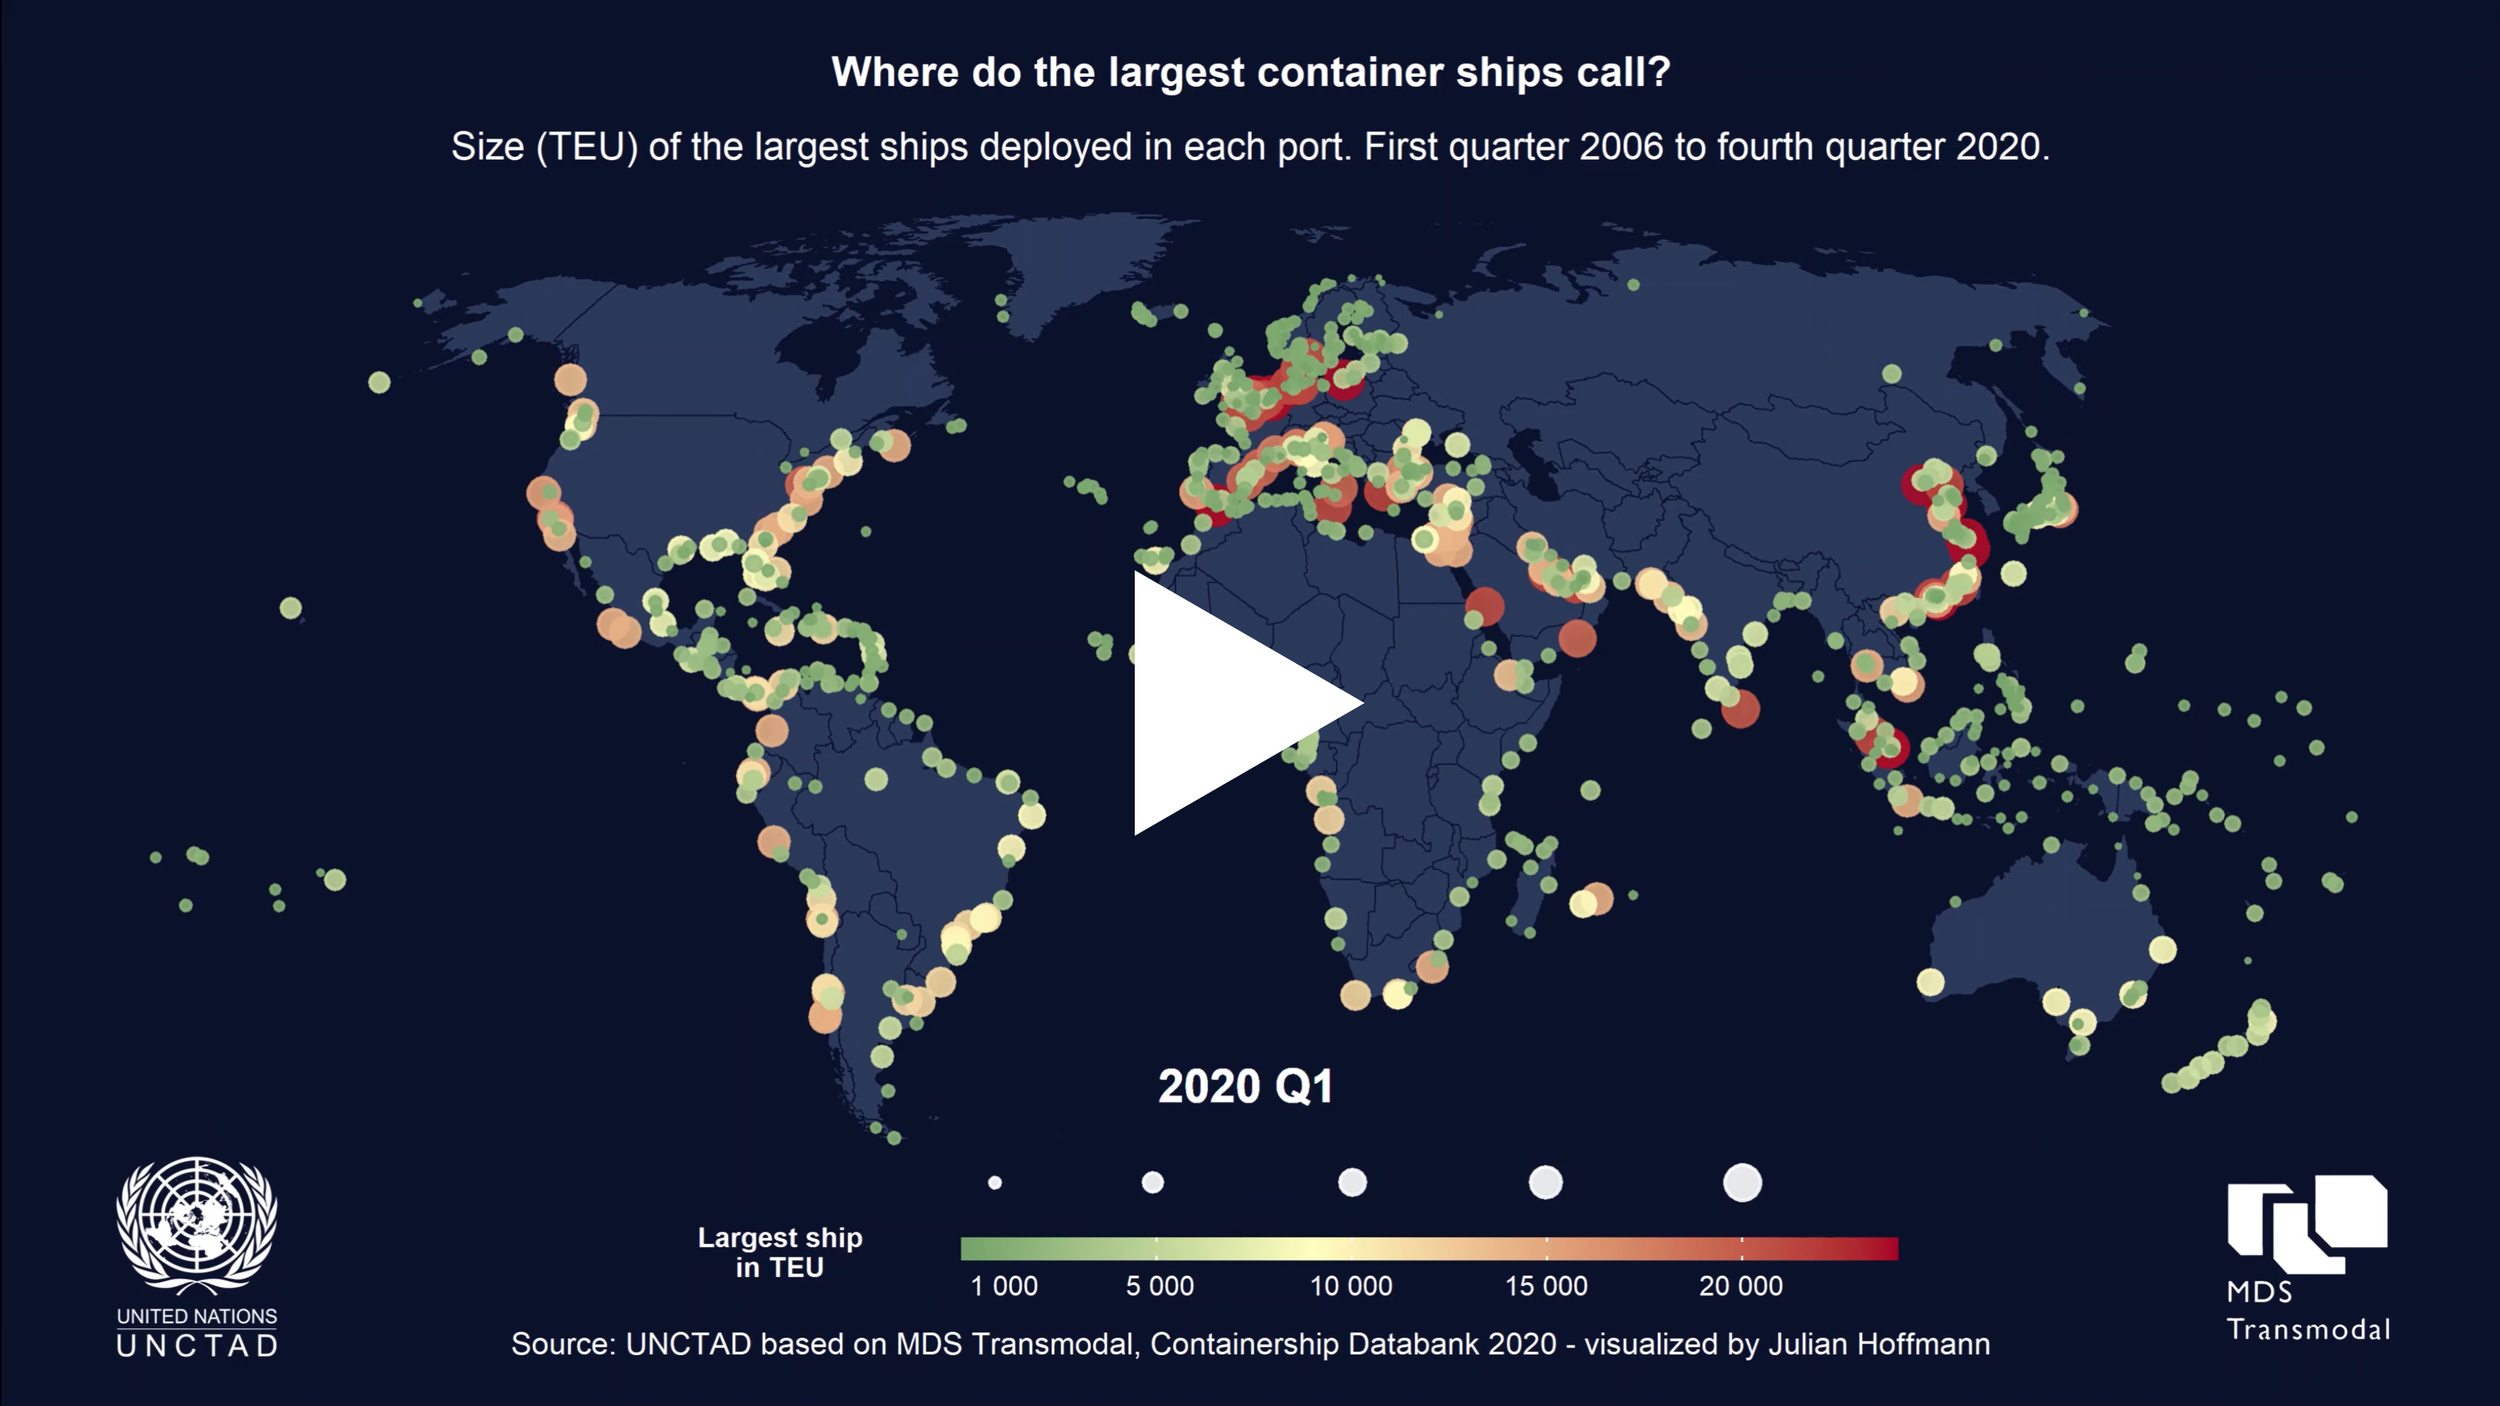
Map: Size (TEU) of the largest container ship deployed
Spatial Memories I.
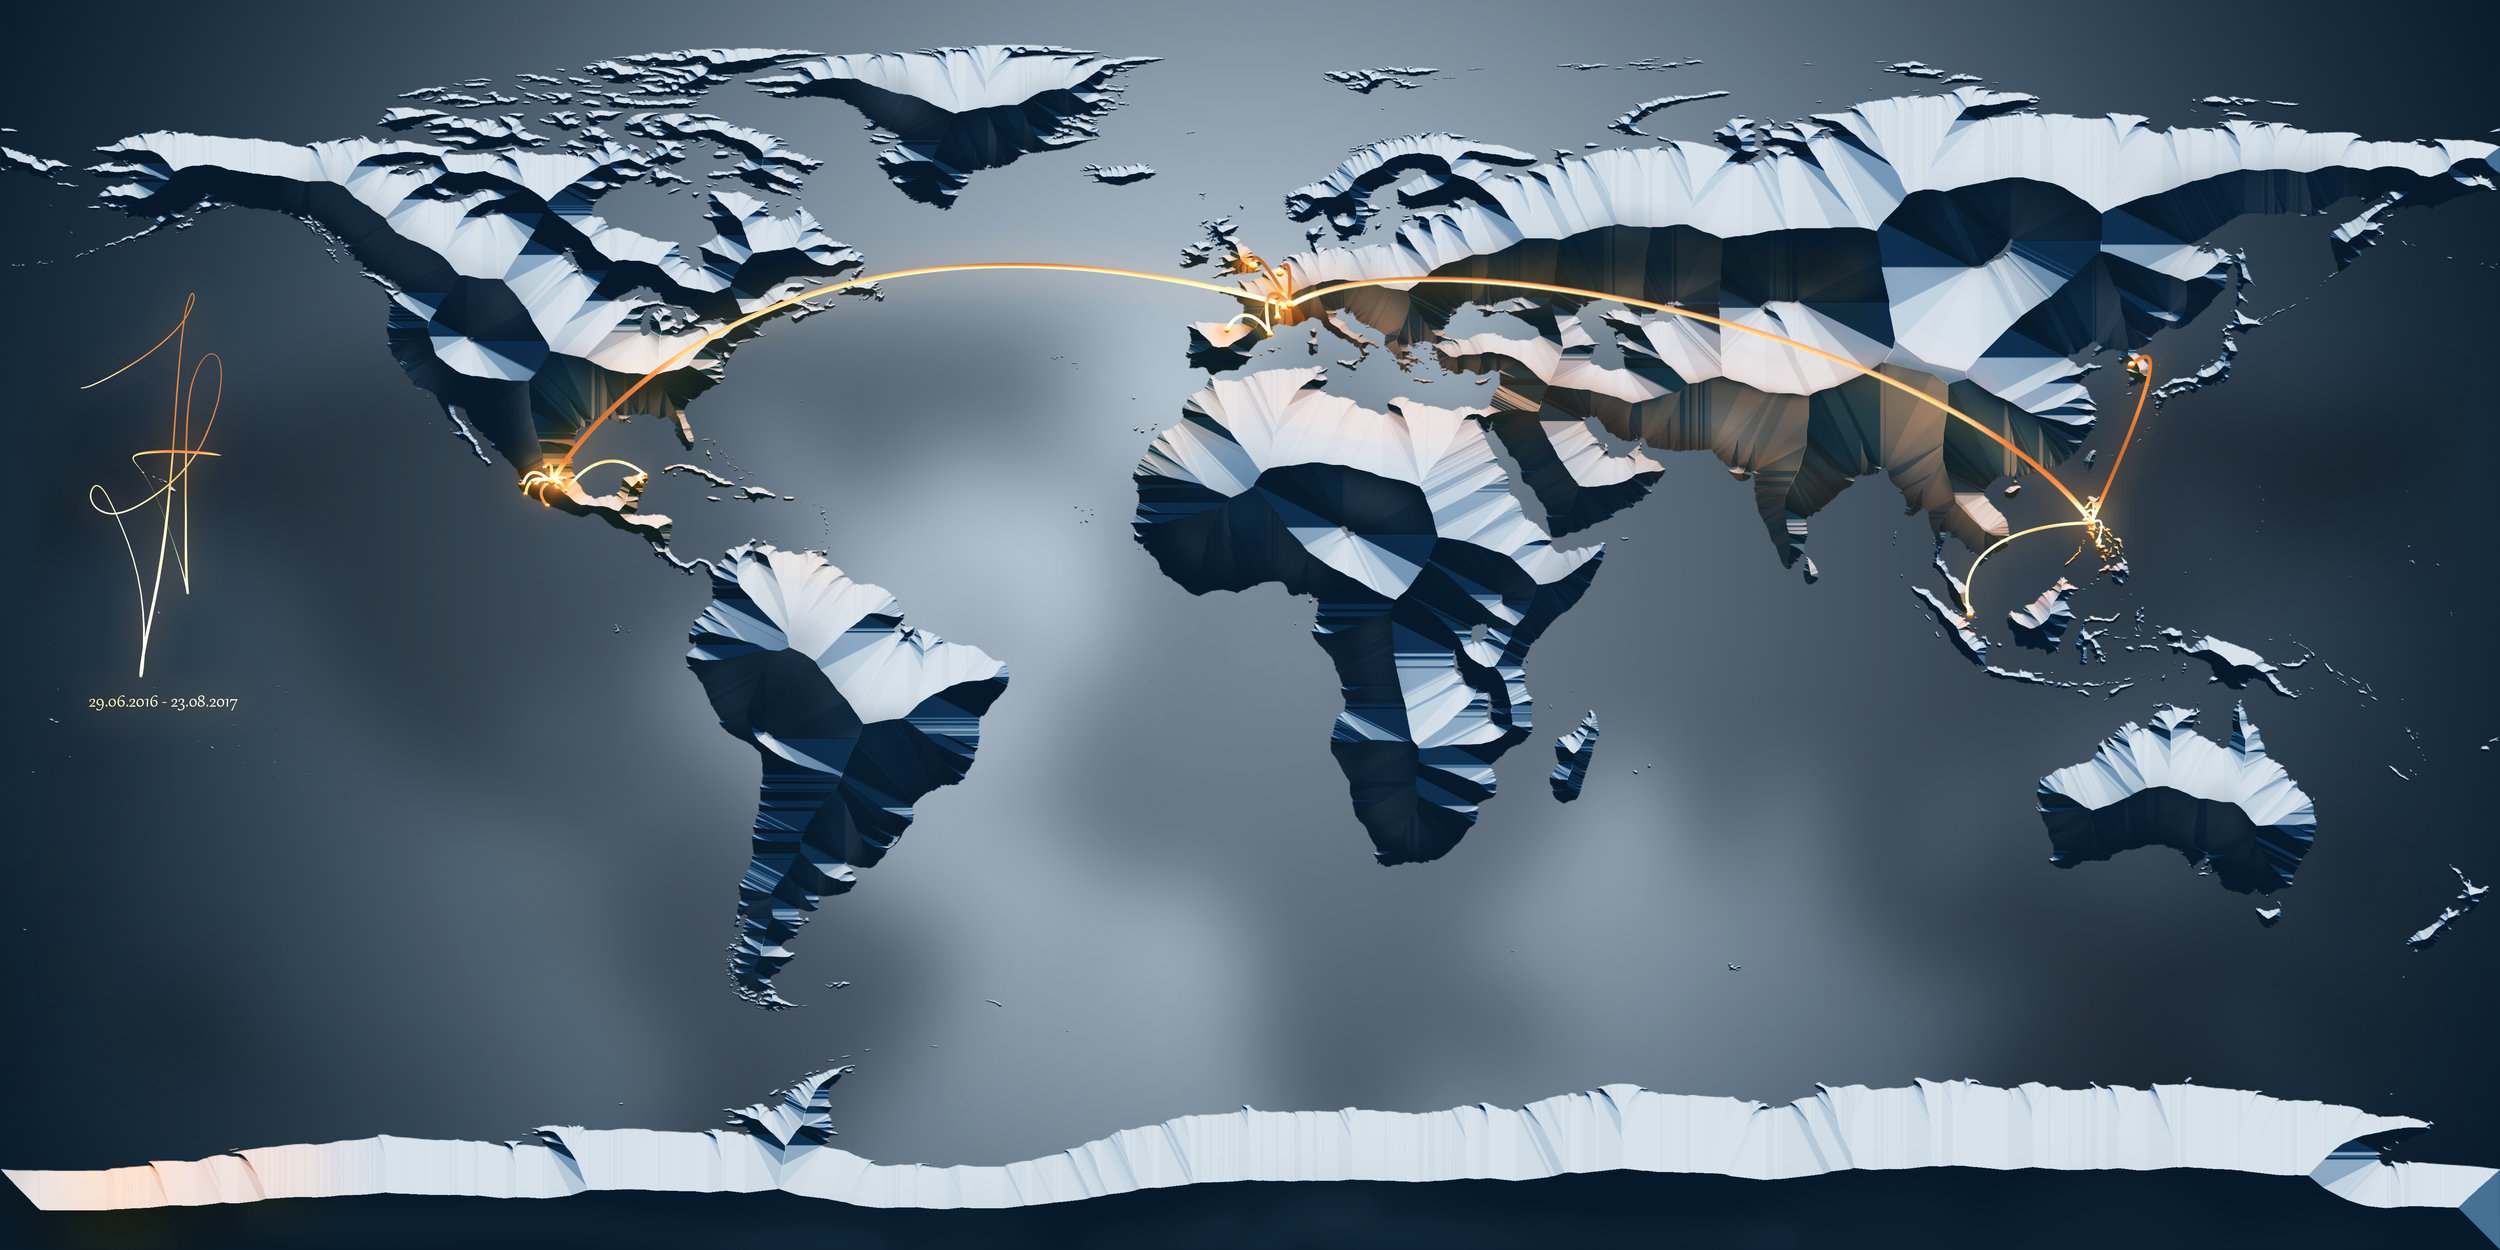
One Year Journey
Manufactured Goods II
Life is a maze
Africa Dimensions
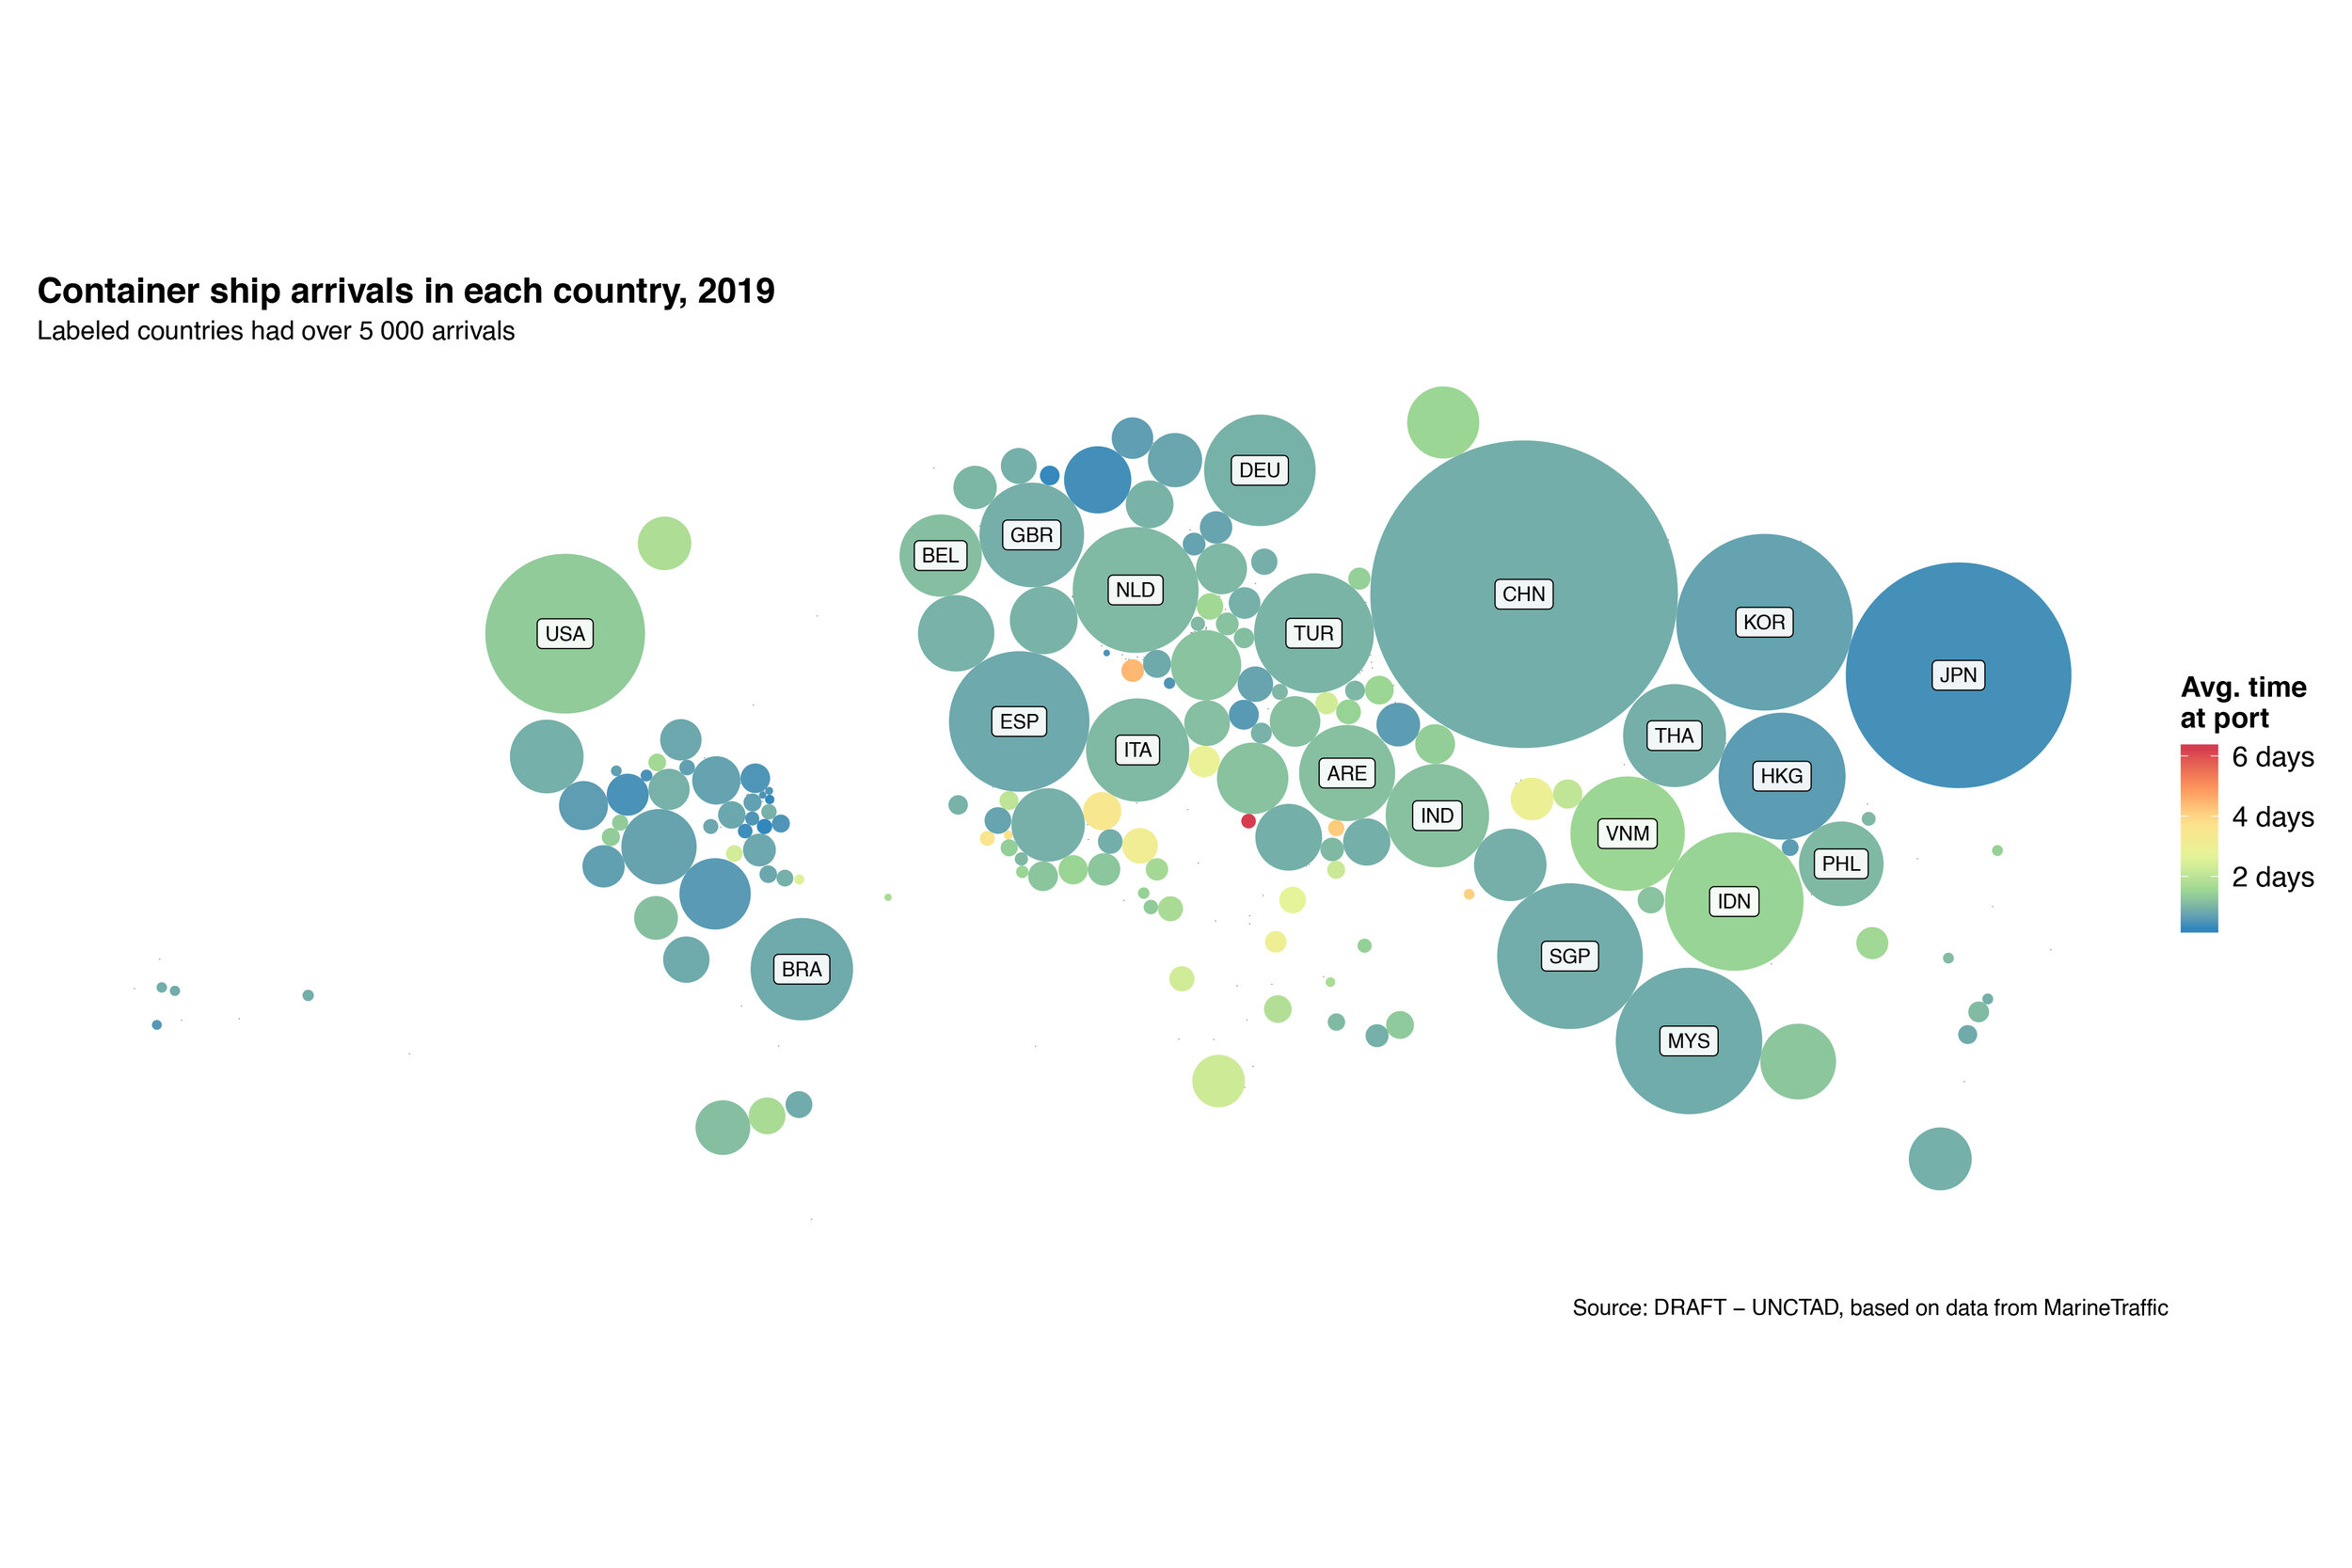
Cartogram Ship Arrivals and Days
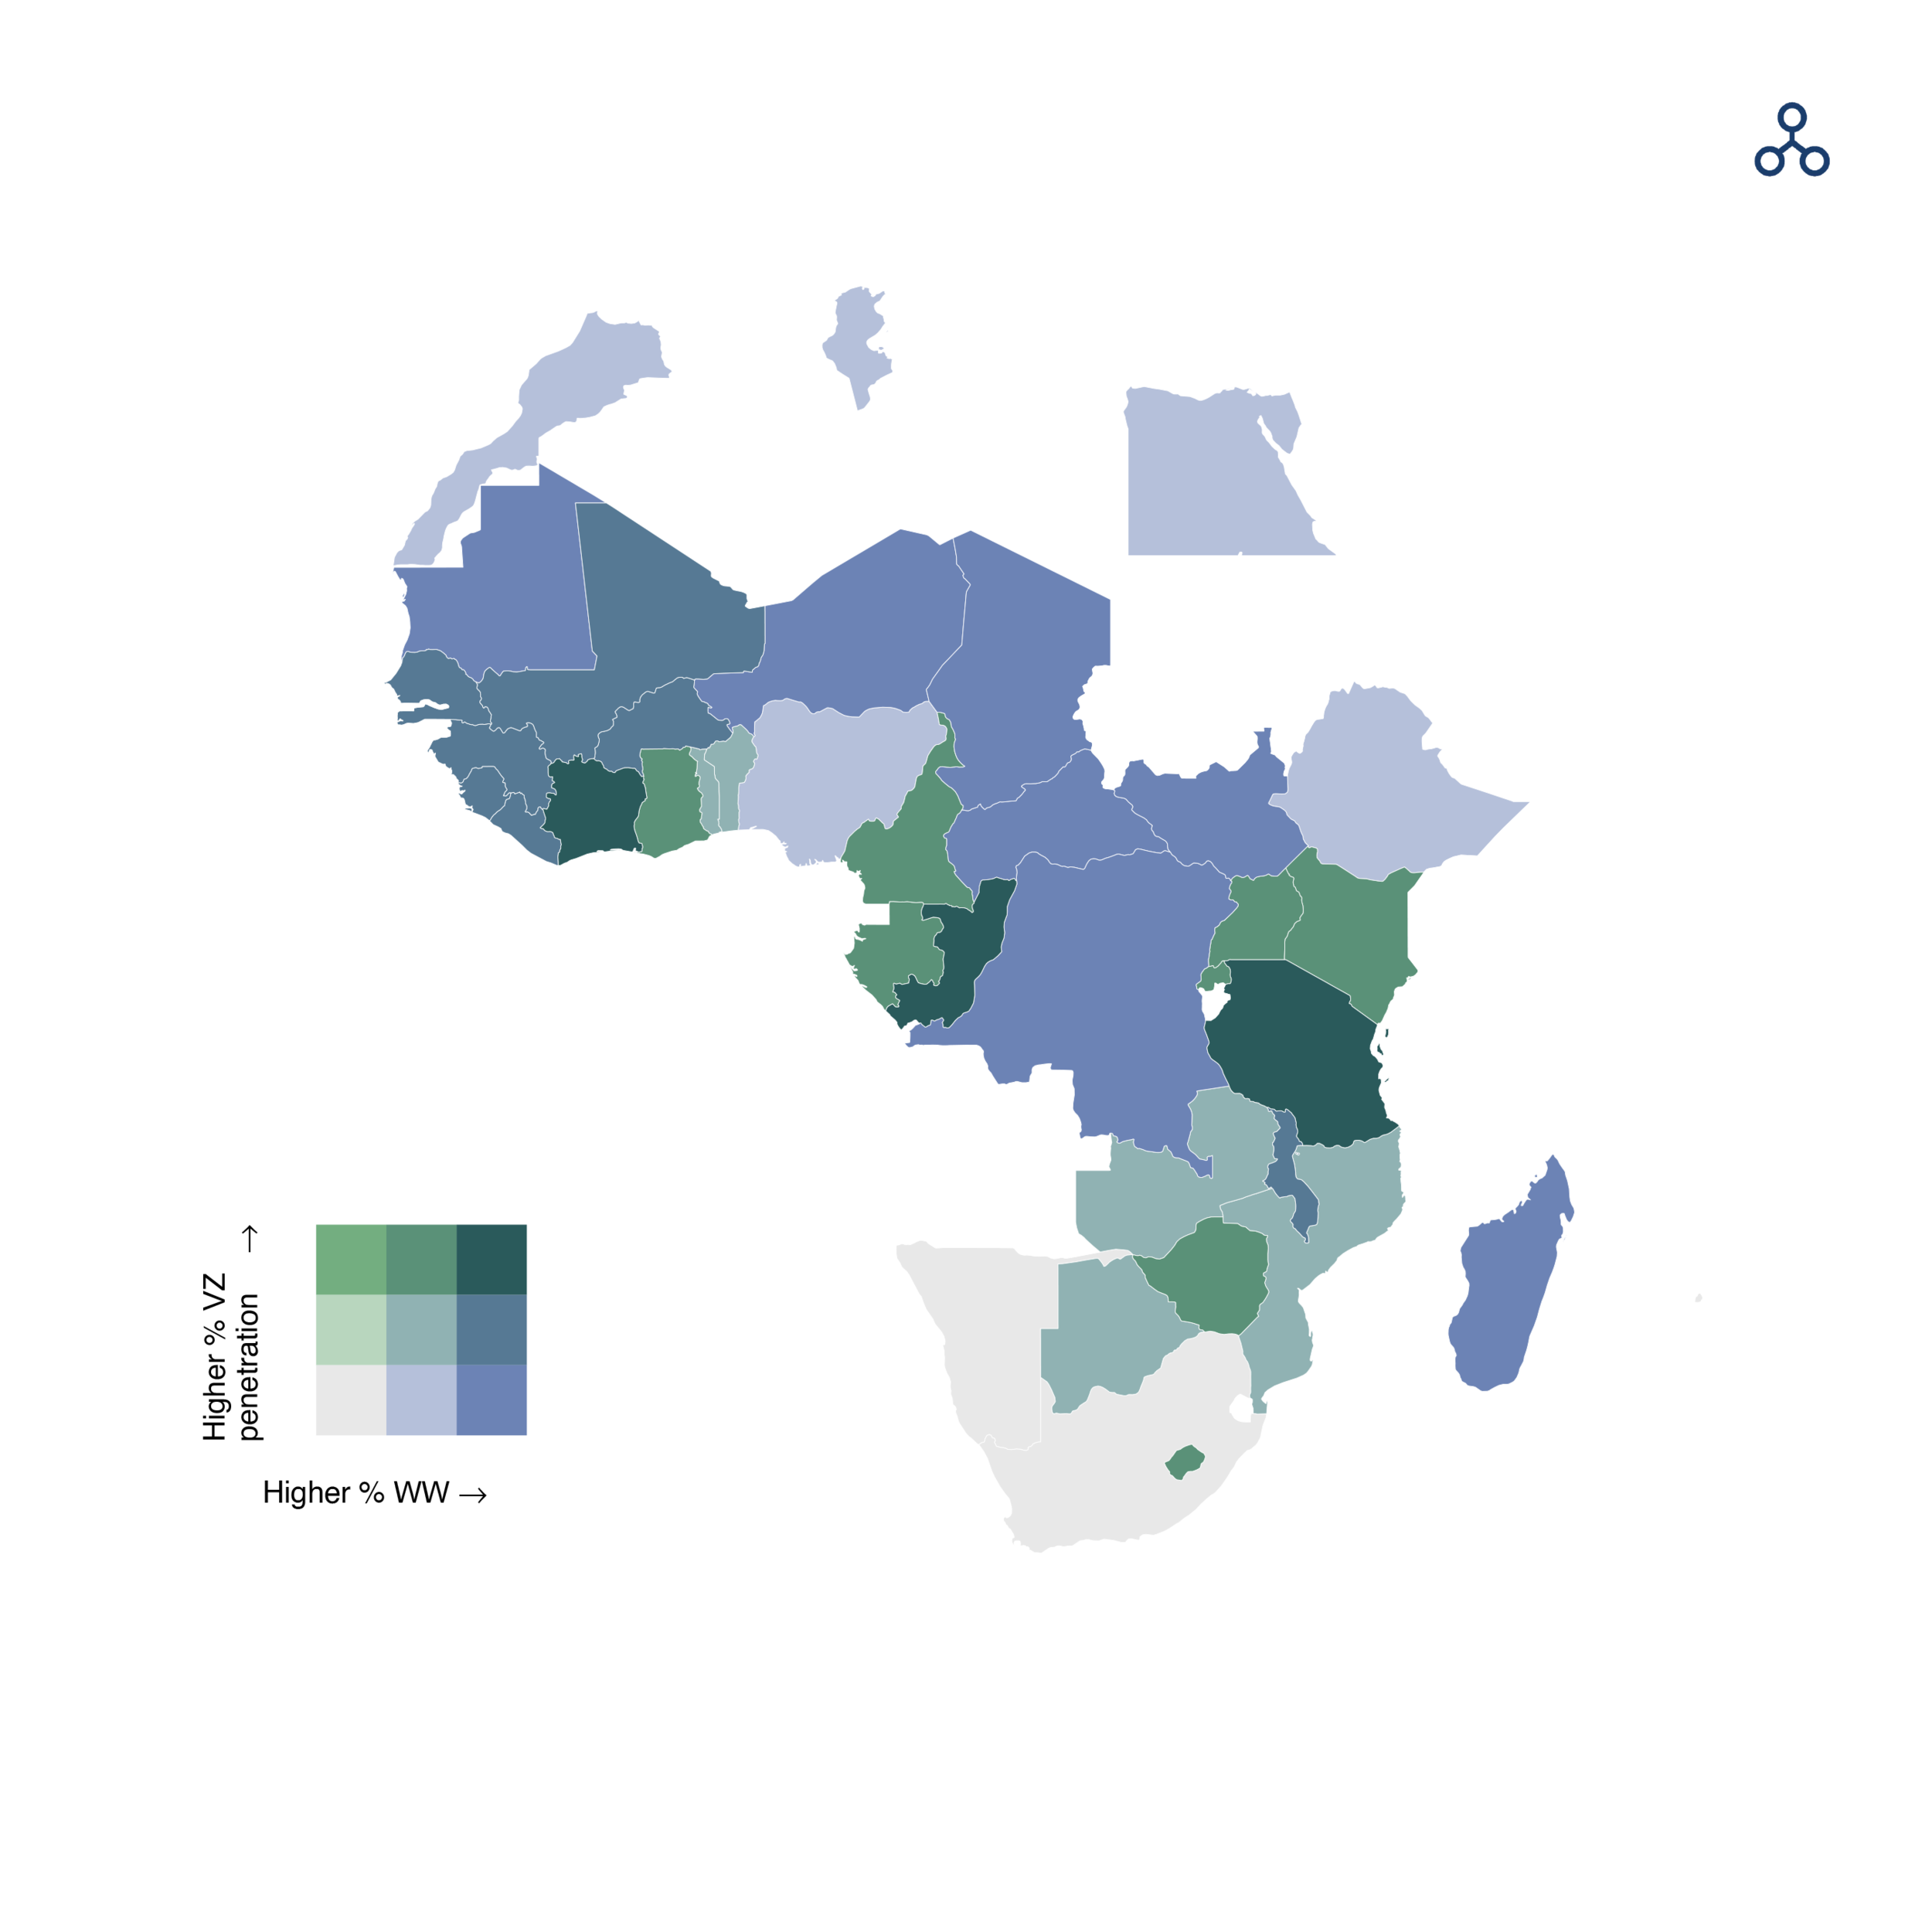
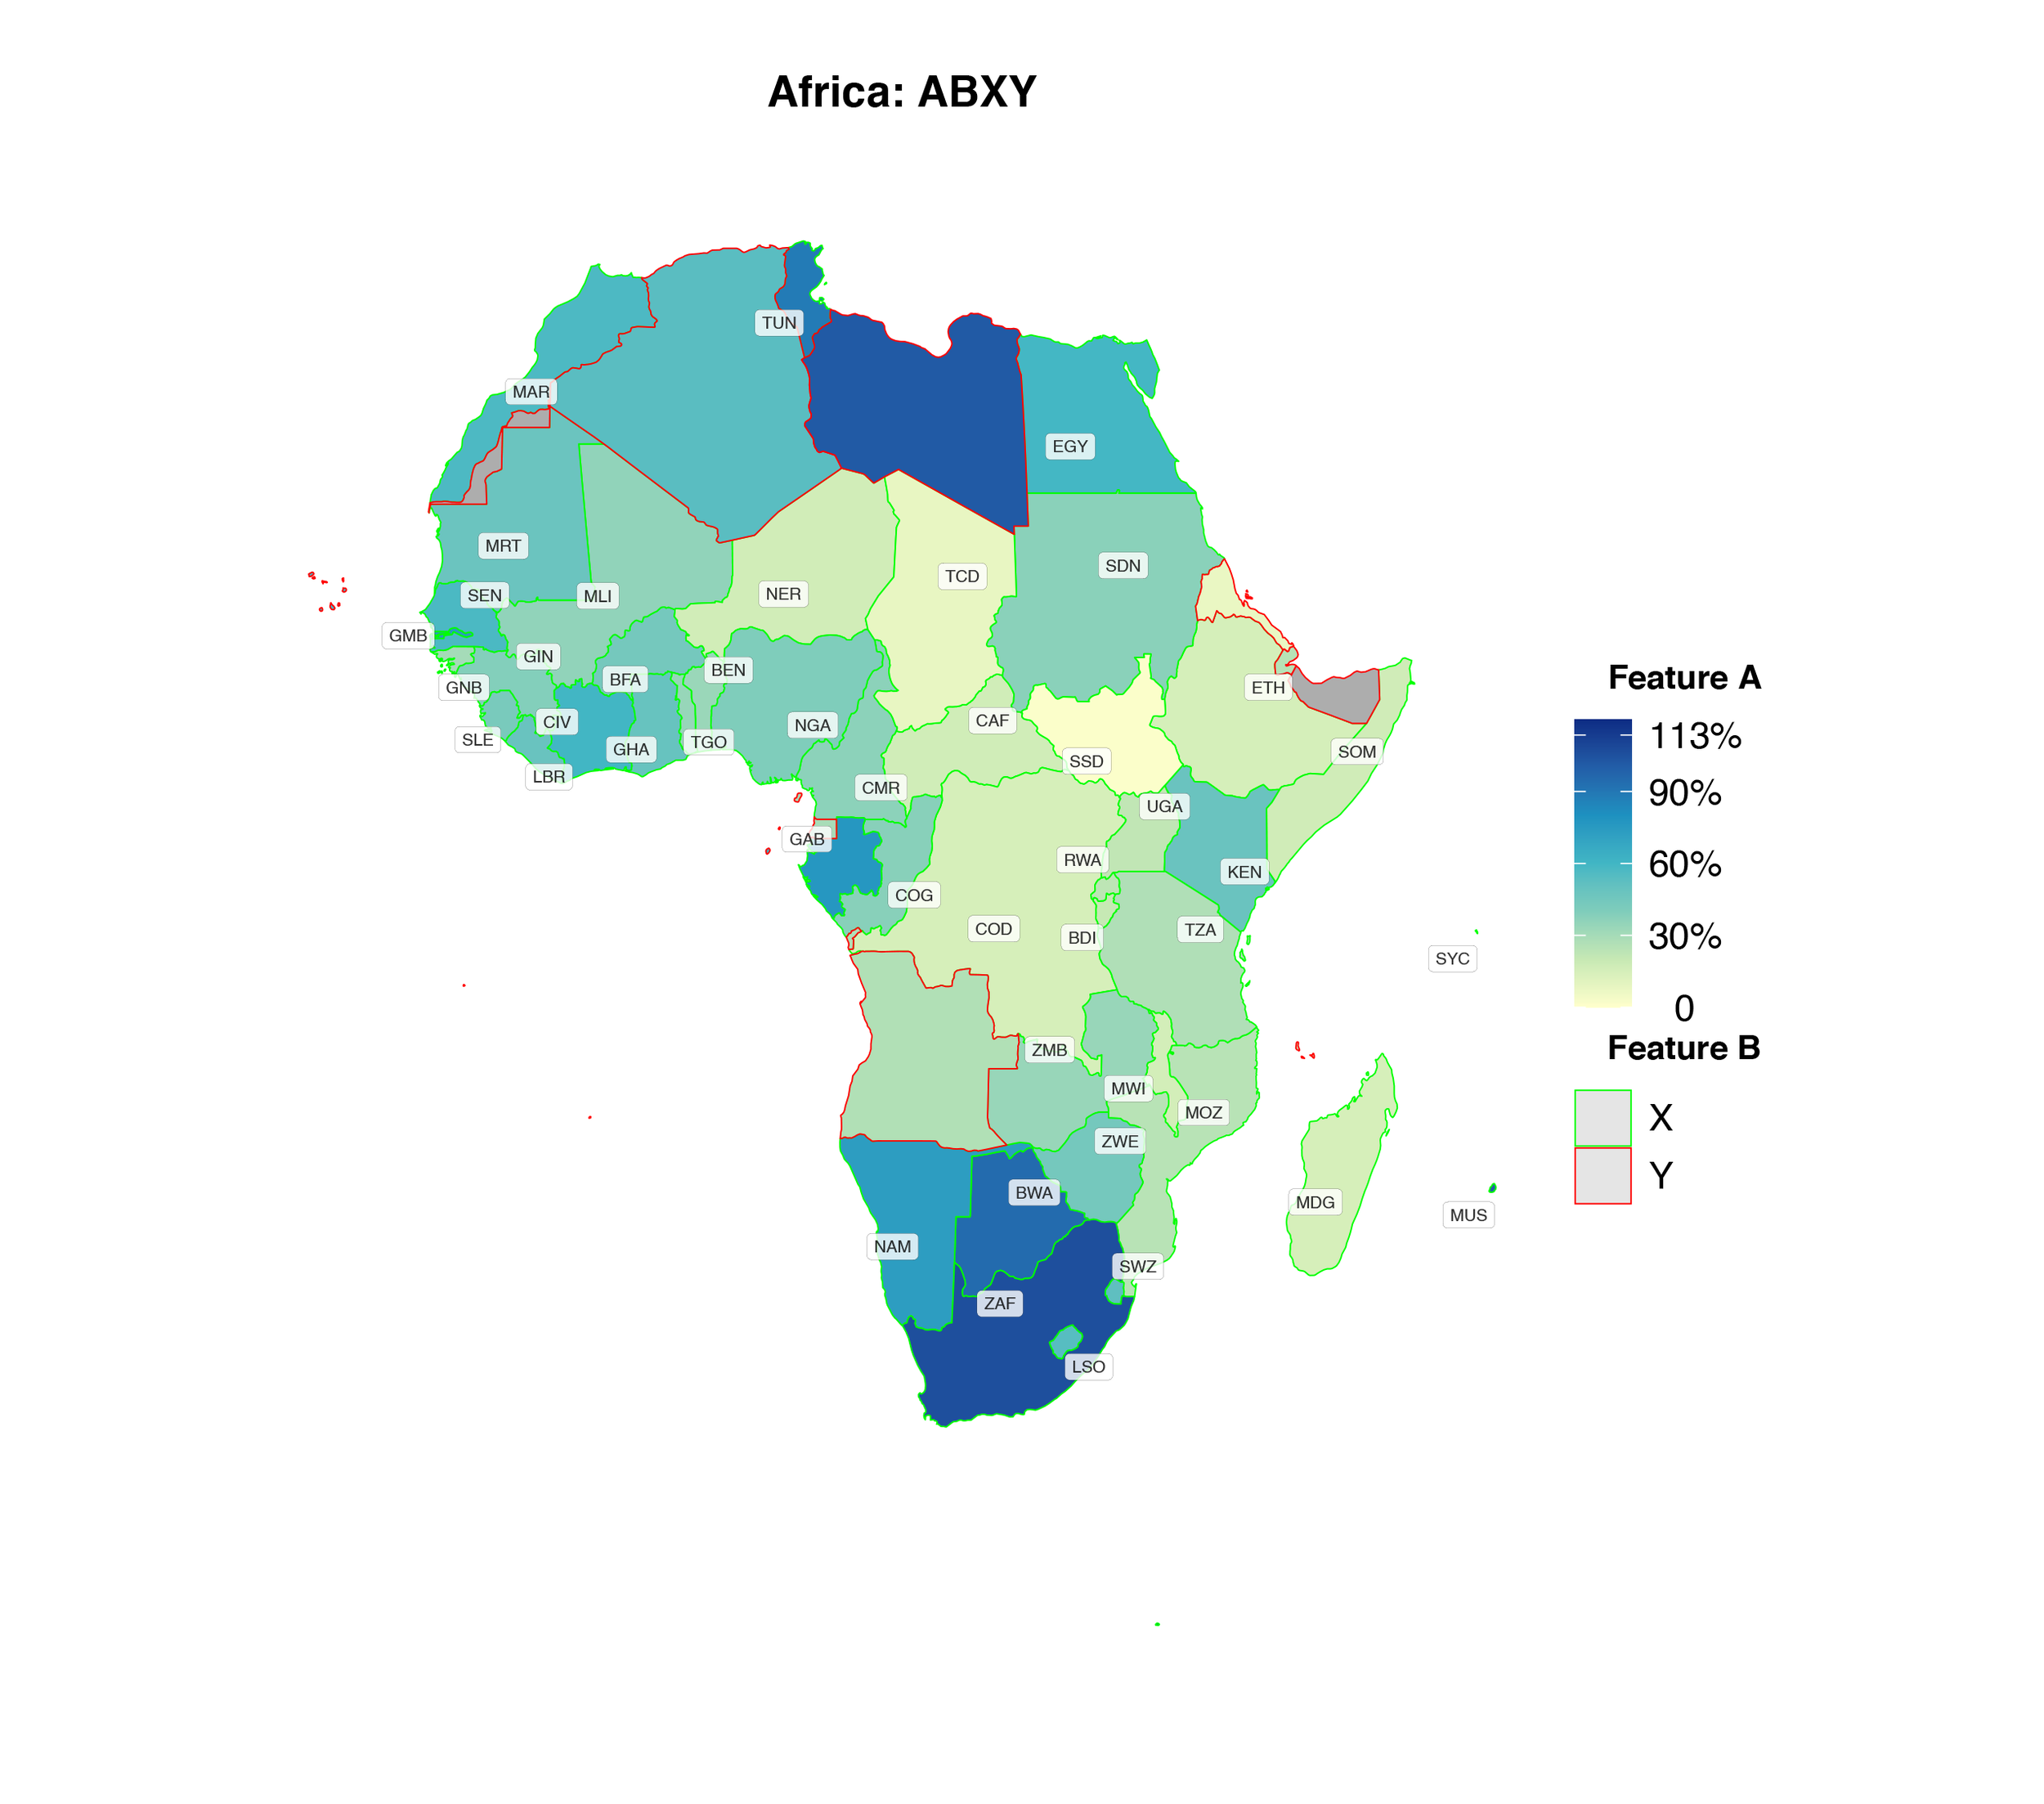
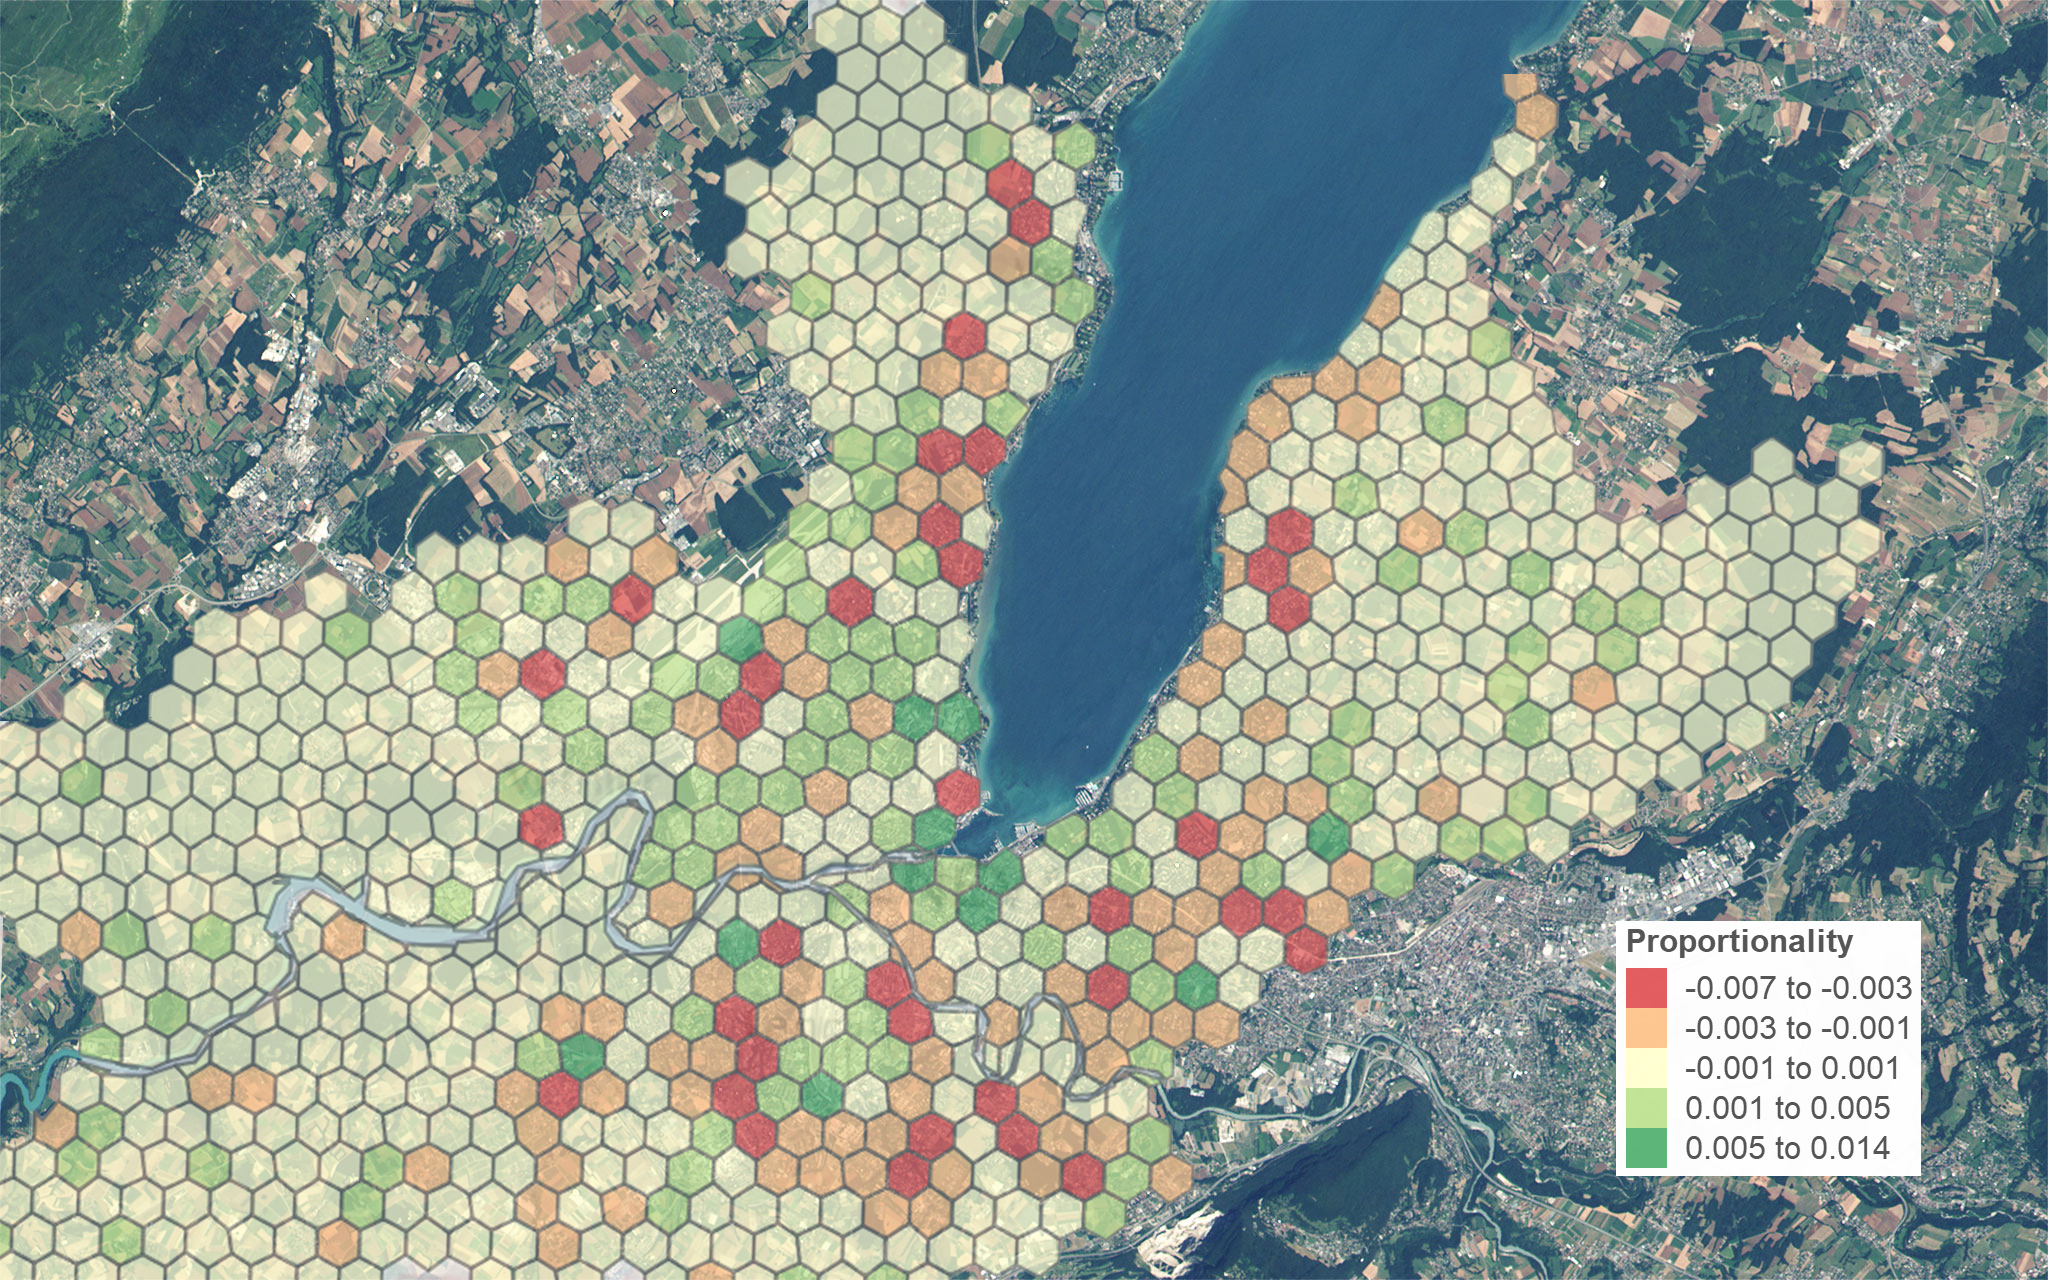
Bivariate Maps
Manufactured Goods I
Public Transport Stop Density
Mont Blanc - Top View
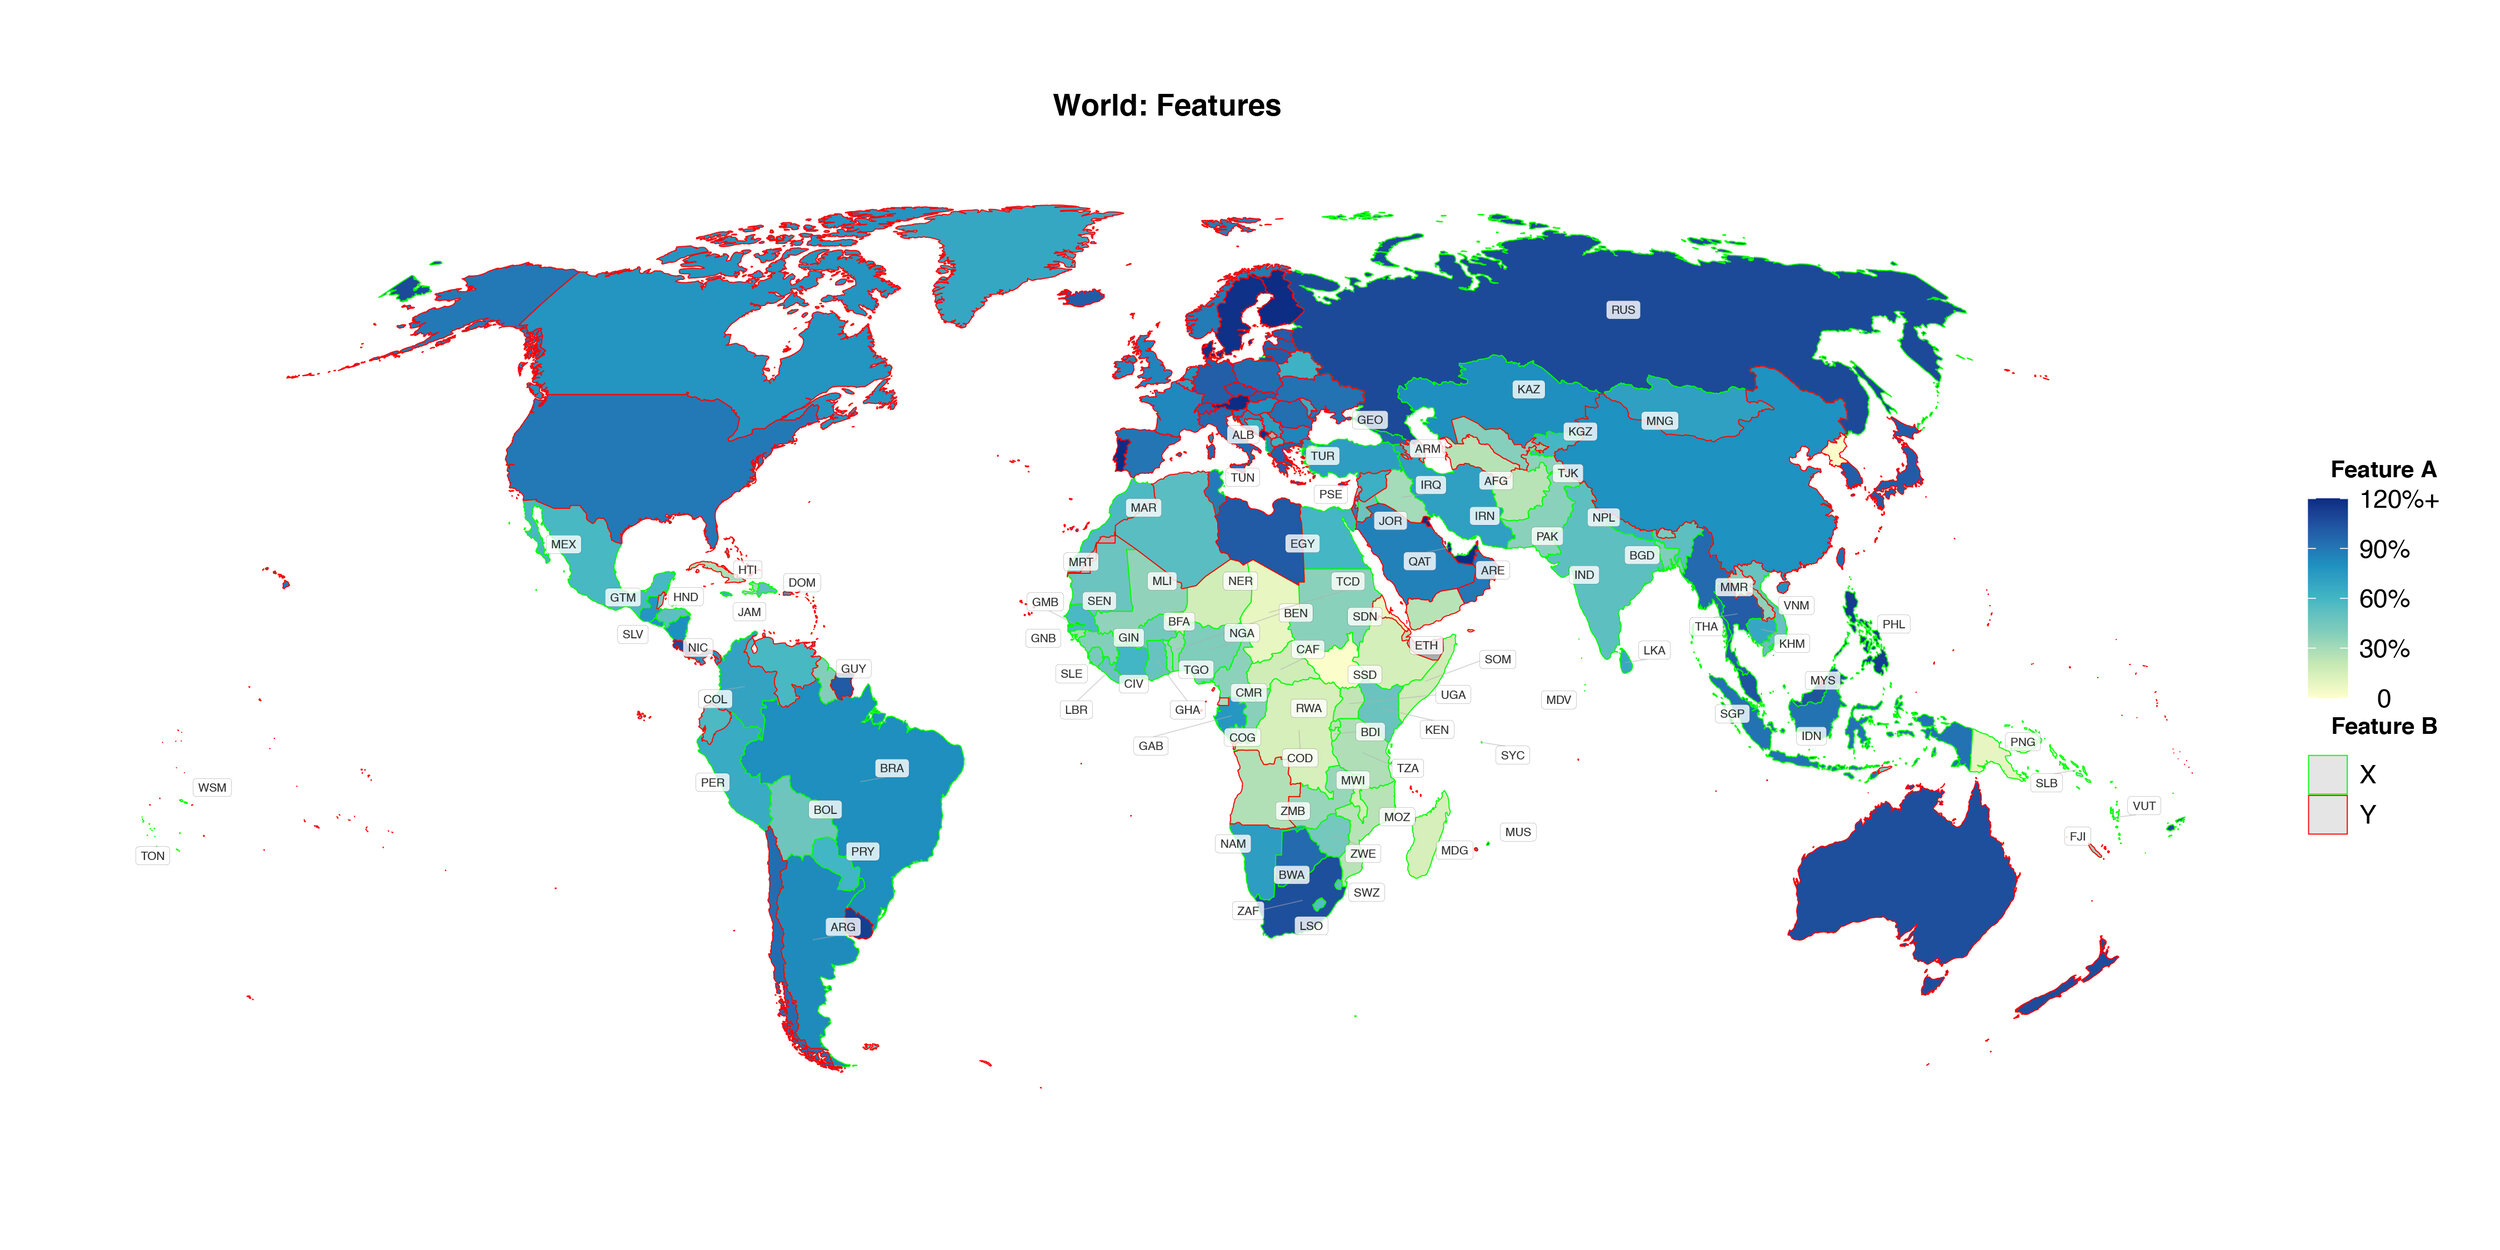
World map features A and B
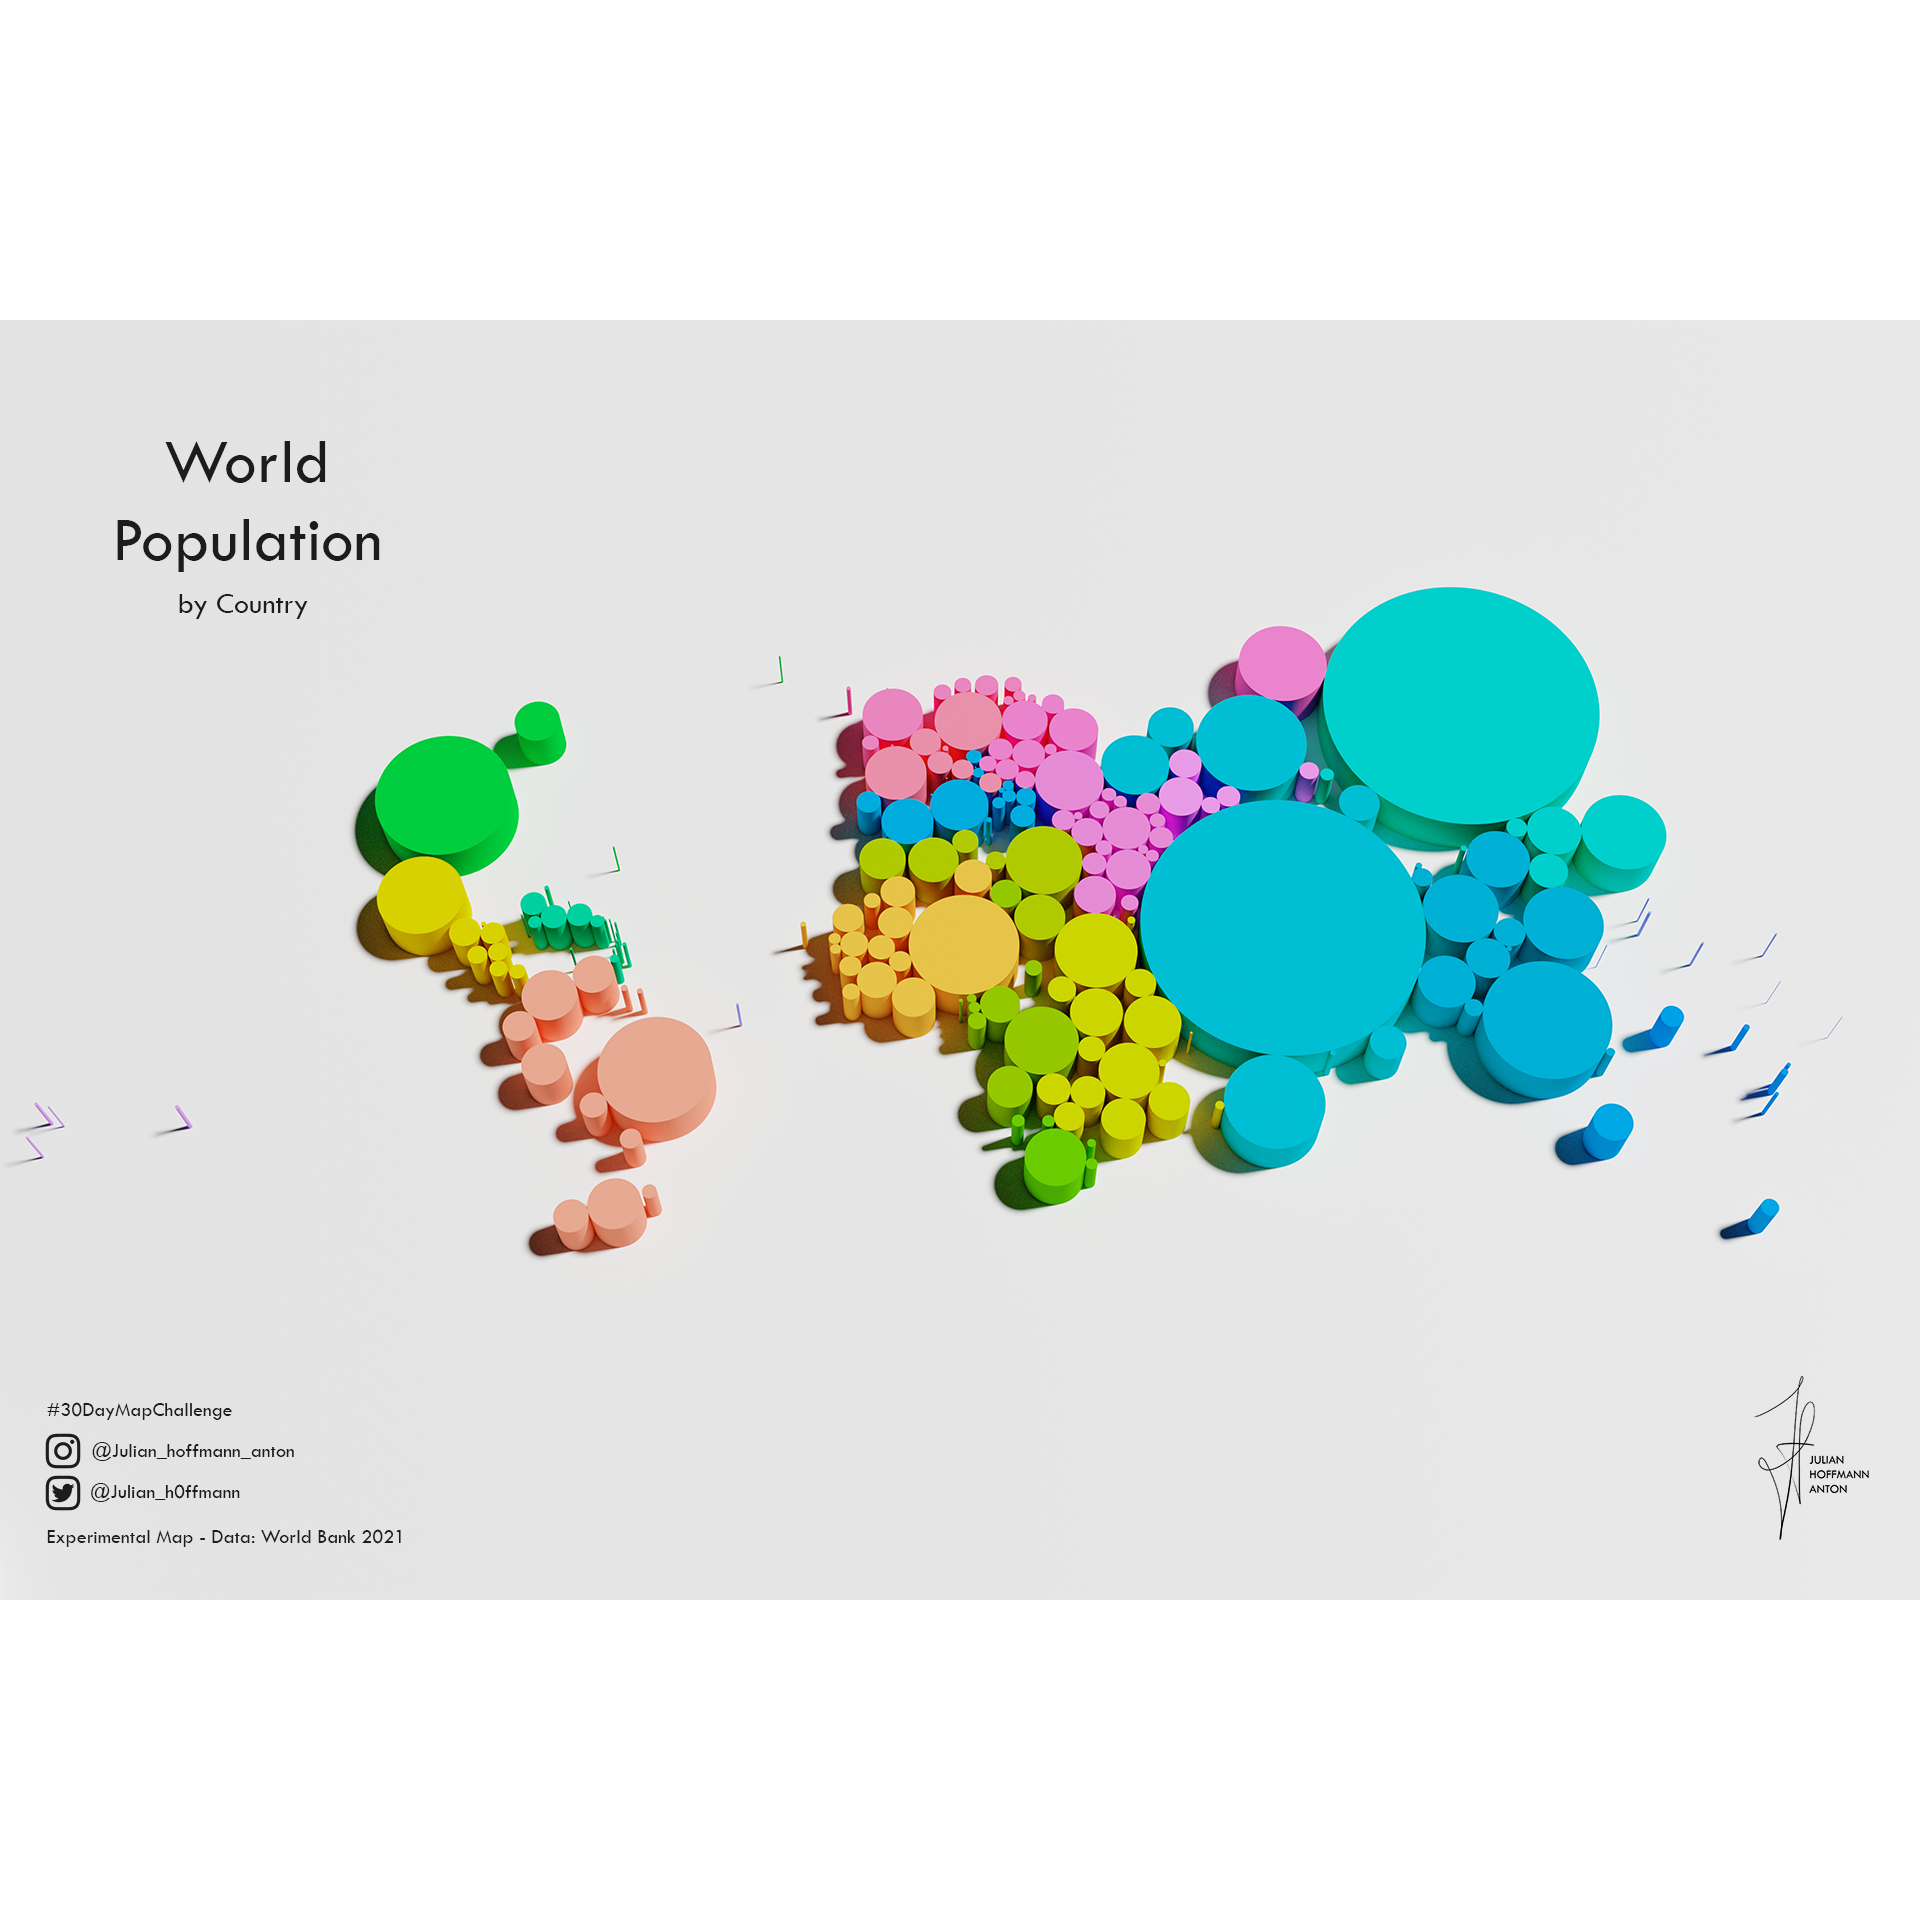
World Population
Transport Weak Spot Estimator

Mind-bending 3D Maps | ShowreelShowreel of Julian Hoffmann Anton's visual work! Let's bring your insights to life! Contact for collaborations: https://www.julian-hoffmann-anton.com/ Visuals made mainly with Blender, Photoshop and R.
A Clear View of Global Shipping TrafficGlobal Shipping Traffic Density : this is an experimental visualisation made in Blender with all observed ship movement from 2015-2020, at 500 m resolution from IMF's World Seaborne Trade Monitoring System & also NASA‘s Black Marble satellite imagery. As you can see, the oceans and seas are transparent, creating a unique view that includes the other side of the globe.
The Great Fire of London (1666)
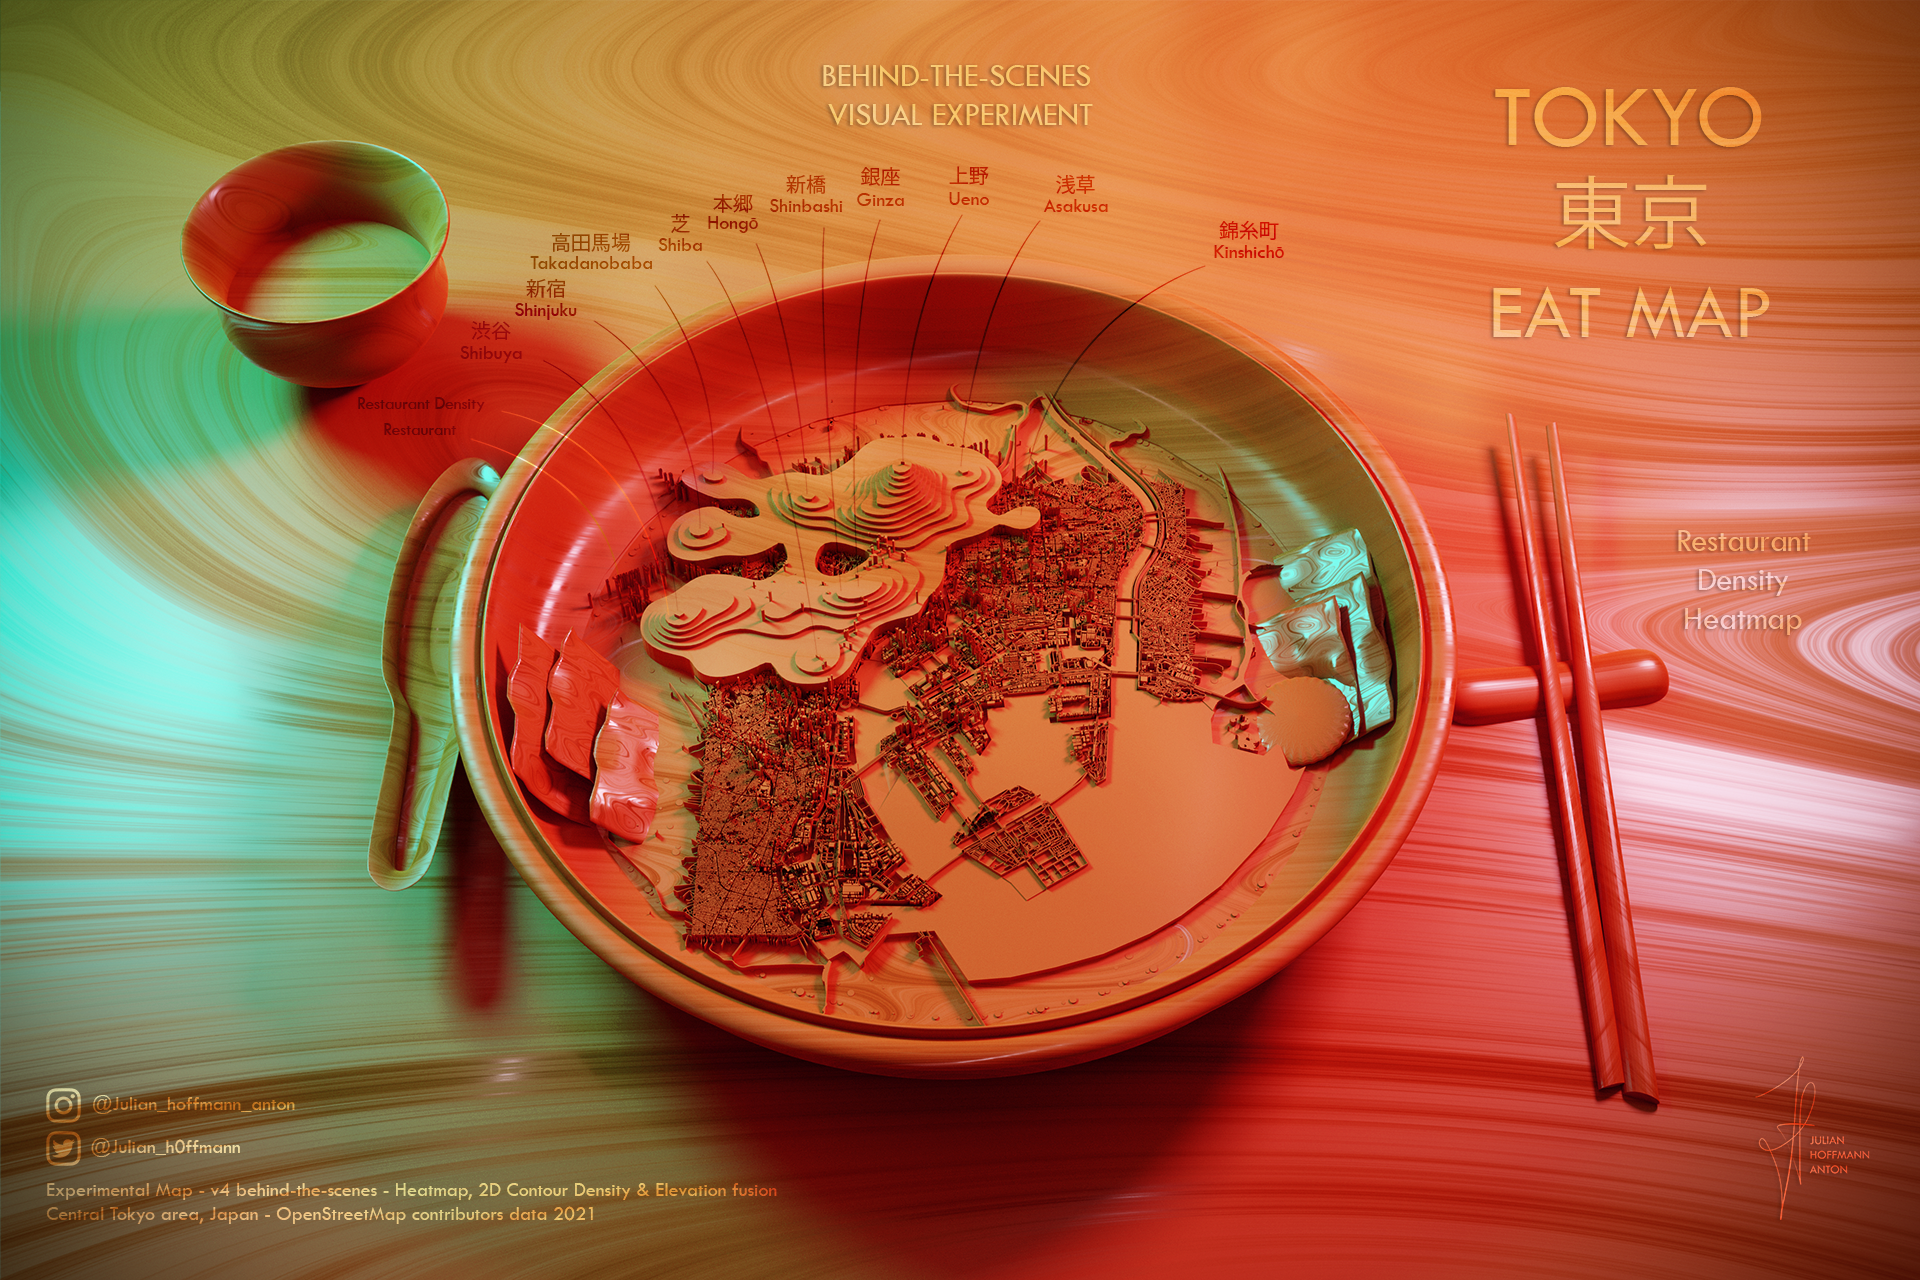
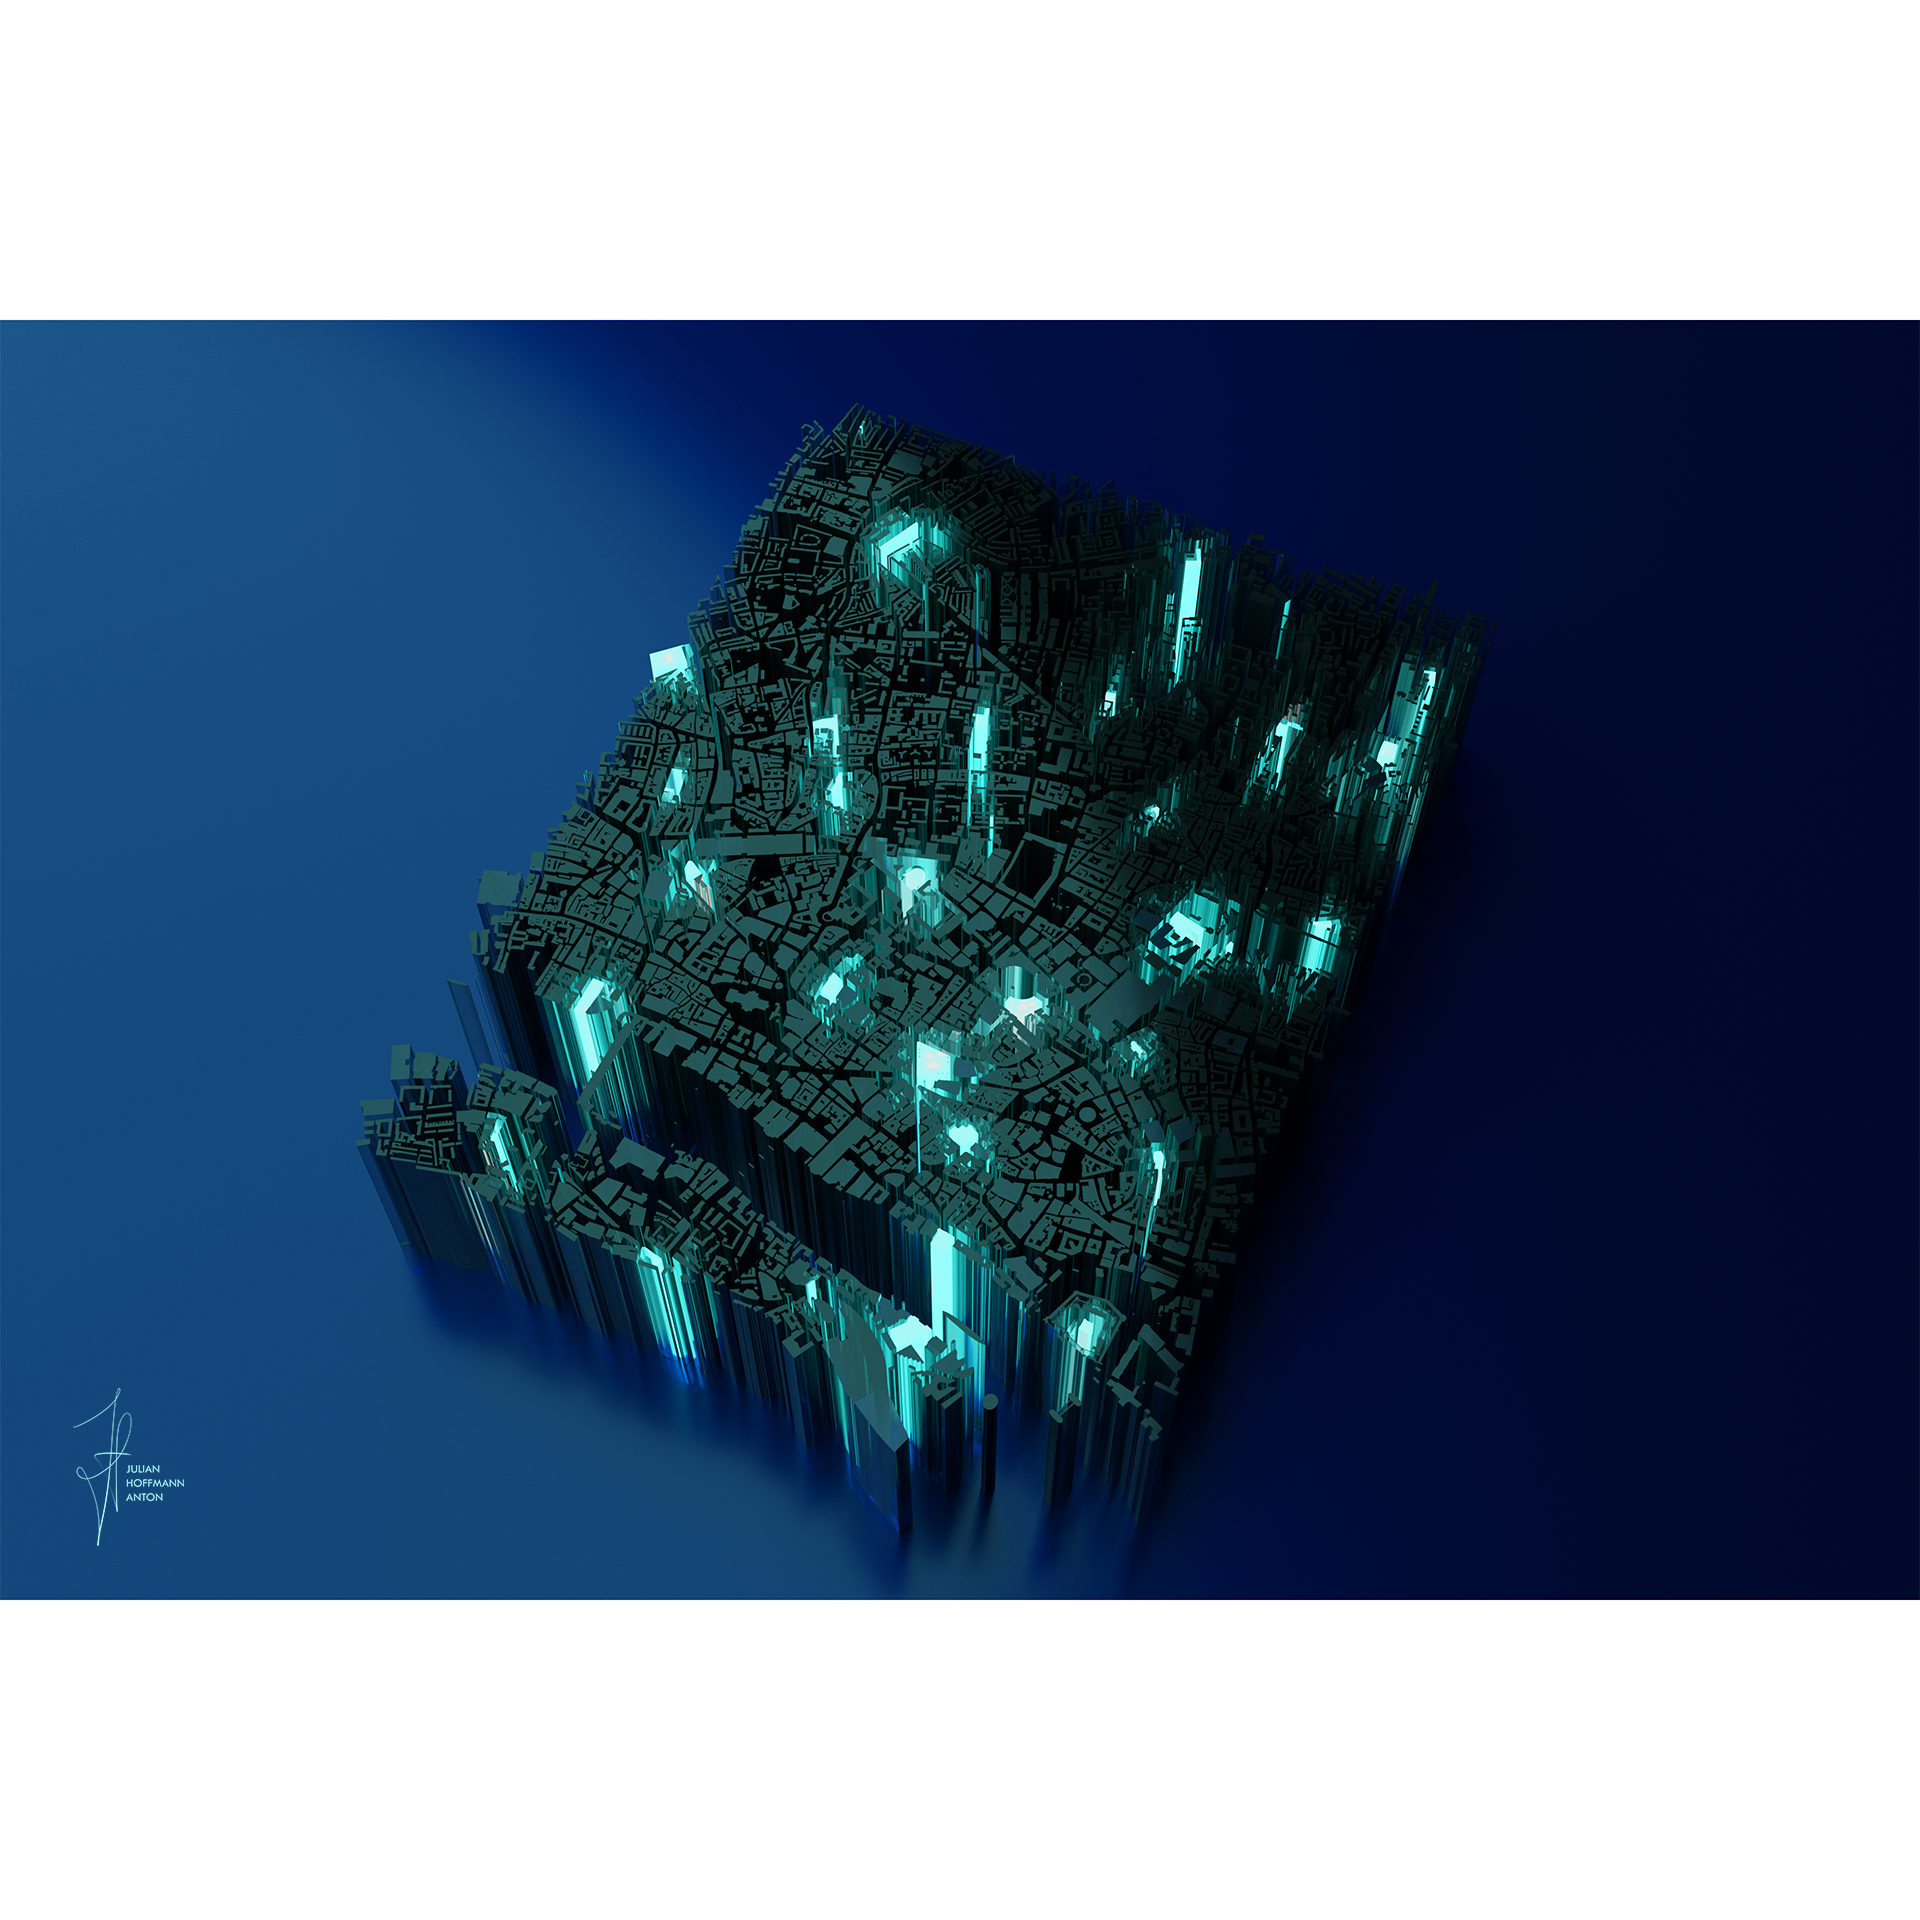
Tokyo Eat MapThe “Tokyo Eat Map” is an experimental data visualization in 3D with a “meta” reference to the data it displays. It represents the density of restaurants in central Tokyo on a map, morphed into a typical Japanese ramen dish. It is a mix of a heatmap, density map and contour visualization, embellished with artistic liberties. I see it as a simple story of finding the right ramen restaurant within Tokyo’s culinary hotspots, and dreaming the delicious dish as a map or vice versa, the map as a dish. The data is freely available from OpenStreetMap’s points of interest, specifically places labelled as “Restaurant”. The first version which I have been enriching since was made as part of an online creative mapping challenge: 30DayMapChallenge November 2021. All made with open-source programmatical GIS tools in R, then modelled in Blender, an open-source 3D visual effects software, and finally edited and labelled in Photoshop for the final touch.
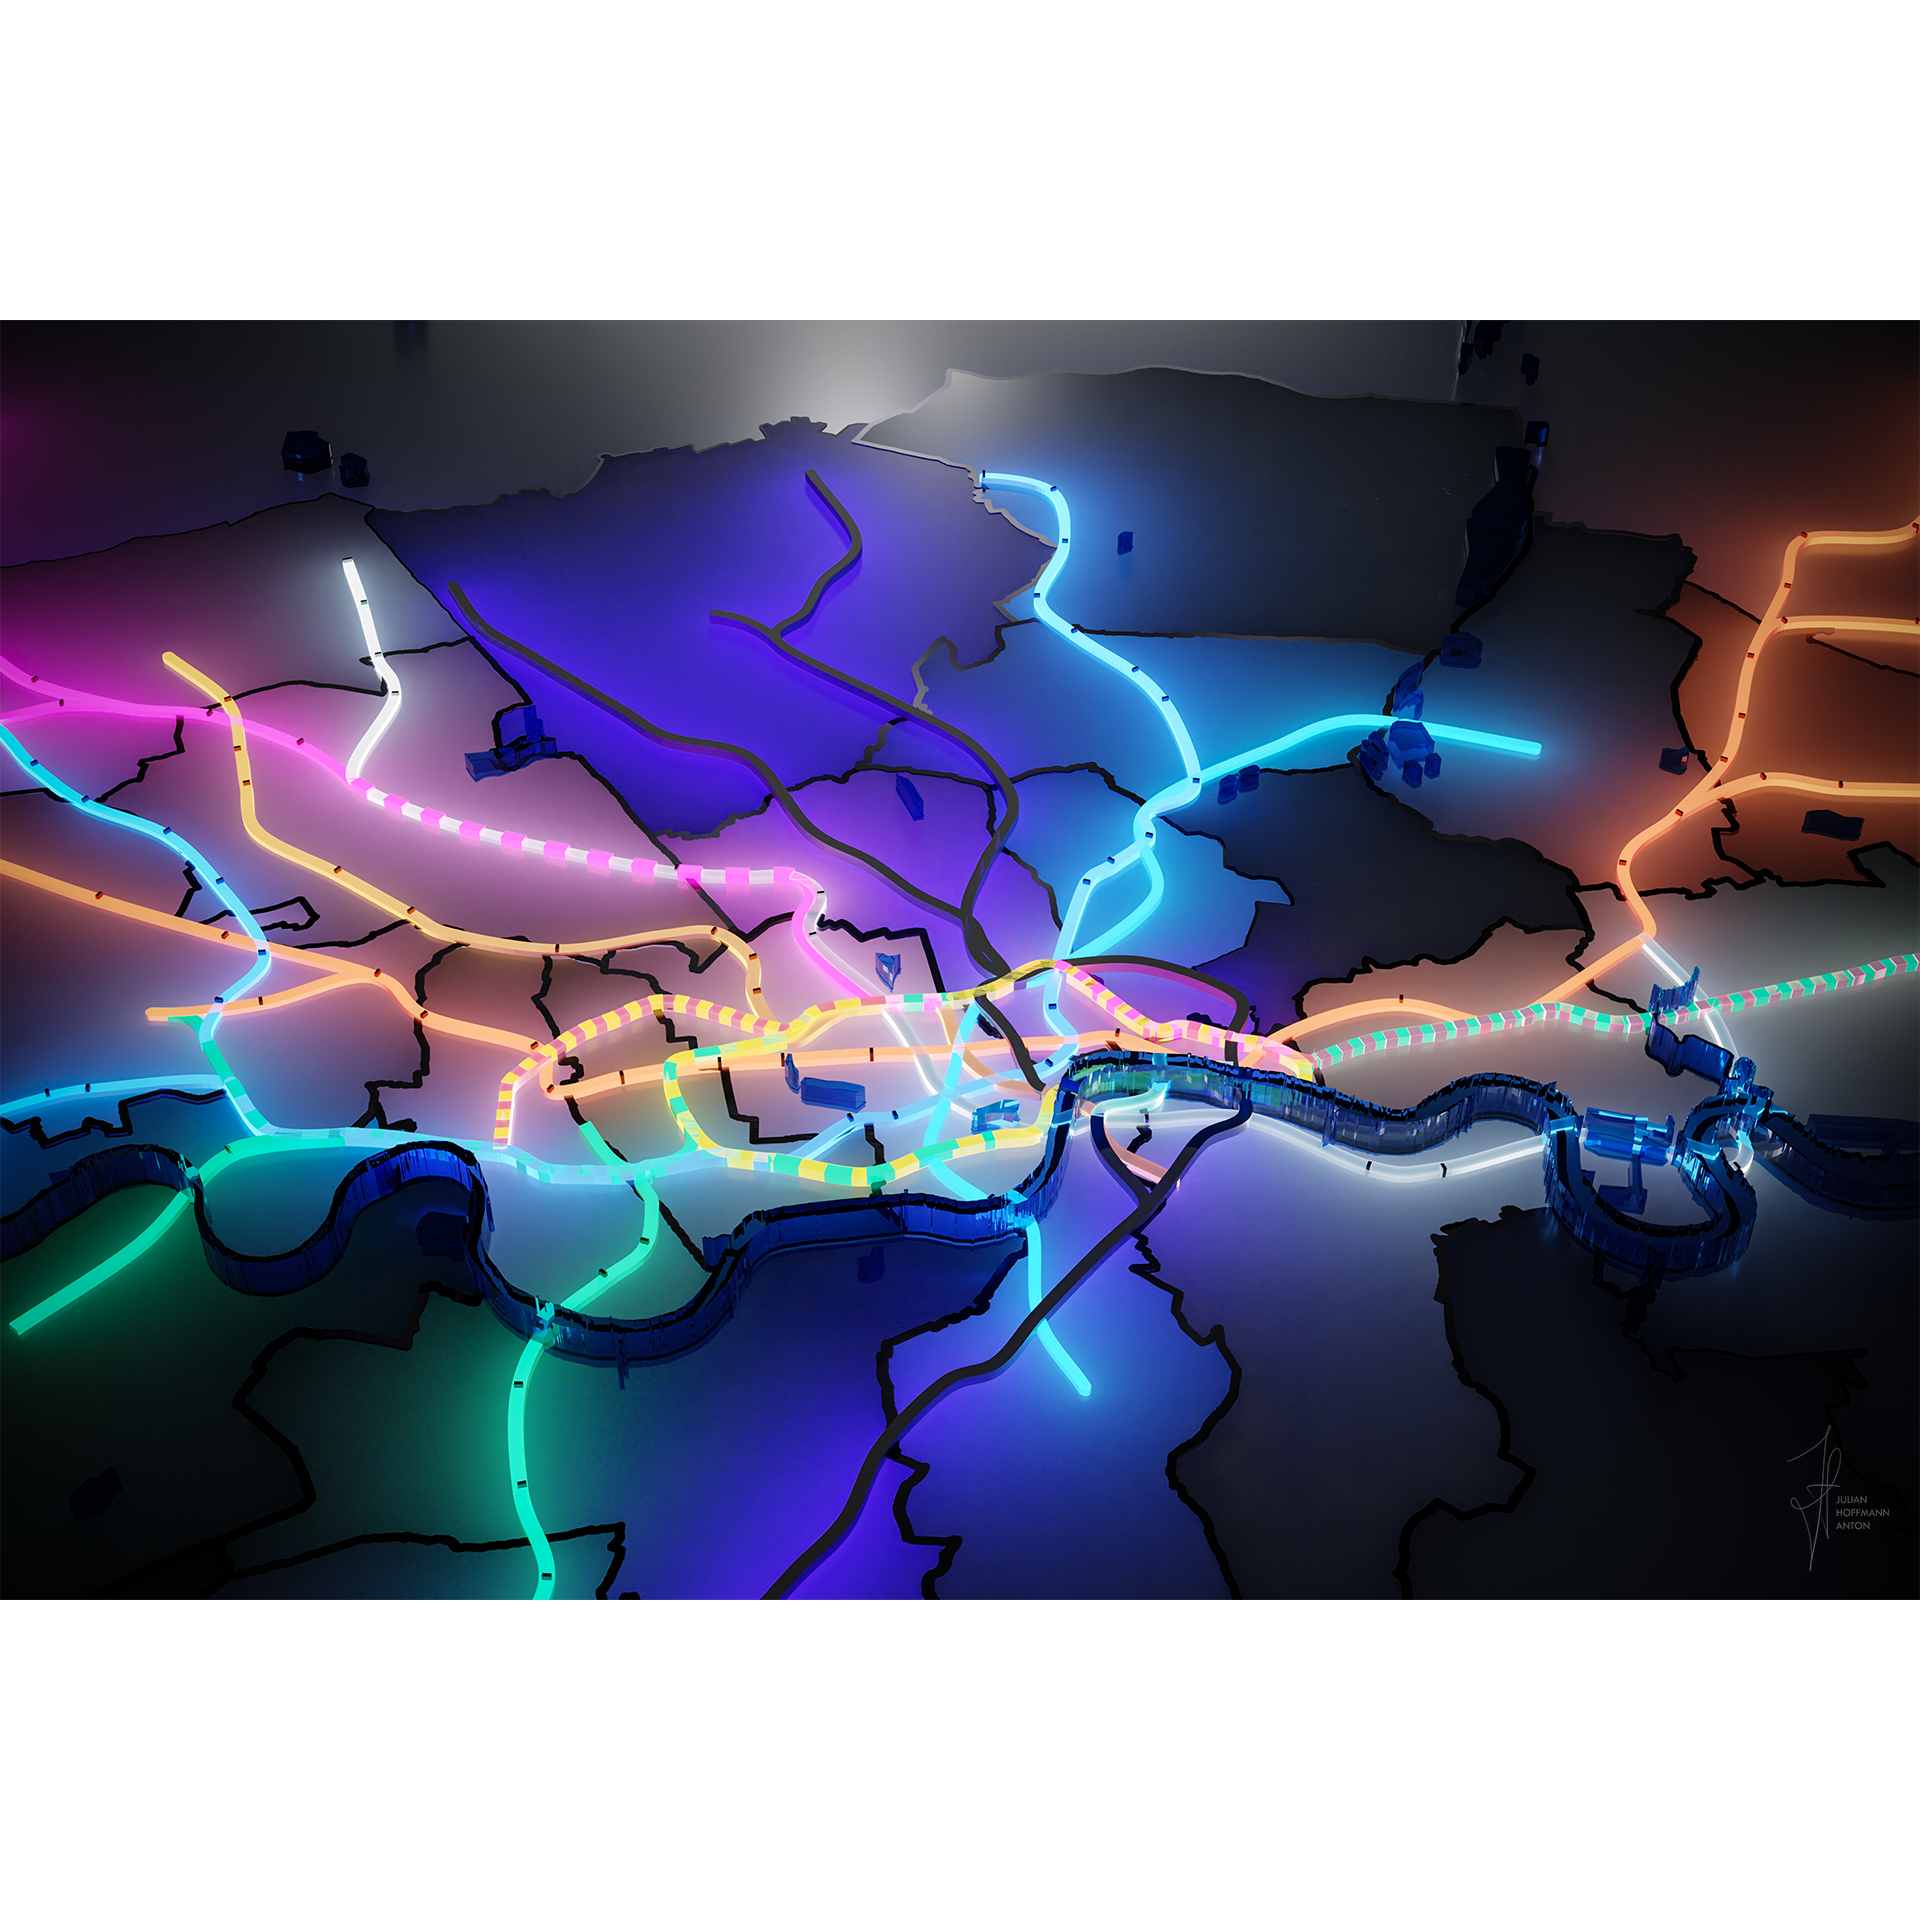
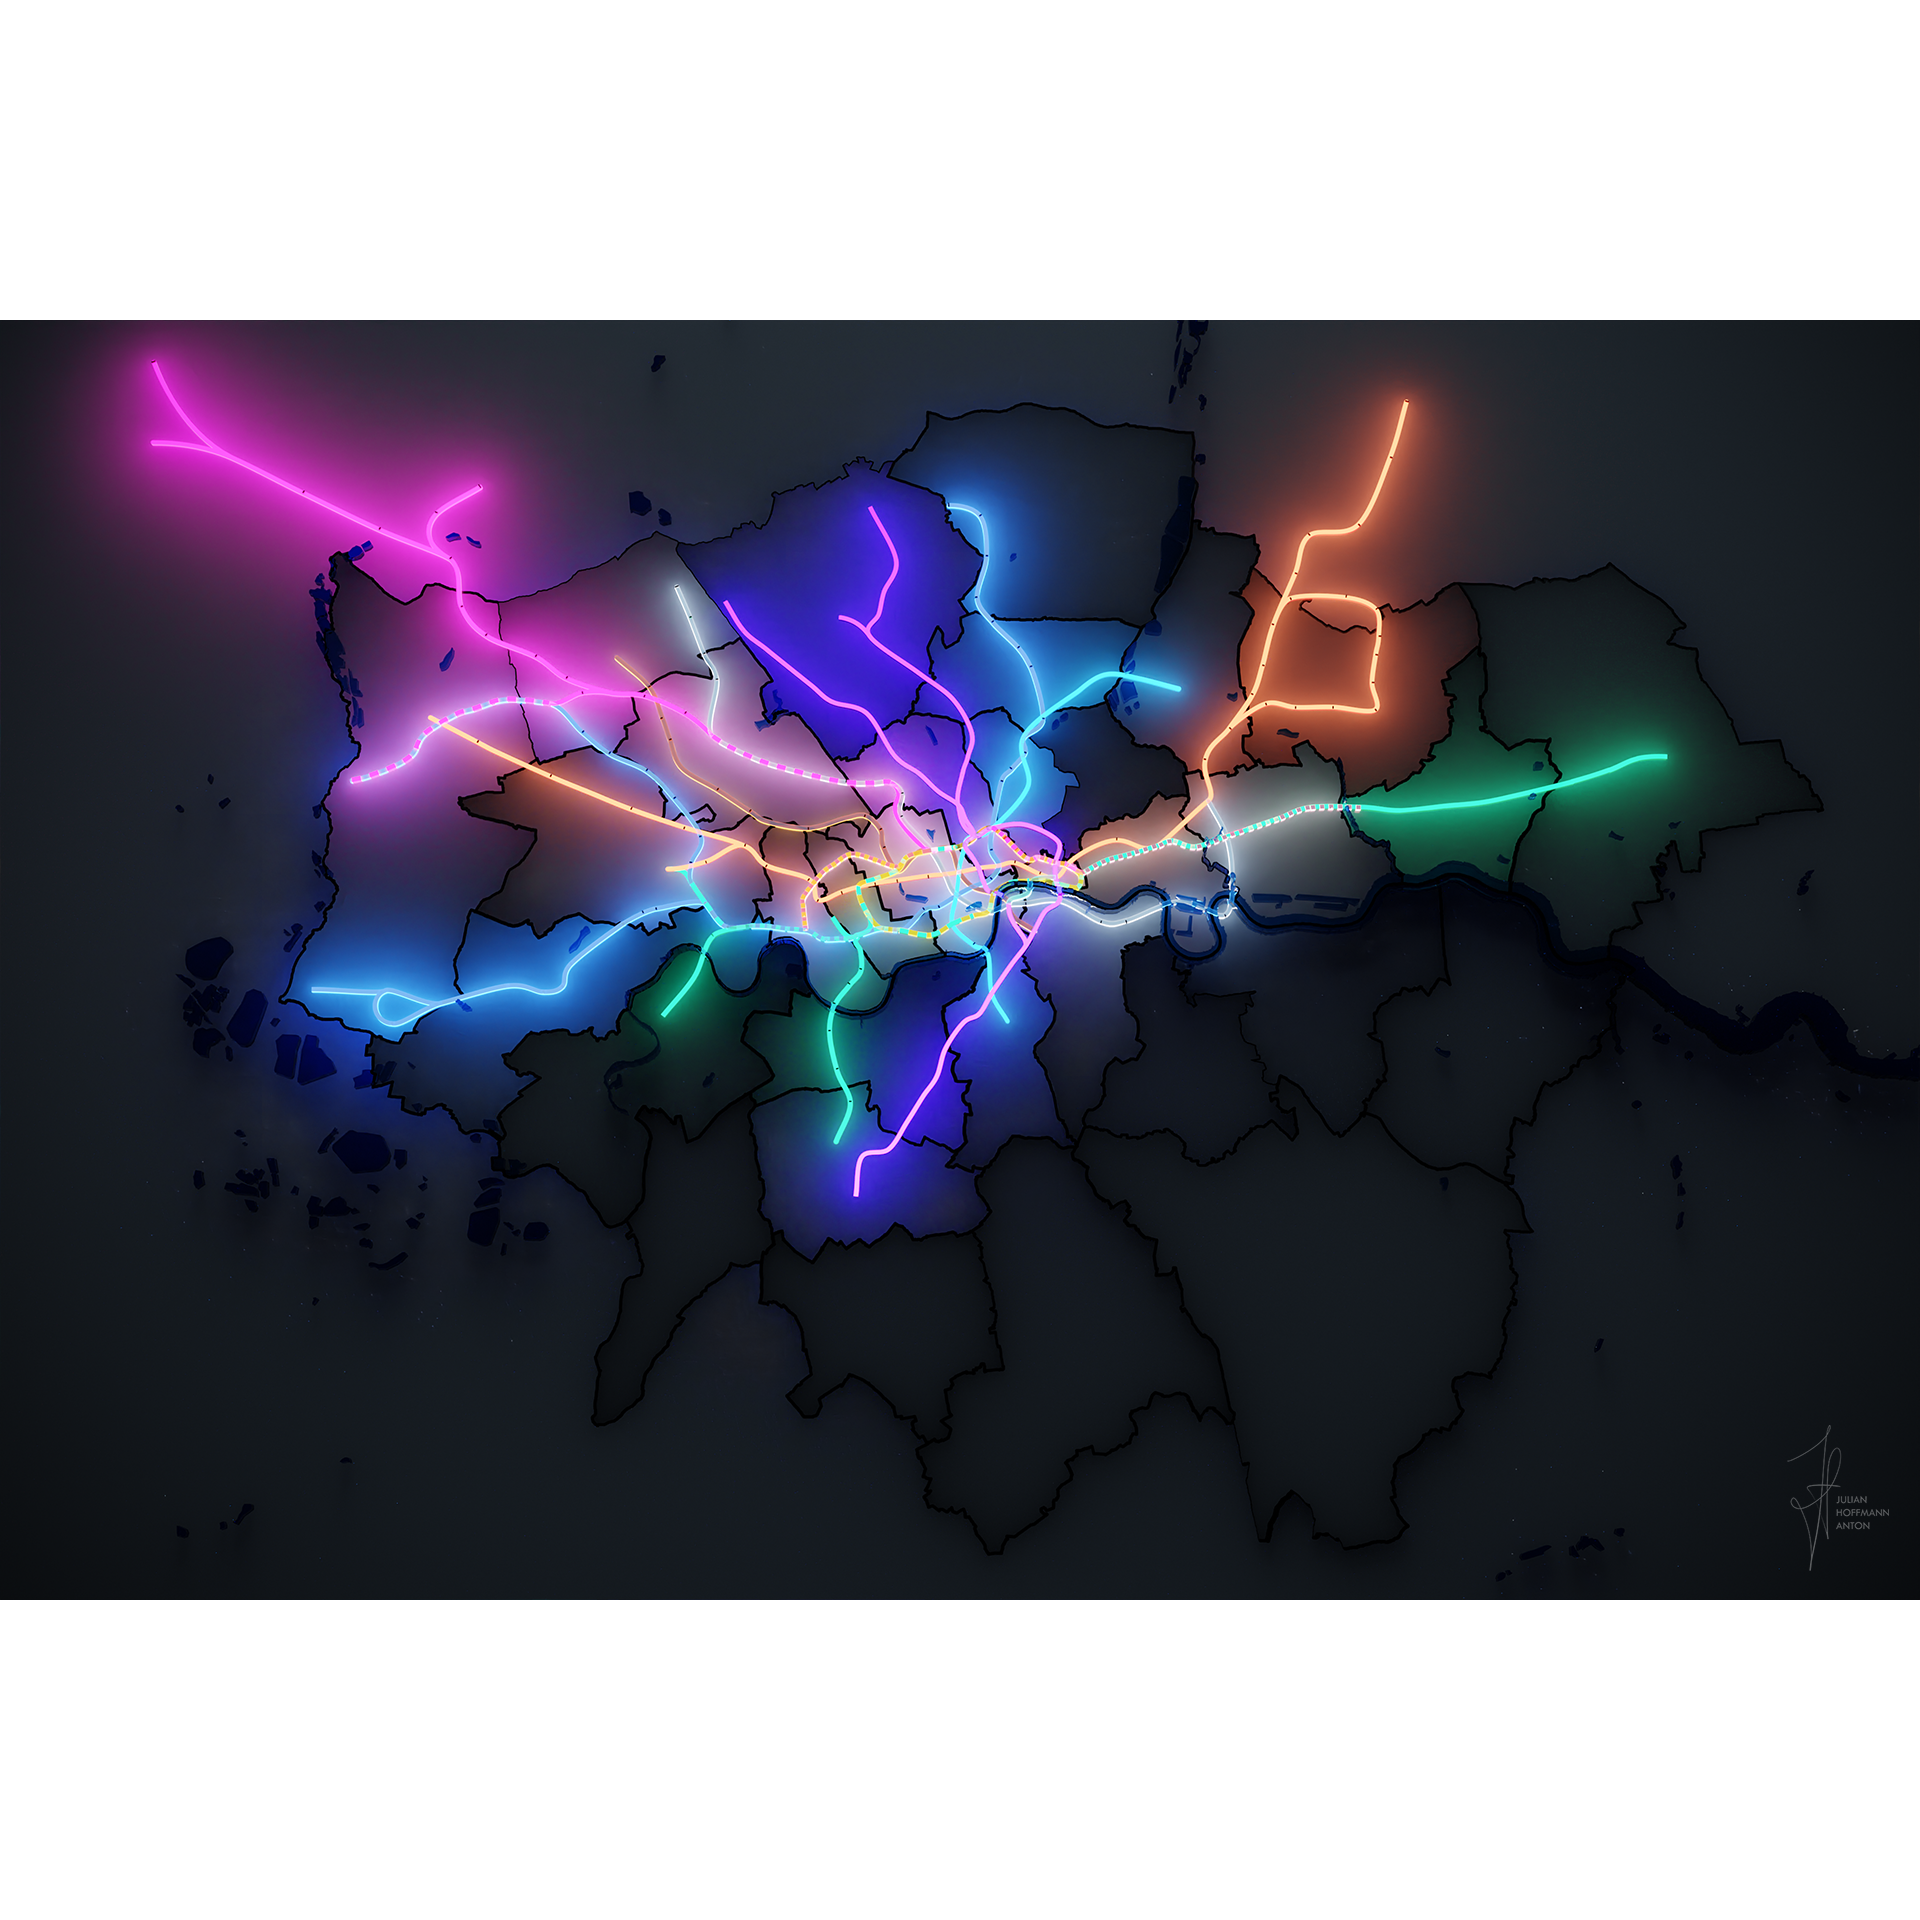
London UndegroundArtistic Visualisation of the London underground network, 2021. Made for the #30DayMapChallenge in Blender.
Downtown LA x Hollywood ElevationConcept visualisation
Greater Los Angeles PopulationPopulation Density of Los Angeles 2025. Visualisation made for GeoPostocode: get the data here! https://www.geopostcodes.com/population-by-zip-code/ Made in Blender, rendered in Cycles render engine. Behind the scenes soon: https://x.com/Julian_H0ffmann
The Geology of the MoonThe Geology of the Moon | Lunalogy A concept visualization based on the "Unified Geologic Map of The Moon" by C.M. Fortezzo, P.D. Spudis, and S.L Harrel, 2019. This piece highlights a wide variety of geological features on our celestial neighbour. It’s fascinating to explore a distant world we can marvel at during a quiet afternoon, a special evening, or a magical night. Created for the #30DayMapChallenge - Space and Time. . Made in Blender, some #rstats, Adobe Illustrator & DaVinci Resolve. #GIS
La Carte des Vins de France
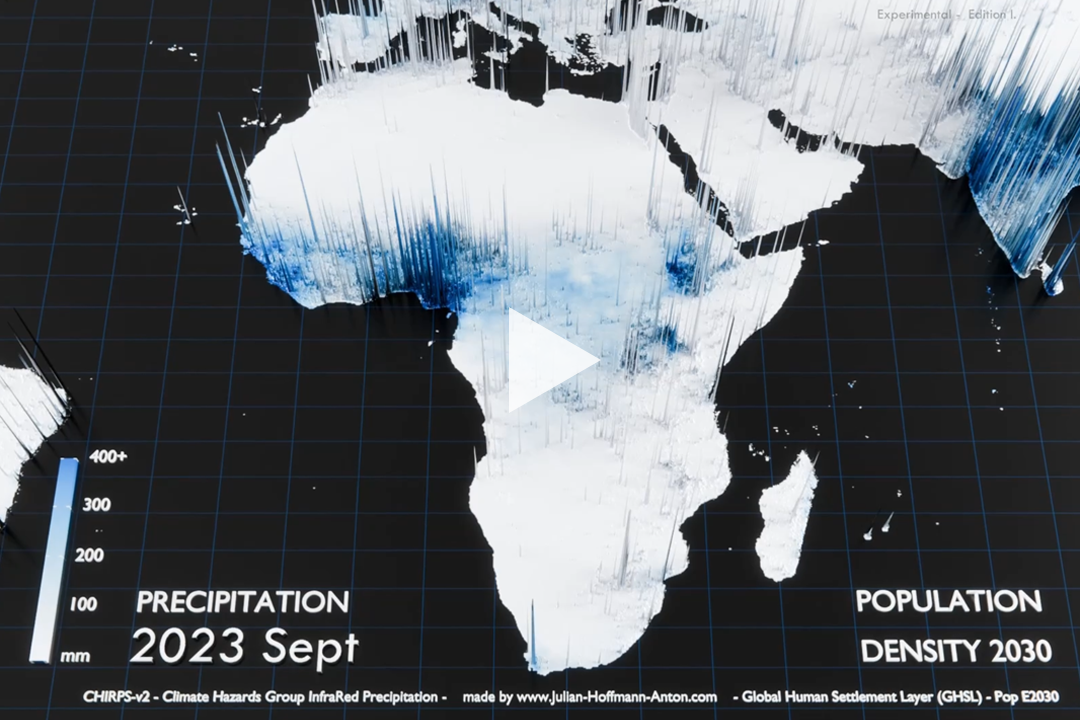
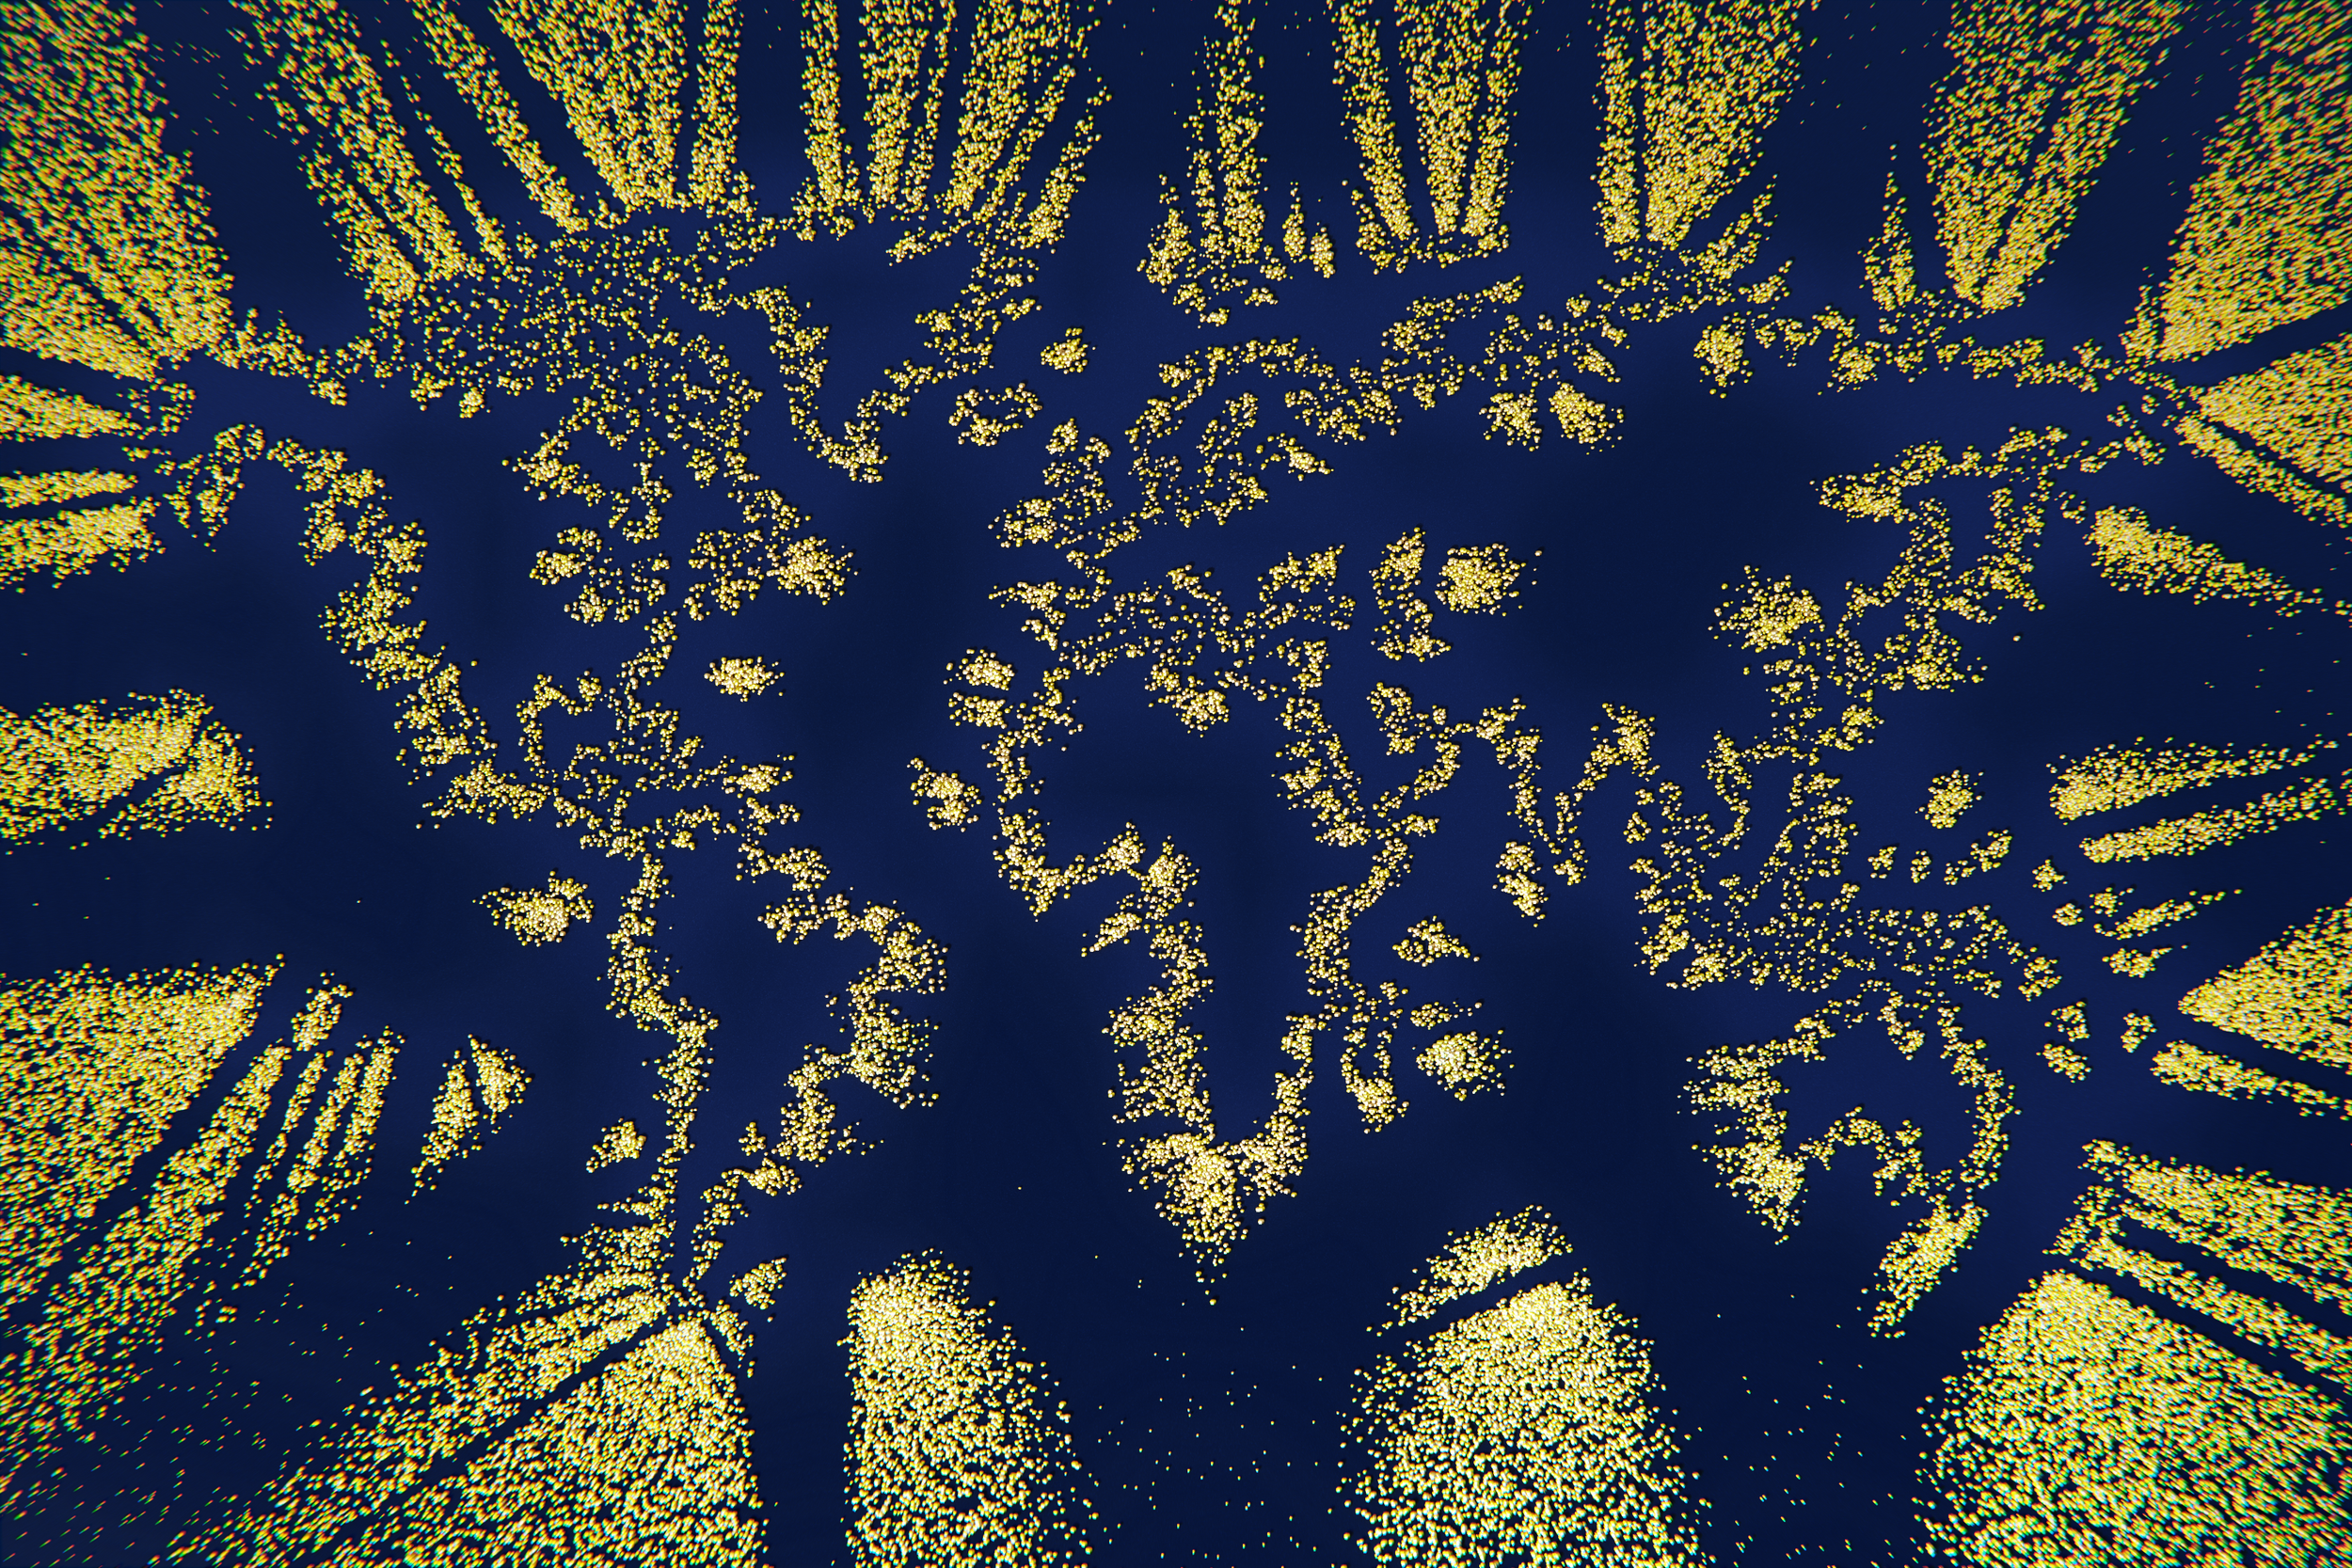
Our Human World on a Breathing Planet. This piece merges monthly precipitation patterns with population density, visualized to reflect the interplay between nature and human life, centred on Africa. Created with #Blender3D & #Rstats for the #30DayMapChallenge - Day 6: Raster / Day 28: Blue Planet. Data: CHIRPS-v2 - Climate Hazards Group InfraRed Precipitation Monthly - November 2022 to November 2024 and Global Human Settlement Layer (GHSL) - Pop E2030
The City of London
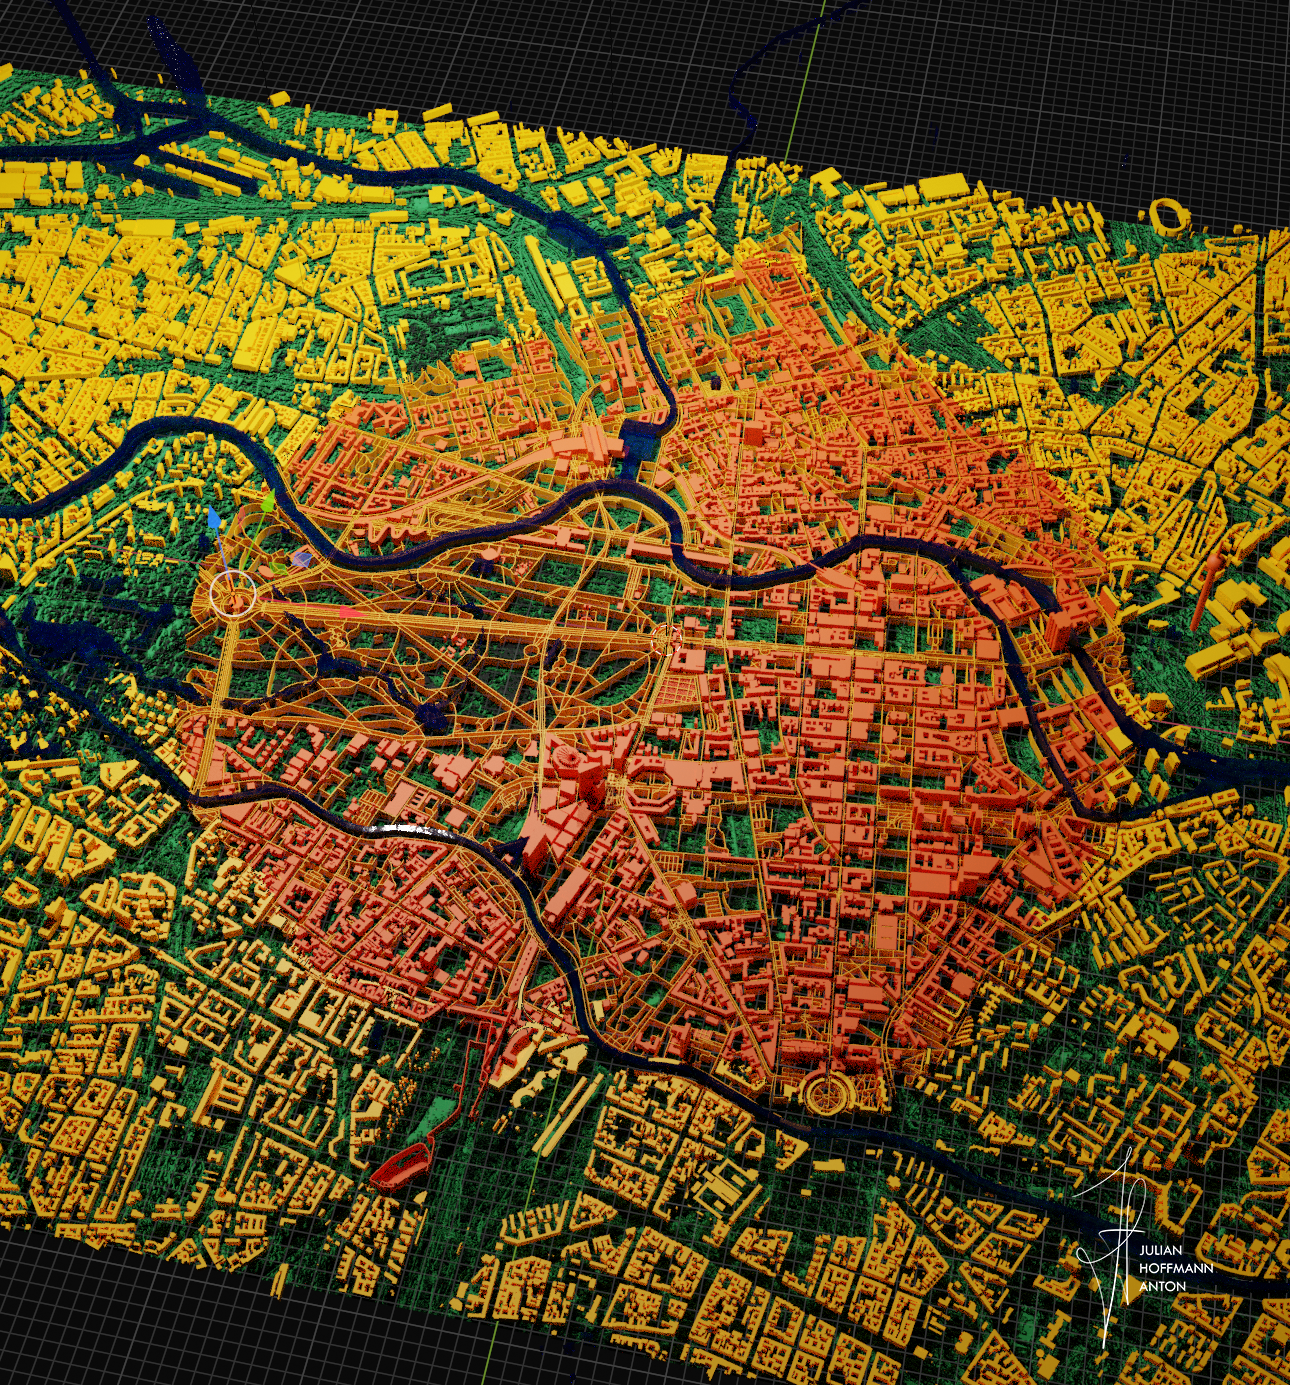
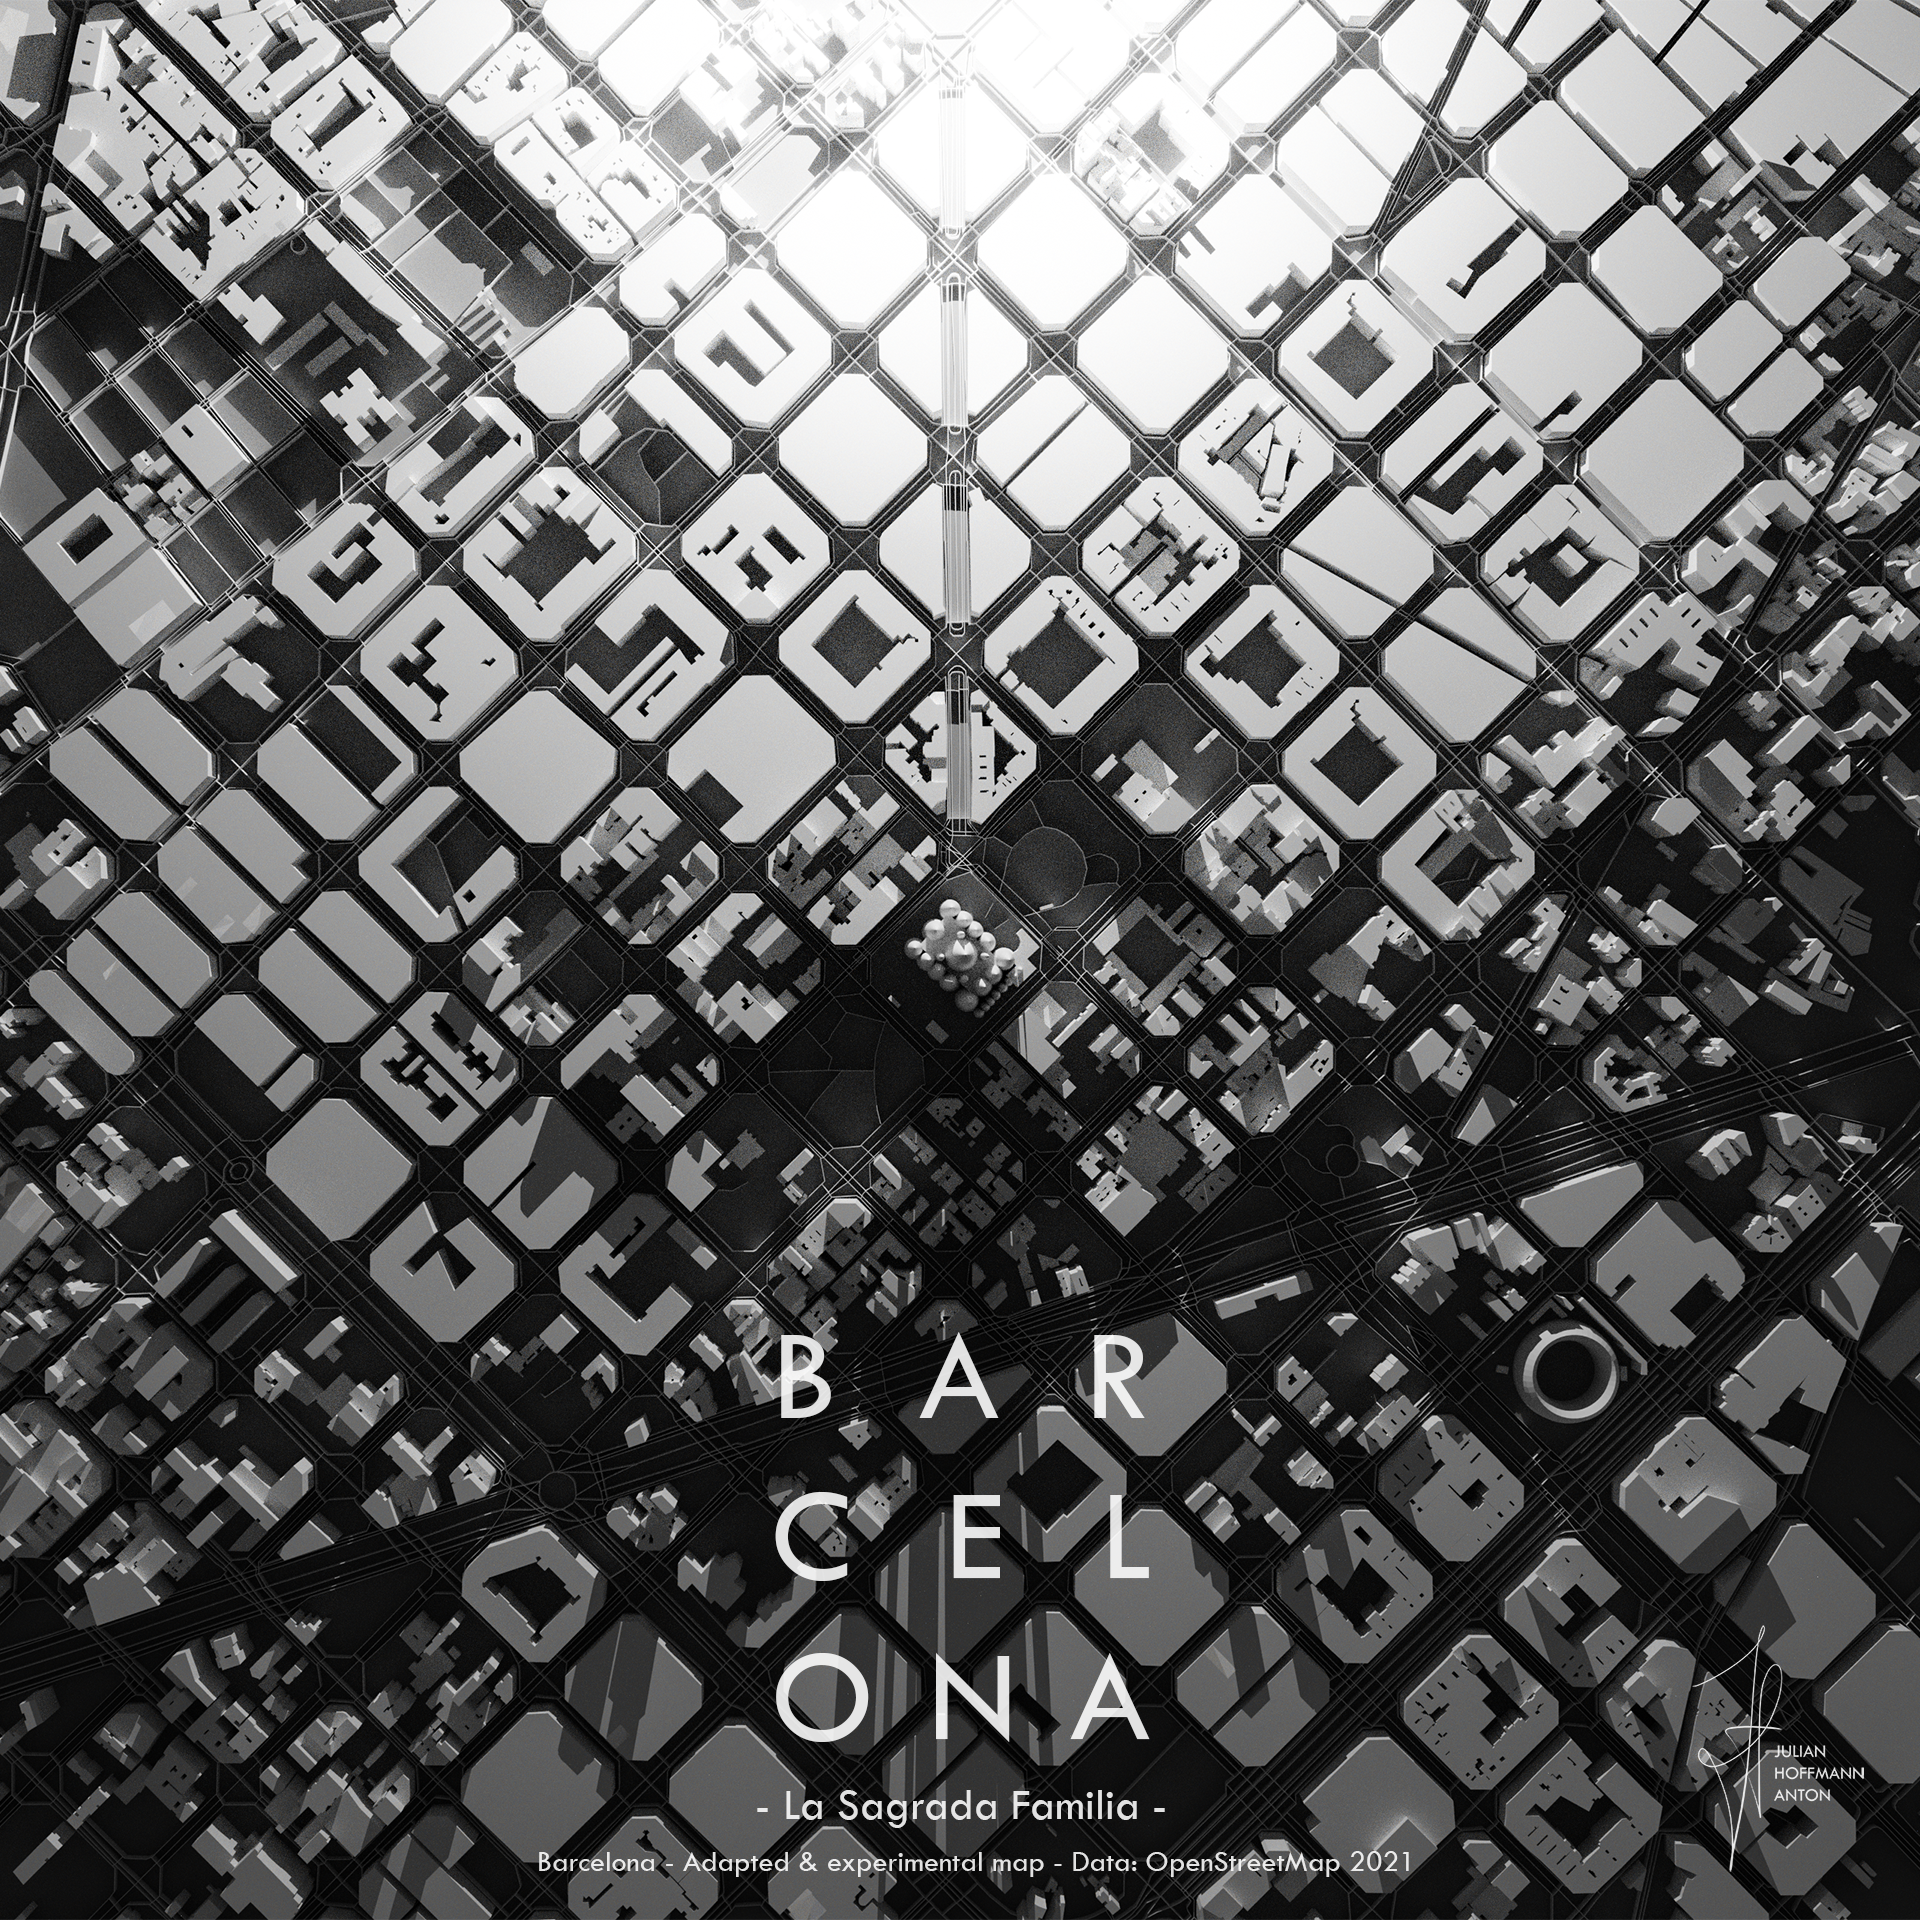
Barcelona (Typography)
Global Shipping Density Network
The Train Lines of Switzerland
World Population 1950 - 2100Experimental cartogram animation of the UN Population Prospect's (2022) estimations from 1950 to 2100. More at: www.julia-hoffmann-anton.com Analysis made in R and 3D visualisation in Blender.
Golden Age of CreativityVisual experiment created for IMEdD conference and Keynote talk in Athens: https://youtu.be/Ya38ZYH68is?si=39sR3ay6HVcJymfA
The Eiffel Tower of London
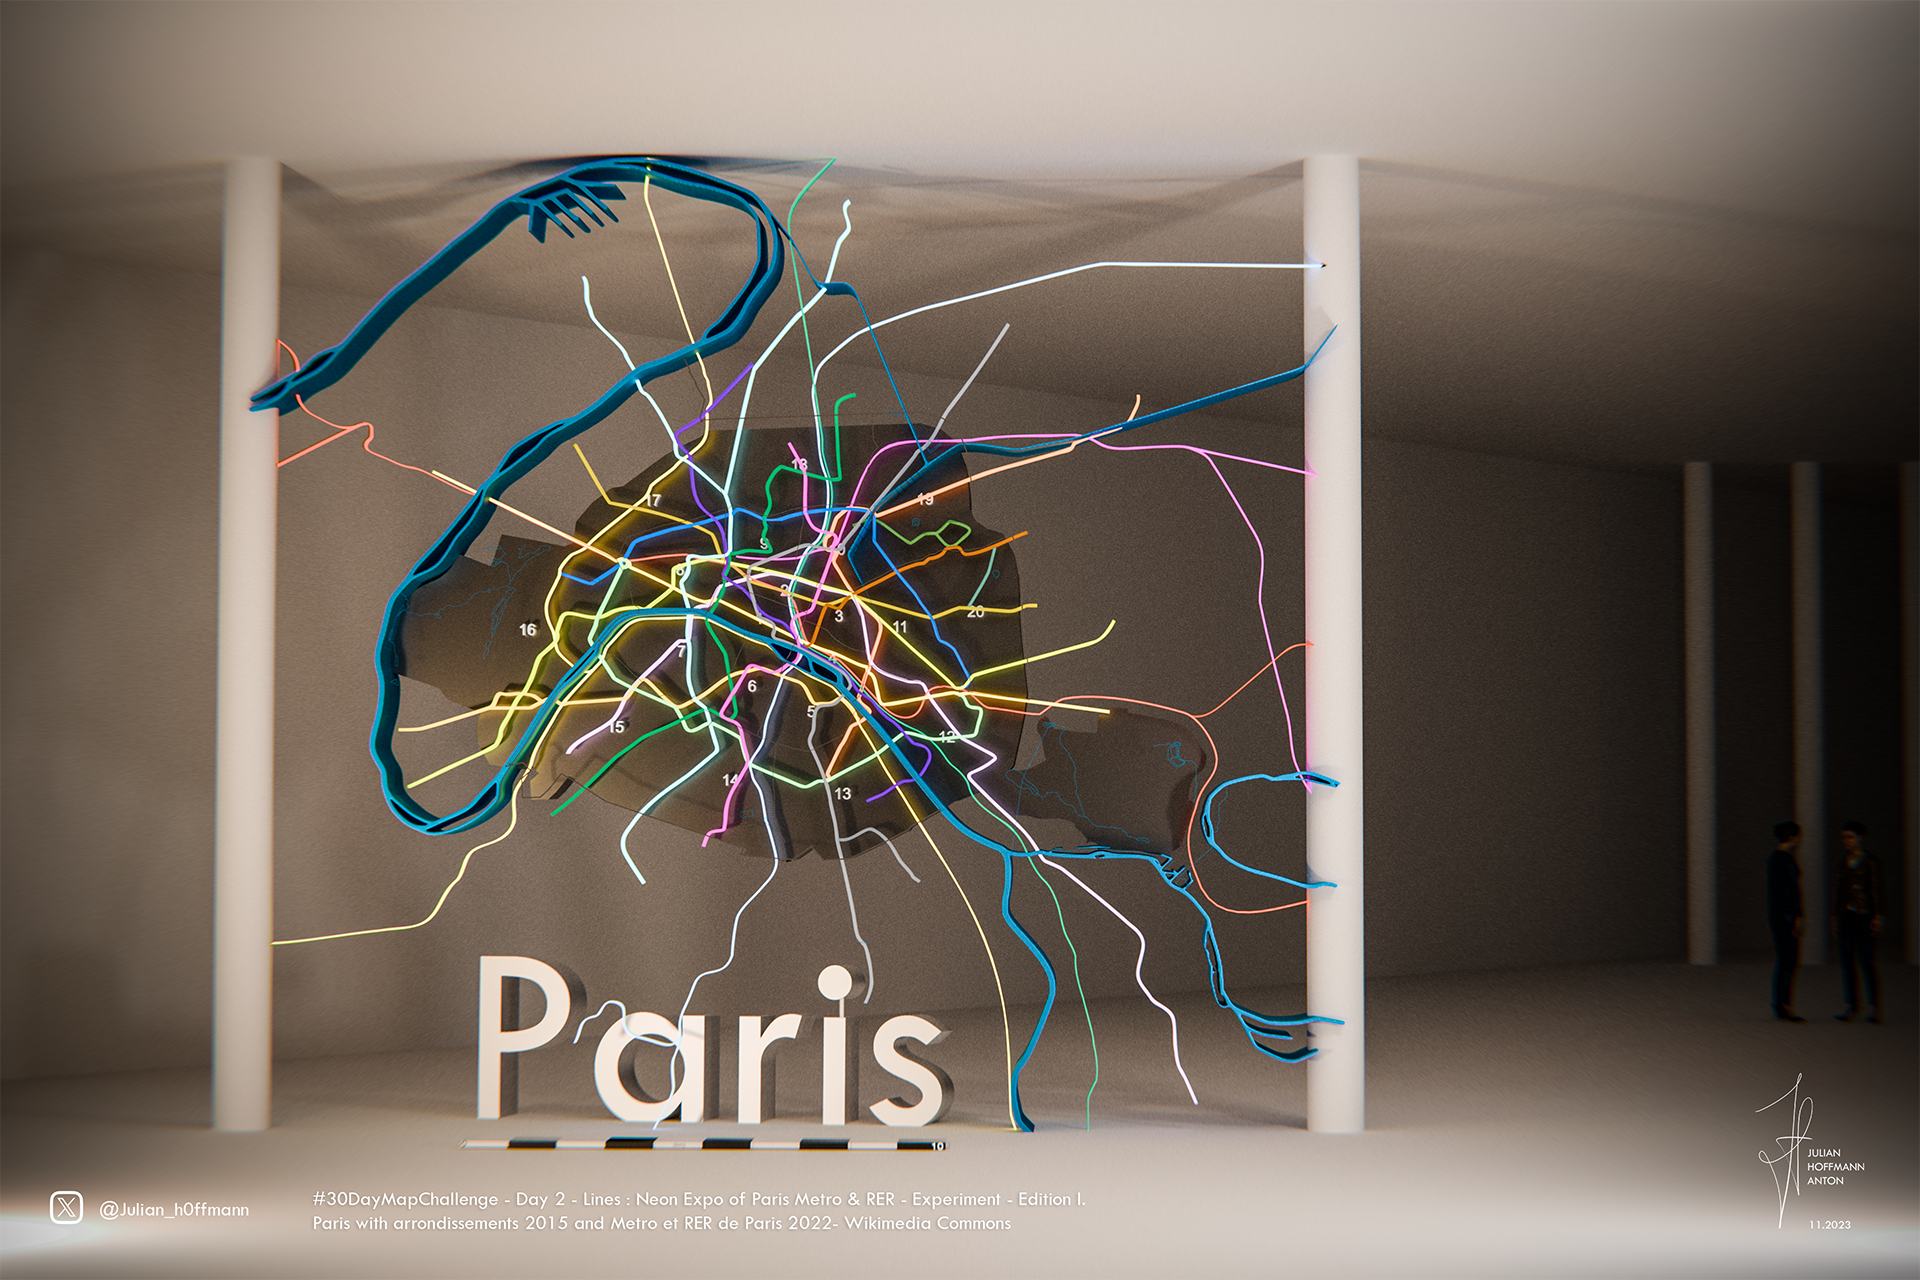
Paris Neon-Expo v1
Population density of Switzerland
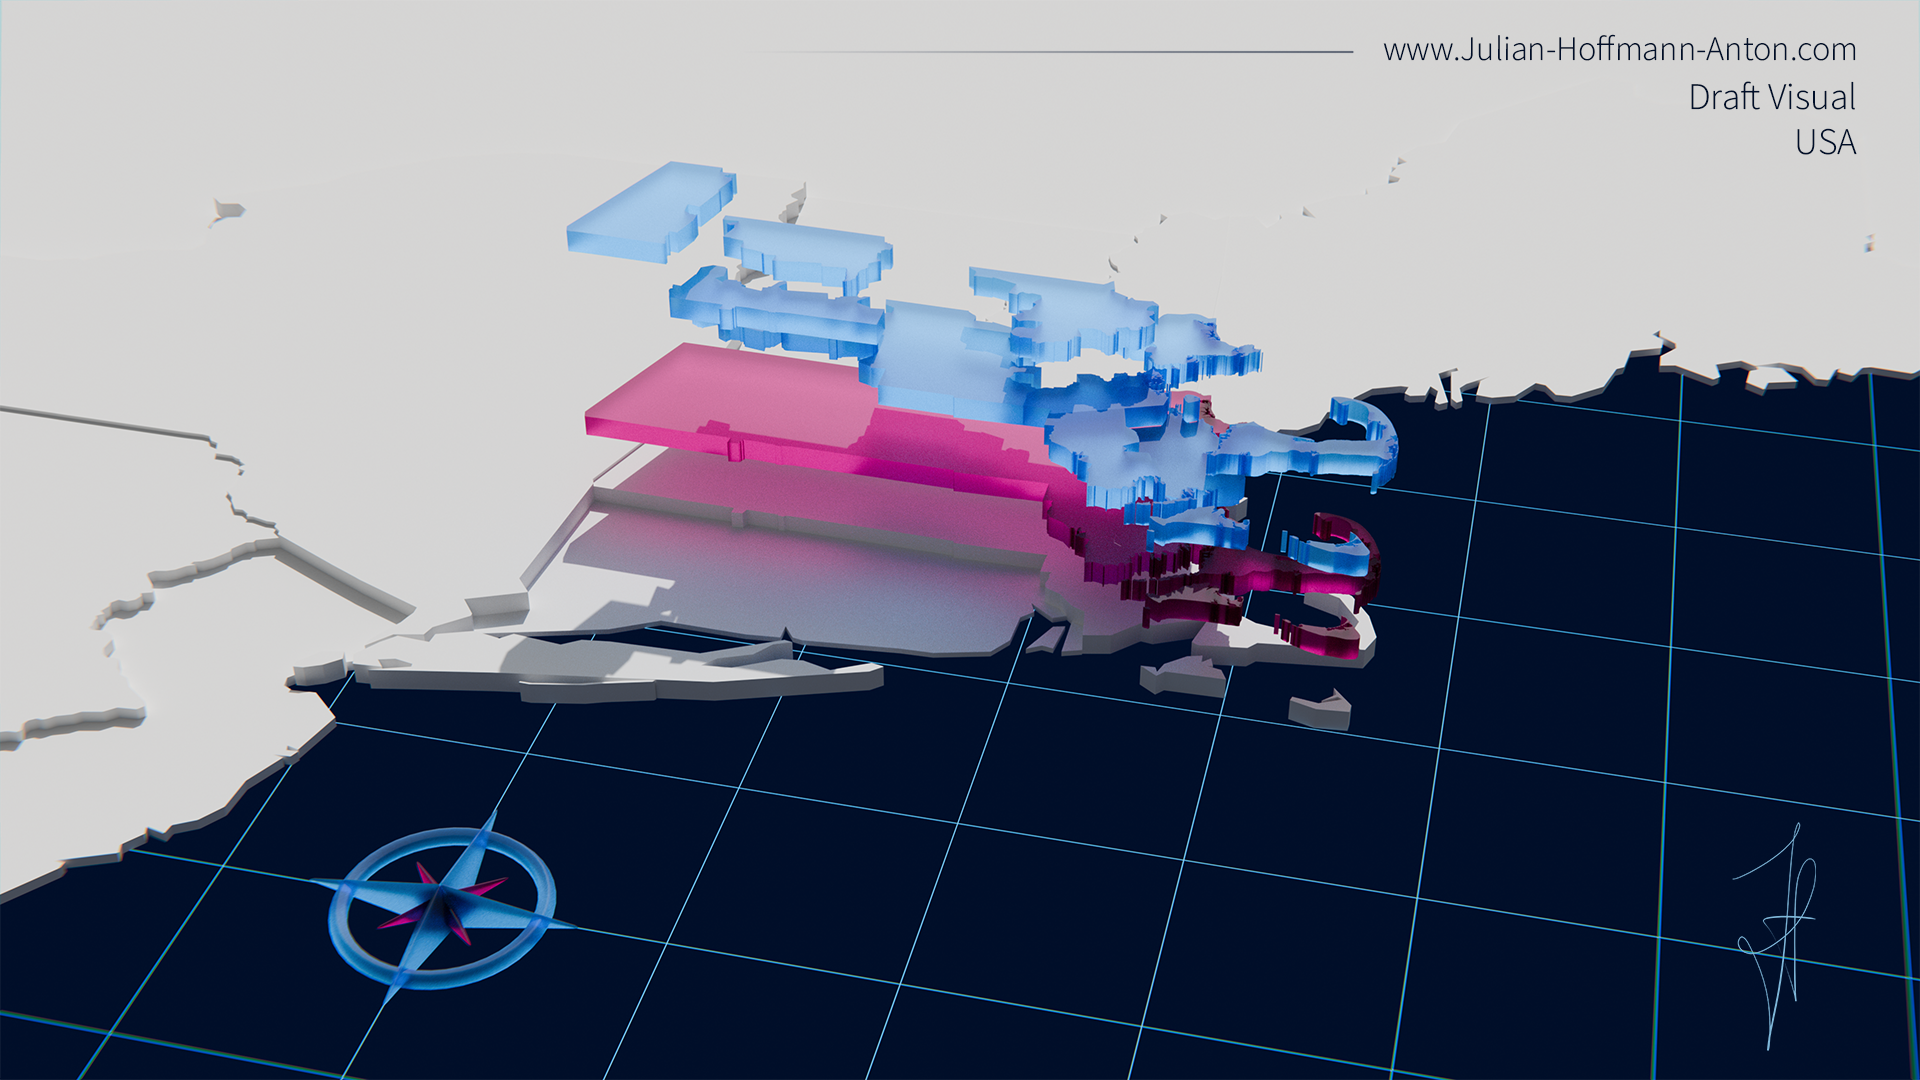
Pieces of the USADraft Visualisation
3D London
Tokyo Lines
Tokyo Eat Map BTS
Polynesian Polygons
London in 3D LiDAR
Chile Pre Fossilisation
From points to mapGolden sand
Testing Greener Worlds
Tokyo Lines (BTS)
Ports in the global liner shipping networkPorts in the global liner shipping network: Understanding their position, connectivity, and changes over time. New UNCTAD article by father and son Jan Hoffmann and Julian Hoffmann with data from MDS TRANSMODAL LIMITED. https://lnkd.in/depPGRB
Café à Paris
Raster Earth
Behind the Scenes
Containership port calls during the first 31 weeks of 2020 compared to the same period in 2019Full Article: https://unctad.org/en/pages/newsdetails.aspx?OriginalVersionID=2465
Urban World
Spatial Dish I.
Connected Countries in MENA
London: Spinning my Labytinth I.
Top Import-Origin
Connected Ports & Oceans
Mont Blanc
Top Export-DestinationsTop export-destinations for manufactured goods.
Map: Size (TEU) of the largest container ship deployedFull article: https://unctad.org/news/bigger-ships-and-fewer-companies-two-sides-same-coin
Spatial Memories I.
One Year Journey
Manufactured Goods IITrade of Manufactured Goods in 2016 visualised. Source of data: UN COMETRADE 2018. Part of my MSc Dissertation
Life is a maze
Africa Dimensions
Cartogram Ship Arrivals and DaysData MarineTraffic and UNCTAD
Bivariate Maps
Manufactured Goods I
Public Transport Stop Density
Mont Blanc - Top View
World map features A and B
World Population
Transport Weak Spot Estimator
info
/
1
2
3
4
5
6
7
8
9
10
11
12
13
14
15
16
17
18
19
20
21
22
23
24
25
26
27
28
29
30
31
32
33
34
35
36
37
38
39
40
41
42
43
44
45
46
47
48
49
50
51
52
53
54
55
56
57
58
59
60
61
62
63
64
65
66
67
68
69
70
71
72
73
74
75
76
77
78
79
80
81
82
83
84
85
86
87
88
89
90
91
92
93
94
95
96
97
98
99
100
101
102
103
104
105
106
107
108
109
110
111
112
113
114
115
·
·
·
·
·
·
·
·
·
·
·
·
·
·
·
·
·
·
·
·
·
·
·
·
·
·
·
·
·
·
·
·
·
·
·
·
·
·
·
·
·
·
·
·
·
·
·
·
·
·
·
·
·
·
·
·
·
·
·
·
·
·
·
·
·
·
·
·
·
·
·
·
·
·
·
·
·
·
·
·
·
·
·
·
·
·
·
·
·
·
·
·
·
·
·
·
·
·
·
·
·
·
·
·
·
·
·
·
·
·
·
·
·
·
·